

Briefly: In our opinion, full (200% of the regular size of the position) speculative short positions in gold, silver and mining stocks are justified from the risk/reward perspective at the moment of publishing this alert.
It was easy to get excited about Monday’s rally. Gold and silver soared, and the latter even moved to its late-March highs during just one session. But it was all fake, and you knew it – that’s what we explained in yesterday’s analysis. GDX even declined more than it had gained on Monday, underperforming gold once again. Is there anything that could prevent gold’s decline?
Of course – more bullish news. But, as we elaborated yesterday, that would likely simply delay the decline once again – it would be unlikely to prevent it entirely. Still, let’s not forget that the next important reversal date for the entire precious metals sector is just around the corner – the April 9 session or its near surrounding (say +/- 3 trading days) is likely to trigger a rebound.
Given the confirmed short-term breakout in the USD Index, it’s likely that it will rally shortly, and that gold, silver, and mining stocks will decline very soon. In this case, the April 9 reversal would likely be a local bottom. But, there’s also a possibility (its currently less likely, but something that’s worth keeping in mind) that the precious metals sector will move back and forth until that date. In this case, the reversal or its surrounding would likely mean the start of the decline. So, we’re in the position where PMs are likely to slide almost immediately or a bit later, but not later than the end of the next week.
Let’s take a look at the charts to see what changed yesterday (chart courtesy of http://stockcharts.com).
Silver’s Daily “Strength” Invalidated
In yesterday’s alert, we explained why silver’s daily rally was not a bullish development:
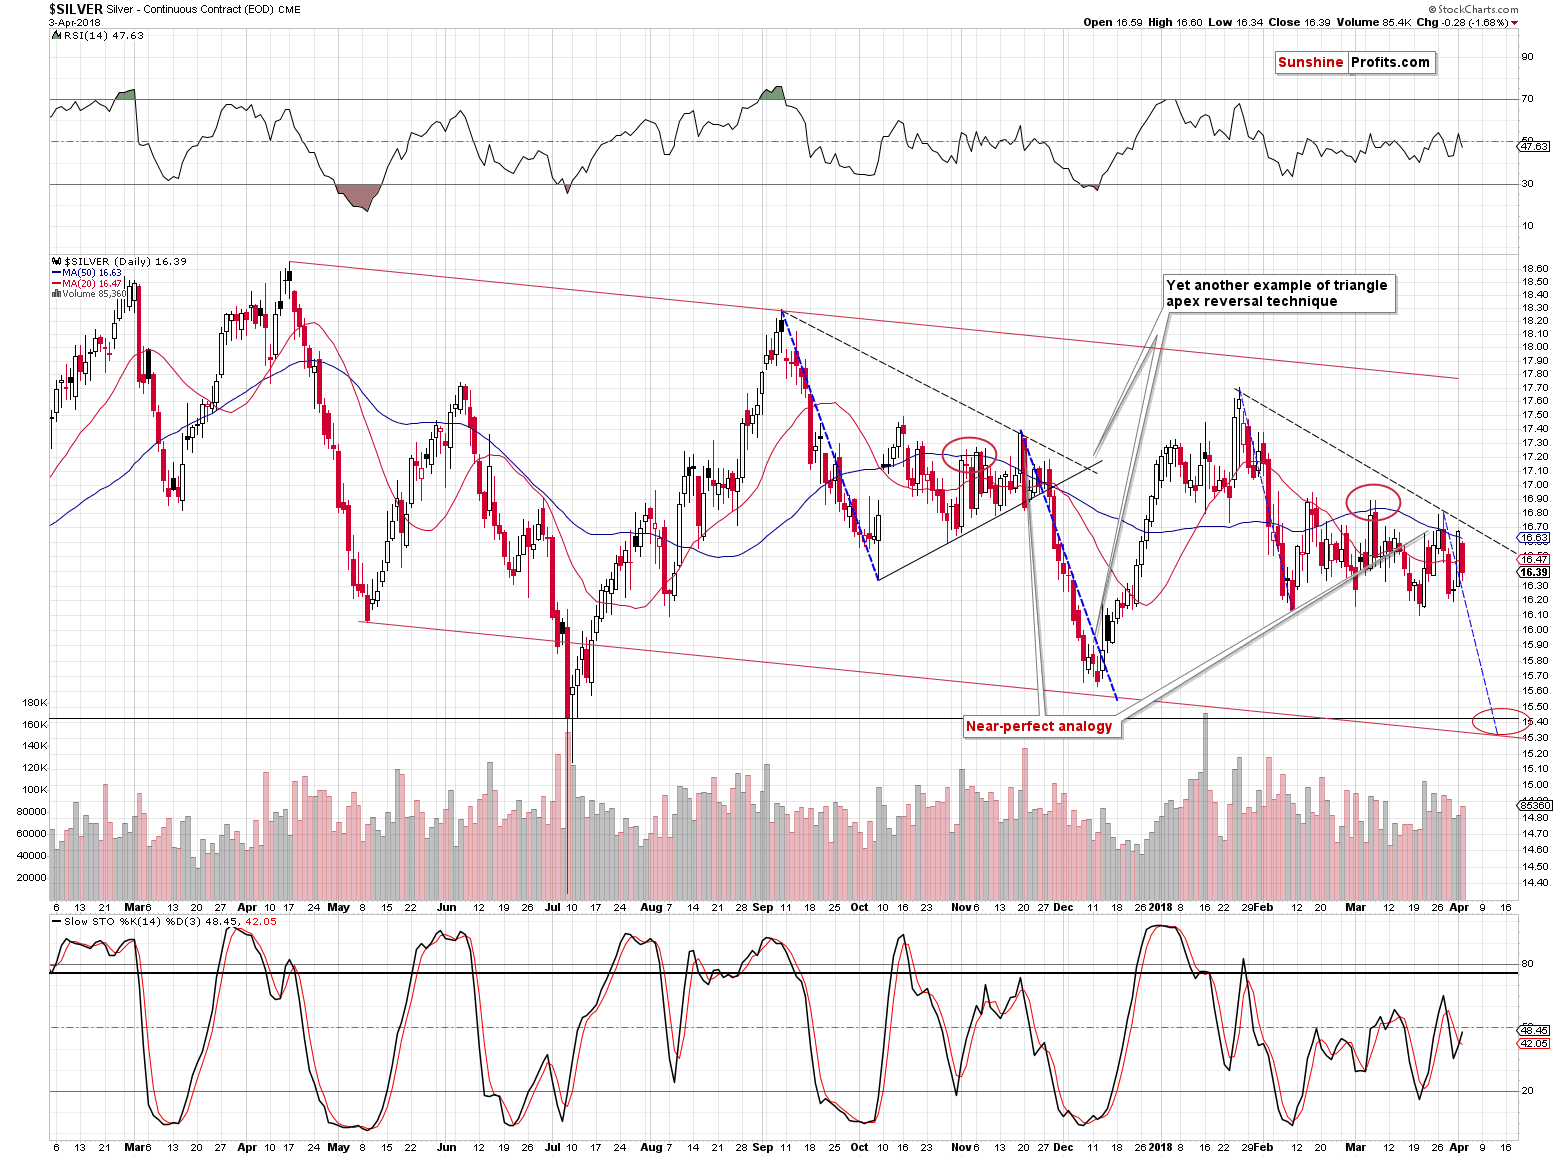
The white metal moved sharply higher during yesterday’s session. In fact, it moved to the late-March high erasing two previous daily declines during just one day. But, unless you are new to our analyses, you know that silver’s big daily rallies are often fake moves and they are good entry moments for short, not long positions. This is especially the case, when silver outperforms the rest of the precious metals sector. Was this the case?
The above once again turned out to be true. Silver still likes to make fun of those who want to apply technical analysis to it without making sure that all the rules do indeed work on this particular market.
In terms of the analogy to the pattern that we saw from September 2017 to early December 2017, we could now be in a situation similar to Nov 28, 2017 – right before the decline.
Gold’s Extra Pop-up
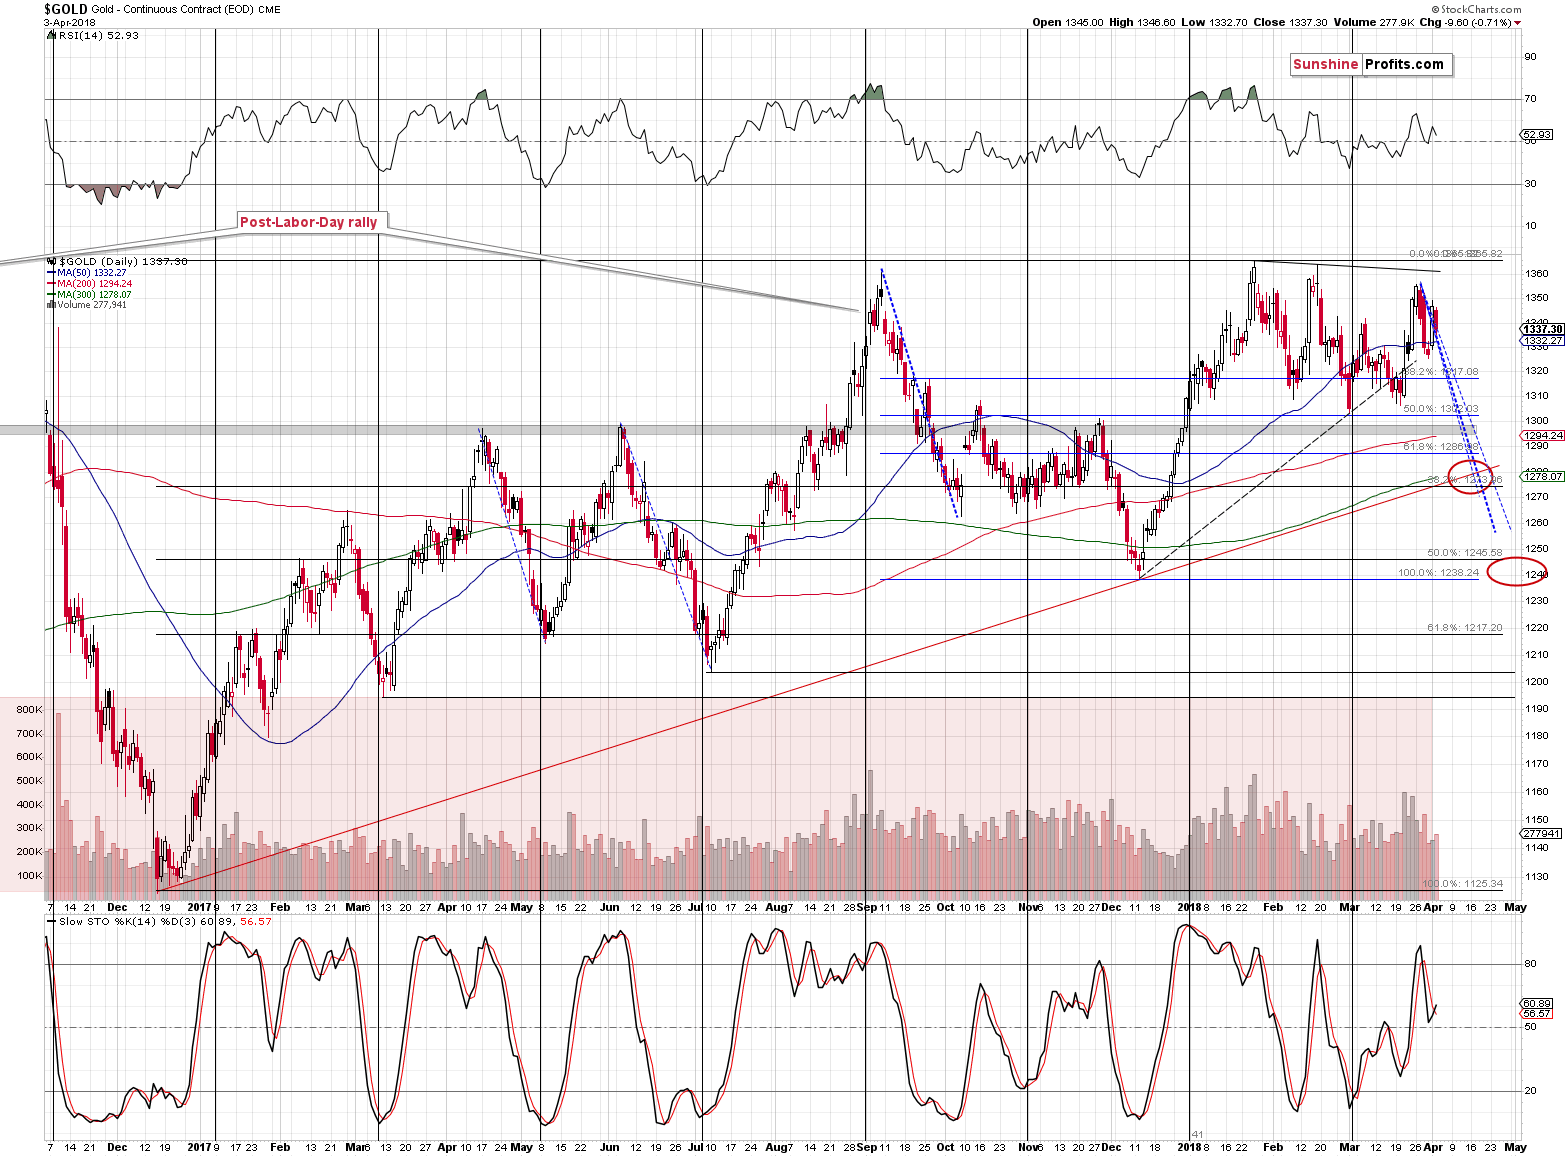
Gold moved lower, erasing approximately half of Monday’s rally and the price of gold is now well in tune with the shape of the previous declines as it’s at the declining dashed blue lines.
What we wrote yesterday about the Monday’s rally being the “extra pop-up” remains up-to-date:
In the previous alerts, we discussed the triple tops in gold and we wrote that they were followed by one final extra pop-up before the decline. Yesterday’s upswing would perfectly fit that pattern, which is another reason not to view it as something bullish. The pattern simply continued, and the implications didn’t change – they remain bearish.
Today’s approximately $11 pre-market upswing doesn’t seem to change much – the last few trading days still look like the “extra pop-up” within the above-mentioned formation. The outlook remains bearish.
Miners’ Underperformance Continues
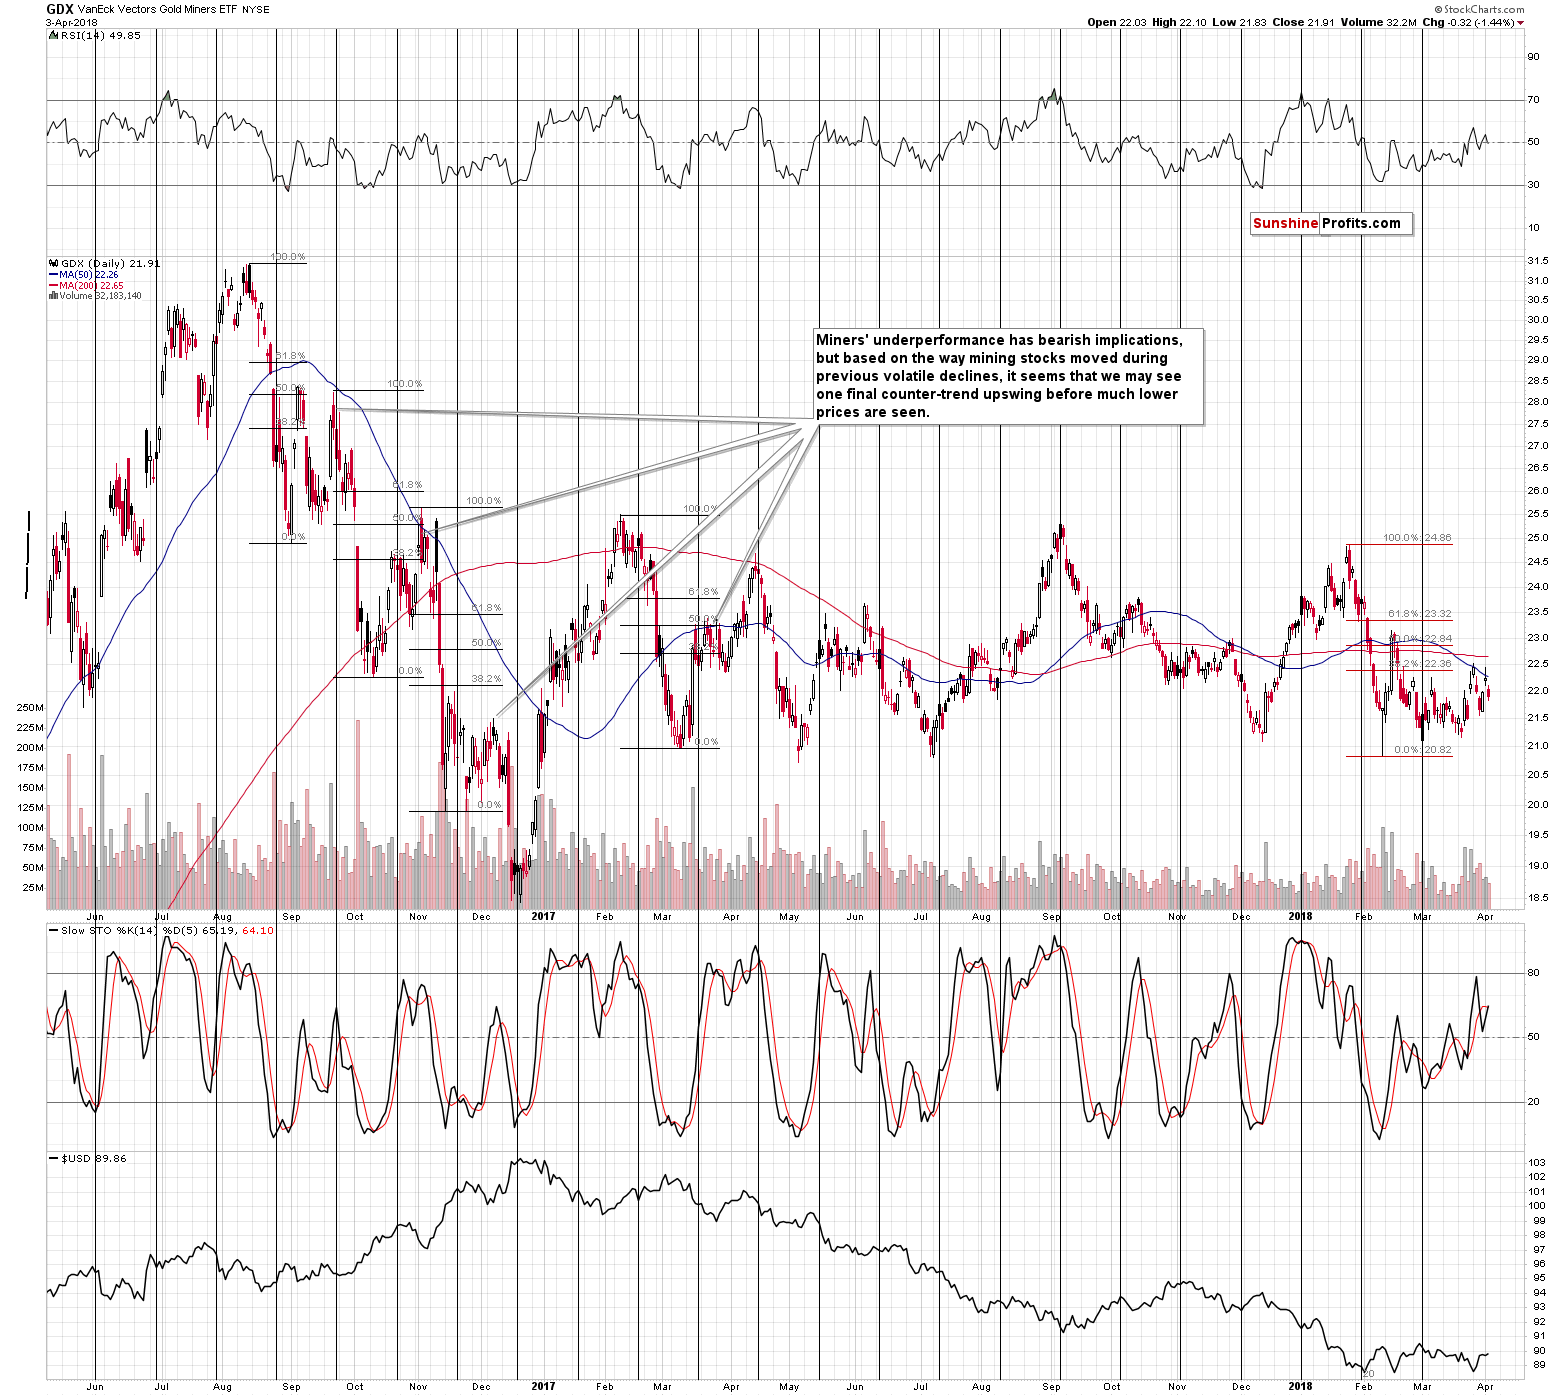
Gold erased about half of Monday’s rally, but at the same time, GDX declined more than it had rallied on Monday. That’s yet another clear sign of underperformance of the miners. The implications thereof remain bearish.
Forex Implications
In yesterday’s alert, we described the current situation in the USD Index and we wrote the following:
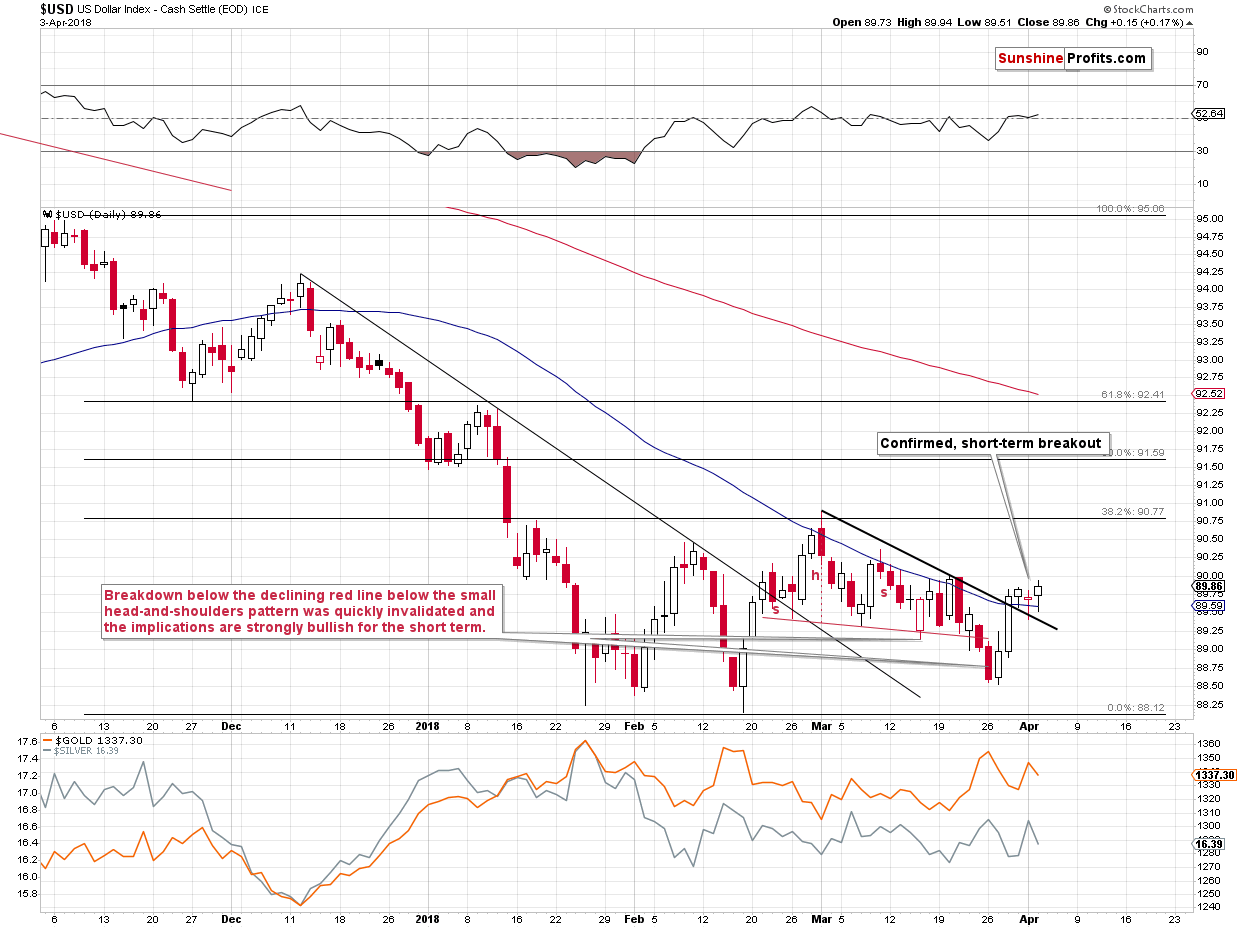
The last two sessions were quite boring in case of the USD Index, but the implications quickly become bearish, once one realizes that these two sessions took place right after a breakout. Yesterday’s close above the declining, short-term resistance / support line was the third close after the breakout – the one that confirmed it. Higher values of the USD are now very likely.
It may be a bullish sign for the precious metals sector that yesterday’s rally in it took place without a big (only a relatively small one) decline in the USD Index. However, we don’t buy into this bullishness just yet. It was just a single-day phenomenon and today’s pre-market action seems to confirm our view. At the moment of writing these words, gold is down by $4.30 while the USD Index is down by 0.15. If there were truly bullish implications of yesterday’s session, gold should have gone higher once again. It didn’t, which – along with other bearish signs discussed today – suggests that yesterday’s gold-USD link was rather accidental.
The above remains up-to-date. Yesterday’s session showed that gold really doesn’t want to move higher and that Monday’s outperformance was not real. Since the USD is after a breakout, then it should rally any minute now. Why isn’t it soaring yet?
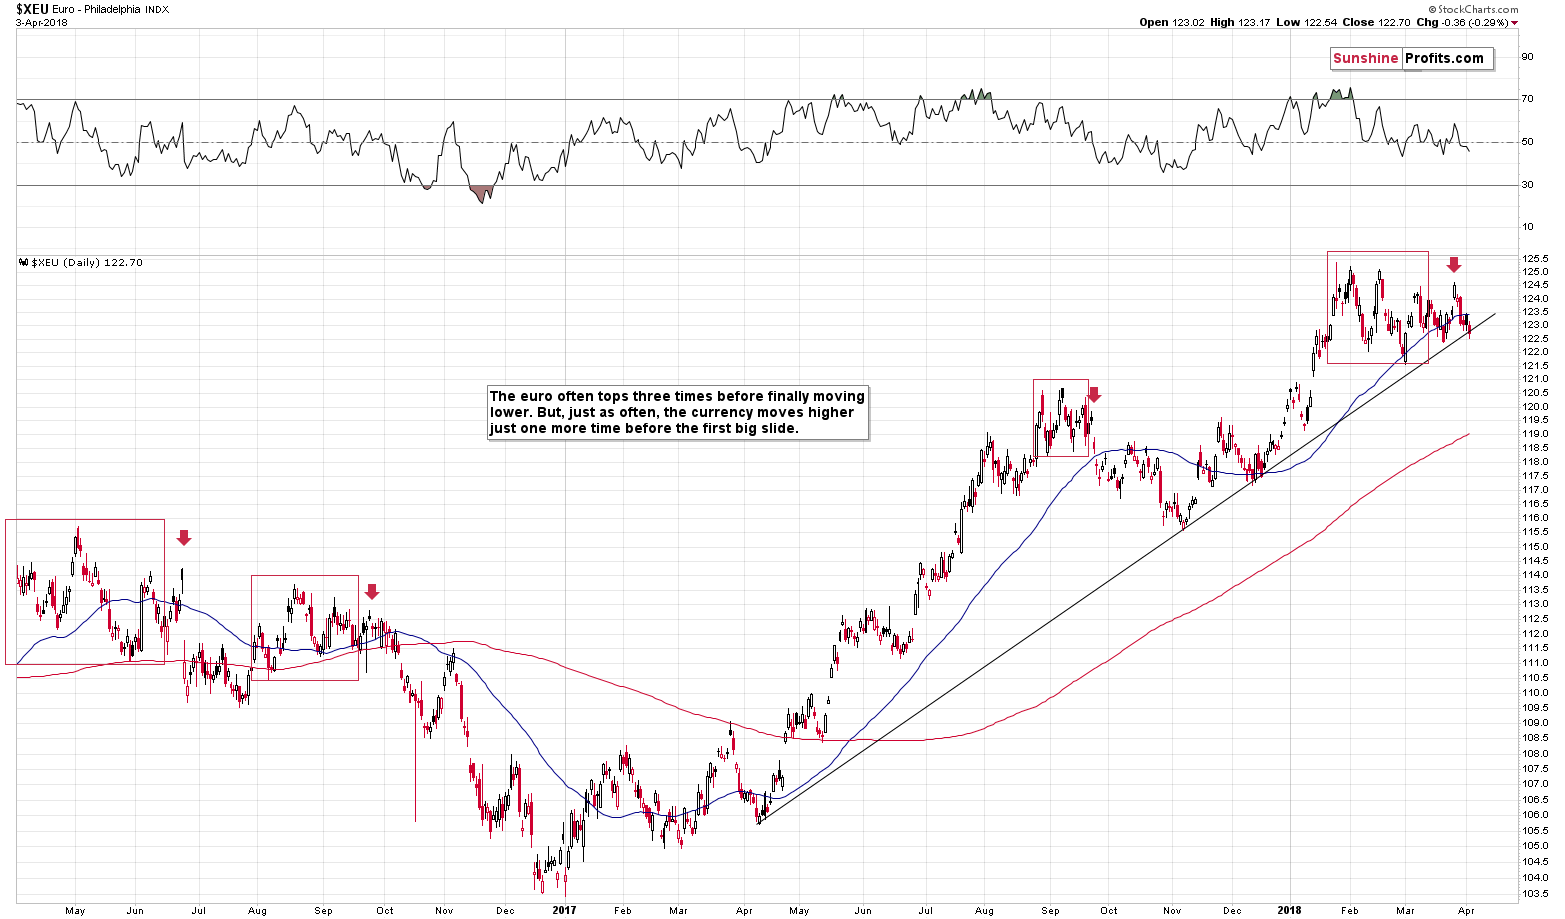
Most likely because the biggest part of the USD Index is the EUR/USD pair and its currently at its medium-term support line. This support is what’s keeping the currency pair in check, which in turns keeps the USD Index in check. But, i.a. based on the triple-top formation it seems that we’ll see a big breakdown in the euro relatively soon. The implications are bullish for the USD Index and bearish for the precious metals sector.
Quiet Sign from the GDX
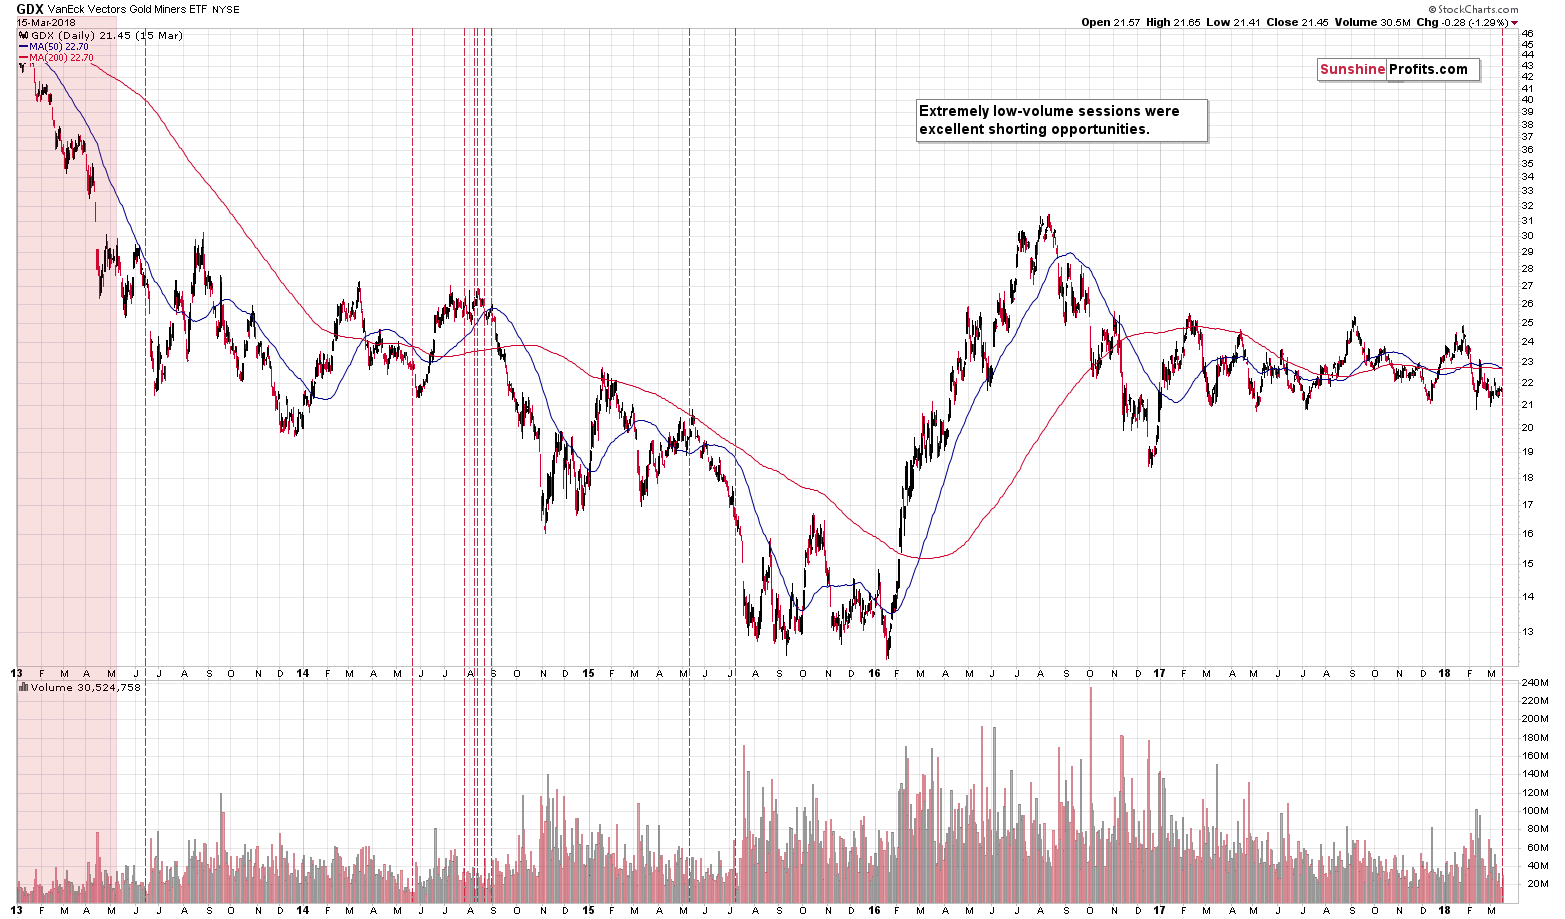
We already discussed the implications of the extremely low volume that we saw in the GDX on March 14th, but it seems that it’s worth to remind about it. After all, it remains in play and the efficiency of this signal in the past was truly extraordinary. The above link will provide you with details, but the long story short version is that practically all similar cases – which we marked with red lines and red area – were excellent shorting opportunities. This factor continues to support our current short position.
So, What’s to Come?
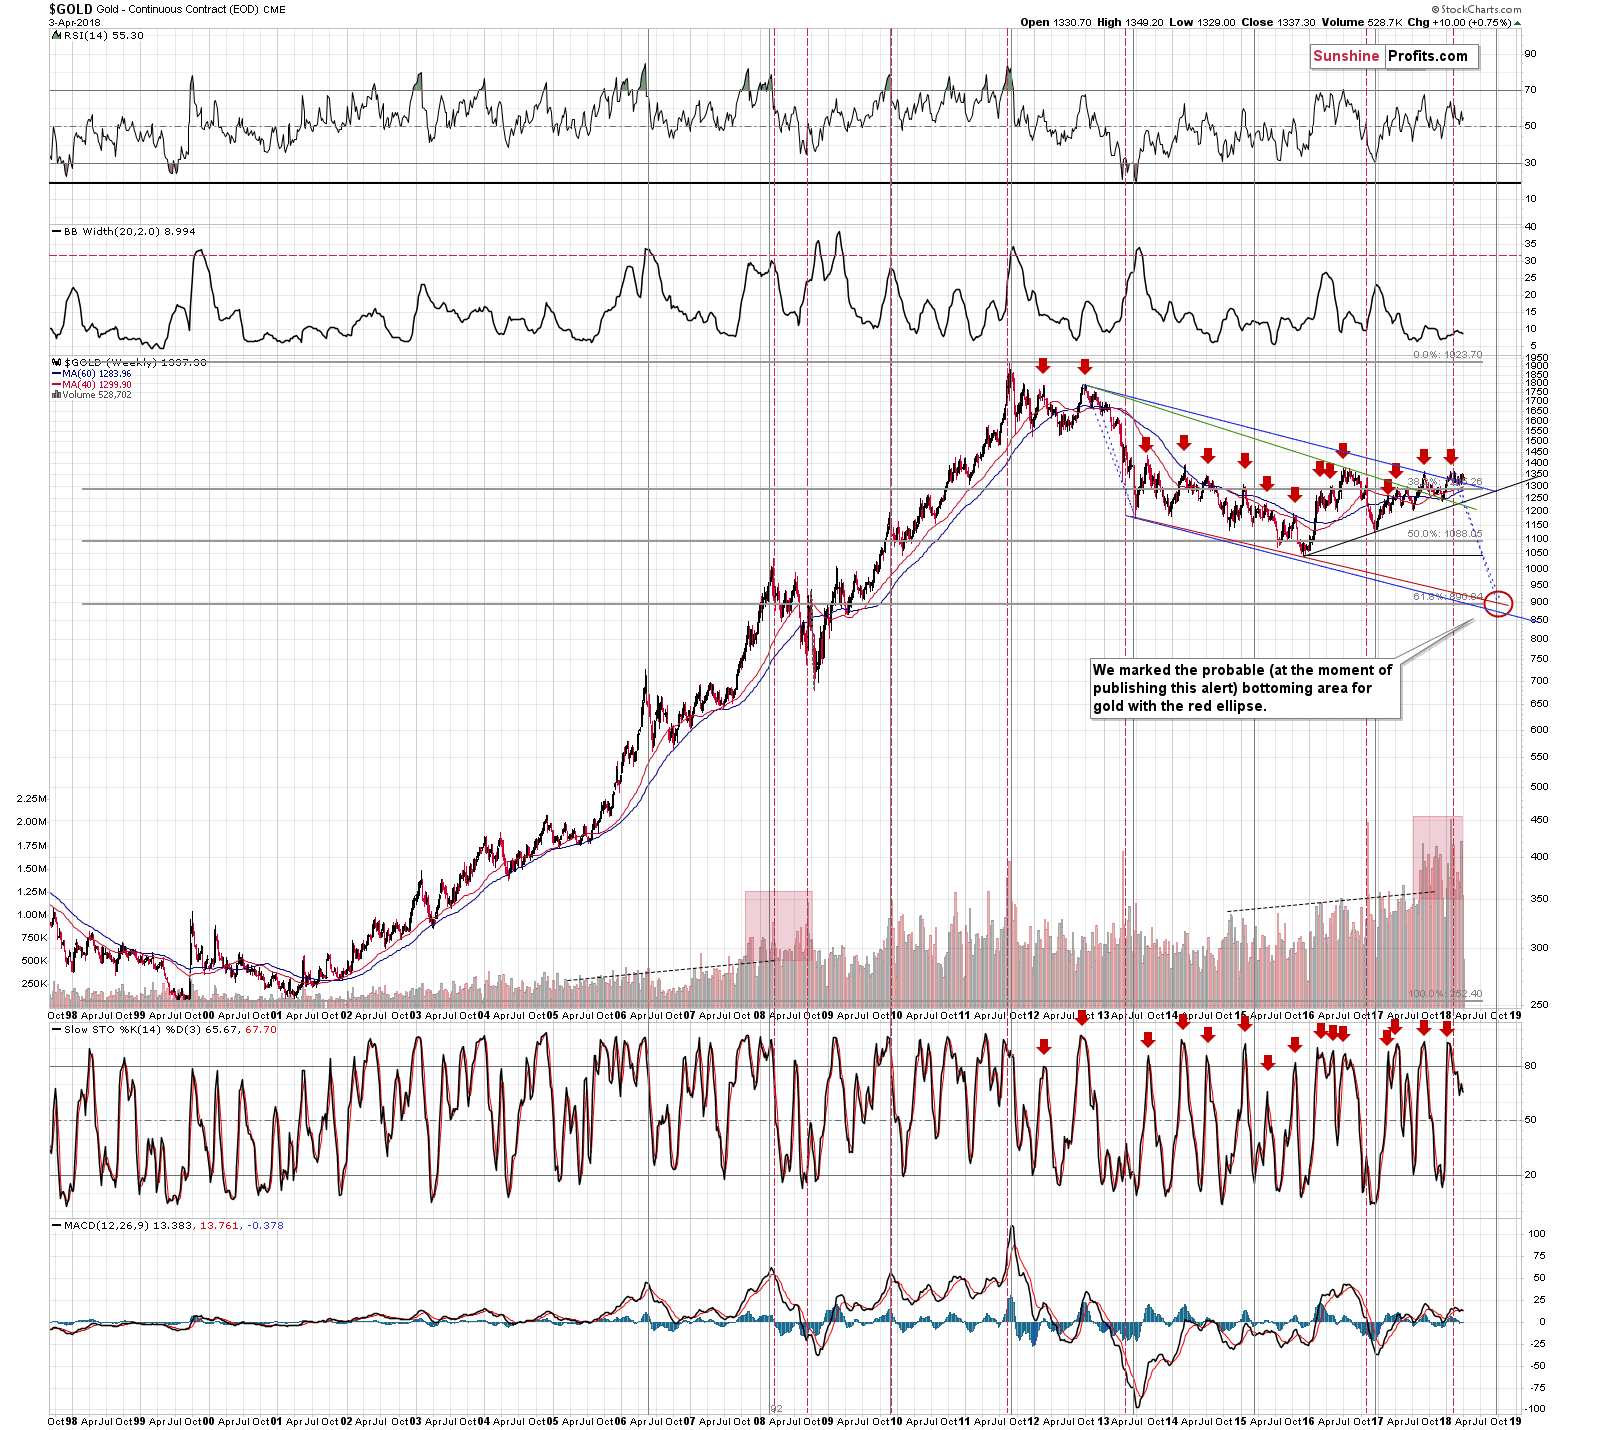
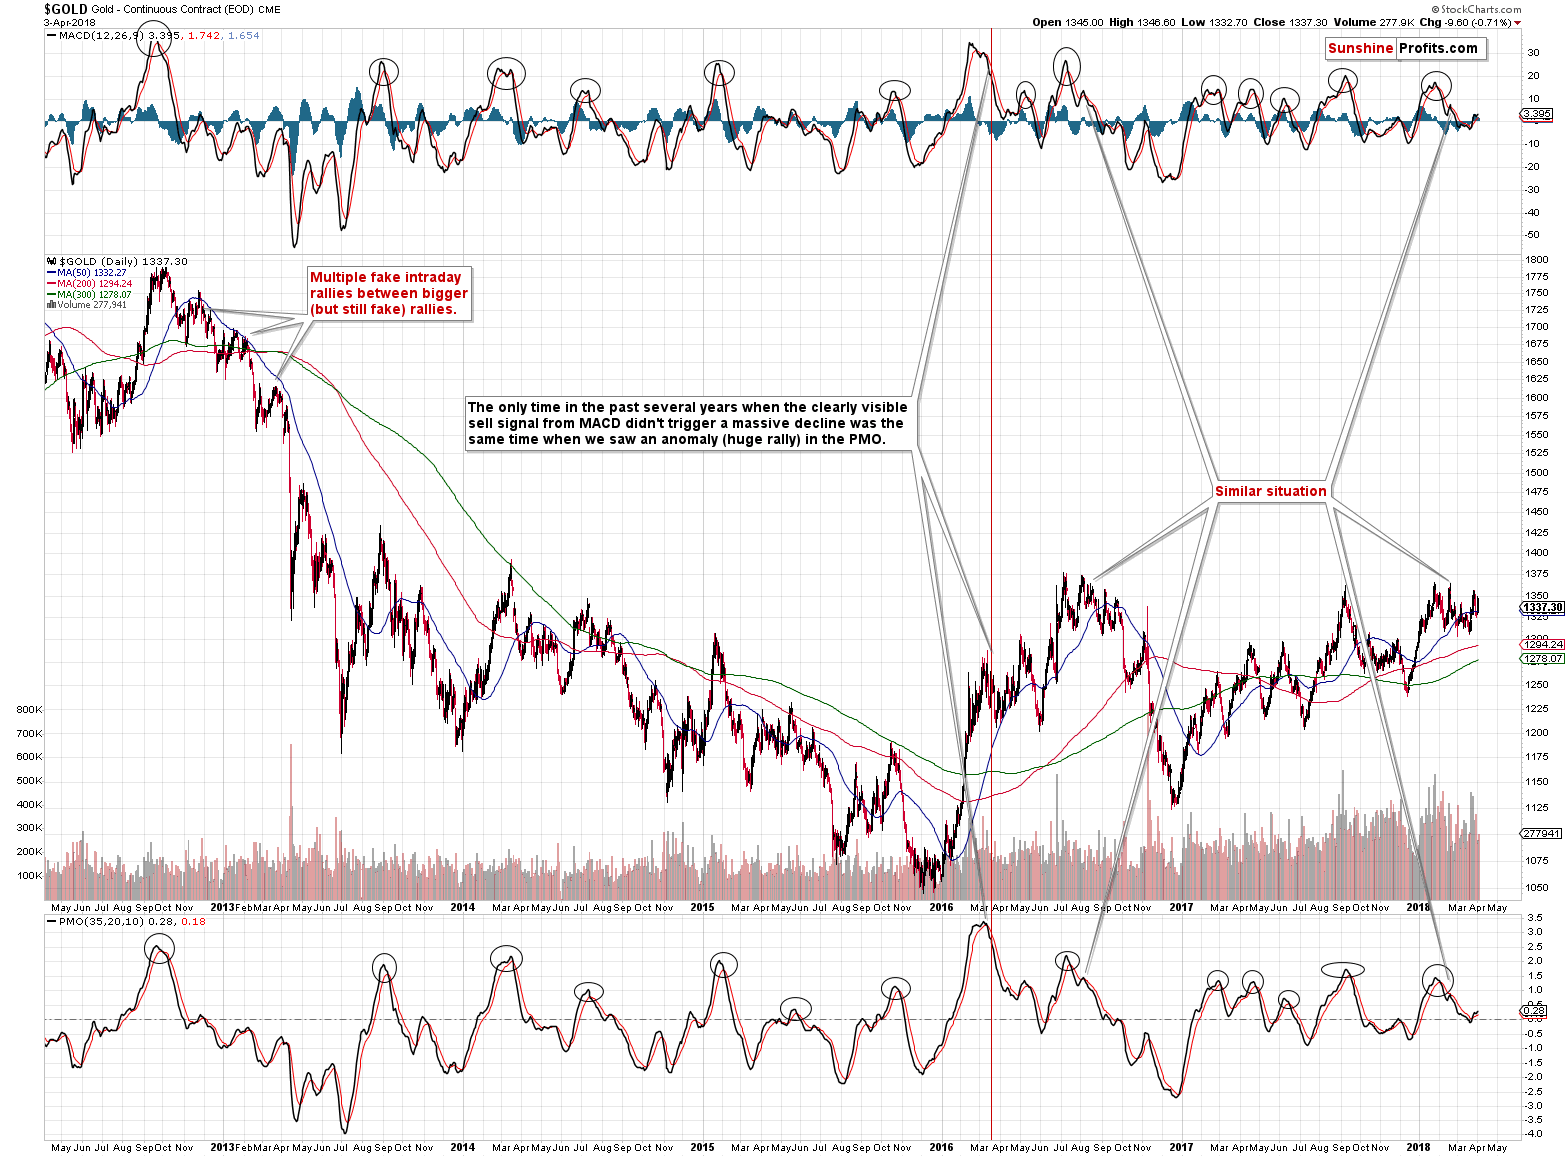
We featured this chart multiple times, so you probably know it very well. The thing that we would like to elaborate on is the shape of the decline that is likely already underway. The repeat of the 2012 – 2013 decline is likely because it fits other techniques pointing to the final bottom in September 2018 or October 2018.
The question that we asked ourselves today was – ok, so if gold is going to decline more or less how it declined about 5 years ago, then what else can we infer from this information? After all, we can’t expect gold’s decline to be a to-the-letter copy of what happened previously.
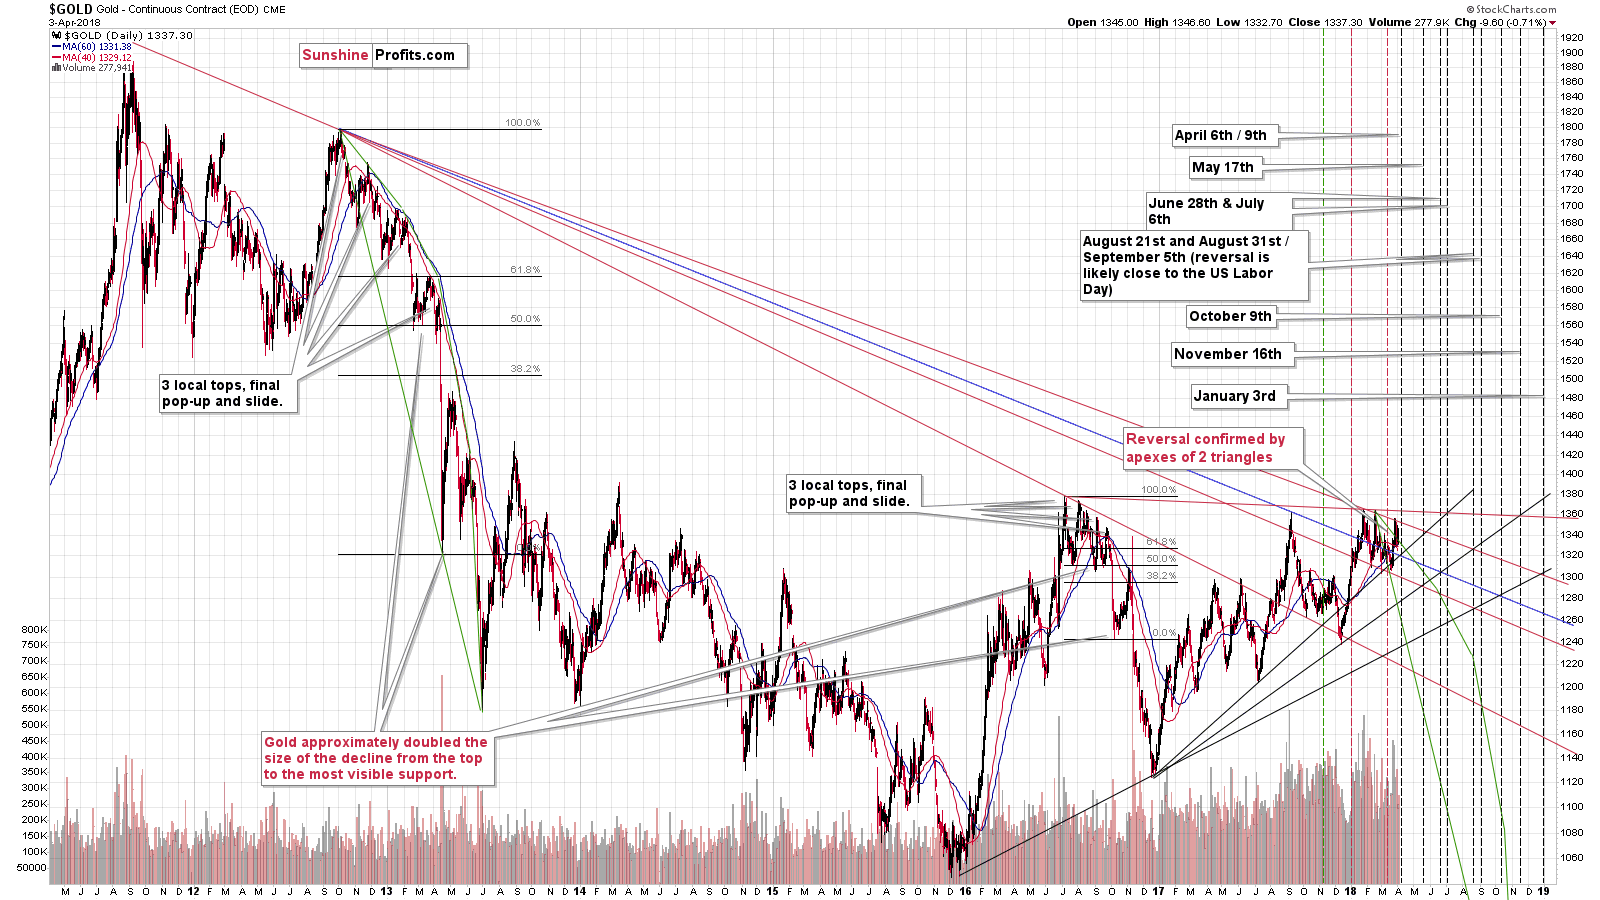
As a reply to the above question, we marked the characteristic moves in 2012 and 2013 with green (it took form of a bow) and we copied them to the current situation. The first implication is that gold should more or less move within the green bow. At this time gold is a bit above it, but the above is just a guideline, not a rule, so it’s not that the analogy was invalidated. The above suggests that, however, that gold has to decline rather sooner than later because it shouldn’t deviate too much from the previous pattern. That would invalidate the analogy and it seems unlikely – after all, history tends to rhyme. So, if the green bow pattern is to continue, then it shouldn’t take gold another several months to start the decline. A few extra weeks would still be ok if the following decline was really sharp and sizable.
The biggest implication that we have is that gold shouldn’t decline visibly below the lowest line. There was only one time that gold touched it in 2013 and that was the moment when the biggest and sharpest corrective upswing started. So, if we see something like that and gold looks very oversold, it will be a good sign to temporarily close the short position and perhaps open a long one for several days. At this time the lowest green line is at about $1,260, so if gold declined to it today and we saw some other bearish signs, we would likely close the short position.
In both cases: in 2012 and recently, gold moved initially very in tune with the sharpest green line. We are now likely after a top that’s analogous to the November 2012 high. What followed back then was a move below the previous short-term low, but not to the lowest of green lines. The green line is at about $1,265 (but when the bottom is in, it could already be at $1,255 or so) and the previous low is a few dollars above $1,300. The price level that would fit the above-mentioned analogy is $1,270 - $1,280, which is exactly where we have our target area on the short-term gold chart. The above is therefore confirmed by yet another technique.
Summary
Summing up, the next reversal date is looming, and it seems that we’ll either see a decline shortly or that we’ll see more back-and-forth movement and a decline on April 9 or close to this date. The former is more likely at the moment, but either way, it seems that the 2018 consolidation (which will likely prove to be a triple top) is likely very close to being over. The Euro Index is on a verge of breaking lower, which is likely to push USD higher and trigger a slide in the PMs.
As always, we will keep you – our subscribers – informed.
To summarize:
Trading capital (supplementary part of the portfolio; our opinion): Full short positions (200% of the full position) in gold, silver and mining stocks are justified from the risk/reward perspective with the following stop-loss orders and initial target price levels:
- Gold: initial target price: $1,218; stop-loss: $1,382; initial target price for the DGLD ETN: $53.98; stop-loss for the DGLD ETN $37.68
- Silver: initial target price: $14.63; stop-loss: $17.33; initial target price for the DSLV ETN: $33.88; stop-loss for the DSLV ETN $21.48
- Mining stocks (price levels for the GDX ETF): initial target price: $19.22; stop-loss: $23.54; initial target price for the DUST ETF: $39.88; stop-loss for the DUST ETF $21.46
In case one wants to bet on junior mining stocks' prices (we do not suggest doing so – we think senior mining stocks are more predictable in the case of short-term trades – if one wants to do it anyway, we provide the details), here are the stop-loss details and initial target prices:
- GDXJ ETF: initial target price: $27.82; stop-loss: $36.14
- JDST ETF: initial target price: $94.88 stop-loss: $41.86
Long-term capital (core part of the portfolio; our opinion): No positions (in other words: cash)
Insurance capital (core part of the portfolio; our opinion): Full position
Important Details for New Subscribers
Whether you already subscribed or not, we encourage you to find out how to make the most of our alerts and read our replies to the most common alert-and-gold-trading-related-questions.
Please note that the in the trading section we describe the situation for the day that the alert is posted. In other words, it we are writing about a speculative position, it means that it is up-to-date on the day it was posted. We are also featuring the initial target prices, so that you can decide whether keeping a position on a given day is something that is in tune with your approach (some moves are too small for medium-term traders and some might appear too big for day-traders).
Plus, you might want to read why our stop-loss orders are usually relatively far from the current price.
Please note that a full position doesn’t mean using all of the capital for a given trade. You will find details on our thoughts on gold portfolio structuring in the Key Insights section on our website.
As a reminder – “initial target price” means exactly that – an “initial” one, it’s not a price level at which we suggest closing positions. If this becomes the case (like it did in the previous trade) we will refer to these levels as levels of exit orders (exactly as we’ve done previously). Stop-loss levels, however, are naturally not “initial”, but something that, in our opinion, might be entered as an order.
Since it is impossible to synchronize target prices and stop-loss levels for all the ETFs and ETNs with the main markets that we provide these levels for (gold, silver and mining stocks – the GDX ETF), the stop-loss levels and target prices for other ETNs and ETF (among other: UGLD, DGLD, USLV, DSLV, NUGT, DUST, JNUG, JDST) are provided as supplementary, and not as “final”. This means that if a stop-loss or a target level is reached for any of the “additional instruments” (DGLD for instance), but not for the “main instrument” (gold in this case), we will view positions in both gold and DGLD as still open and the stop-loss for DGLD would have to be moved lower. On the other hand, if gold moves to a stop-loss level but DGLD doesn’t, then we will view both positions (in gold and DGLD) as closed. In other words, since it’s not possible to be 100% certain that each related instrument moves to a given level when the underlying instrument does, we can’t provide levels that would be binding. The levels that we do provide are our best estimate of the levels that will correspond to the levels in the underlying assets, but it will be the underlying assets that one will need to focus on regarding the signs pointing to closing a given position or keeping it open. We might adjust the levels in the “additional instruments” without adjusting the levels in the “main instruments”, which will simply mean that we have improved our estimation of these levels, not that we changed our outlook on the markets. We are already working on a tool that would update these levels on a daily basis for the most popular ETFs, ETNs and individual mining stocks.
Our preferred ways to invest in and to trade gold along with the reasoning can be found in the how to buy gold section. Additionally, our preferred ETFs and ETNs can be found in our Gold & Silver ETF Ranking.
As a reminder, Gold & Silver Trading Alerts are posted before or on each trading day (we usually post them before the opening bell, but we don't promise doing that each day). If there's anything urgent, we will send you an additional small alert before posting the main one.
=====
Latest Free Trading Alerts:
John Maynard Keynes once famously called gold the “barbarous relic”. The emergence of the cryptocurrencies seems to validate that thesis. Will gold survive in the digital era?
Is Bitcoin Substitute for Gold?
=====
Hand-picked precious-metals-related links:
PRECIOUS-Gold gains as dollar dips, U.S.-China trade tensions escalate
CME Group Lists Record Metals-Trading Volume For First Quarter
BlackRock's $1.3 Billion Gold Fund Feels Pain of Miners
Eldorado Gold Bounces Back After Hitting Cheapest Level Since 1998
=====
In other news:
Specter of Full Trade War Returns to Batter Stocks: Markets Wrap
China retaliates to Trump tariffs with new levies on US products
European Central Bank Can’t Just Copy the Fed
=====
Thank you.
Sincerely,
Przemyslaw Radomski, CFA
Founder, Editor-in-chief, Gold & Silver Fund Manager
Gold & Silver Trading Alerts
Forex Trading Alerts
Oil Investment Updates
Oil Trading Alerts

