

Briefly: In our opinion, full (200% of the regular size of the position) speculative short positions in gold, silver and mining stocks are justified from the risk/reward perspective at the moment of publishing this alert.
In yesterday’s alert, we provided a big and in-depth analysis of the current situation in the precious metals market and we concluded that a major and sharp move lower had just begun. Yesterday’s session was not like that at all. Instead of diving, gold and mining stocks did nothing, while silver moved higher. Did the bearish picture just get invalidated?
Absolutely not. The daily pause was very far from being an invalidation of our yesterday’s comments. In fact, we wrote about the possibility of seeing a very brief move higher, based on gold’s support line. It was not likely to be anything significant – and it wasn’t.
Yesterday’s session was actually a blessing, because it allowed everyone to double the size of the short position at good prices. If we had had a $1 decline in silver and a $30 slide in gold, it would have been more difficult to do so, and definitely less profitable.
Naturally, if yesterday’s price action (and lack thereof) had changed anything regarding the technical outlook, it could have changed the risk to reward ratio – but it didn’t. Let’s take a closer look at the charts.
Breakout and Breakdown - Confirmations
In yesterday’s alert, we emphasized how the outlook for the USD and its implications for the PMs changed:
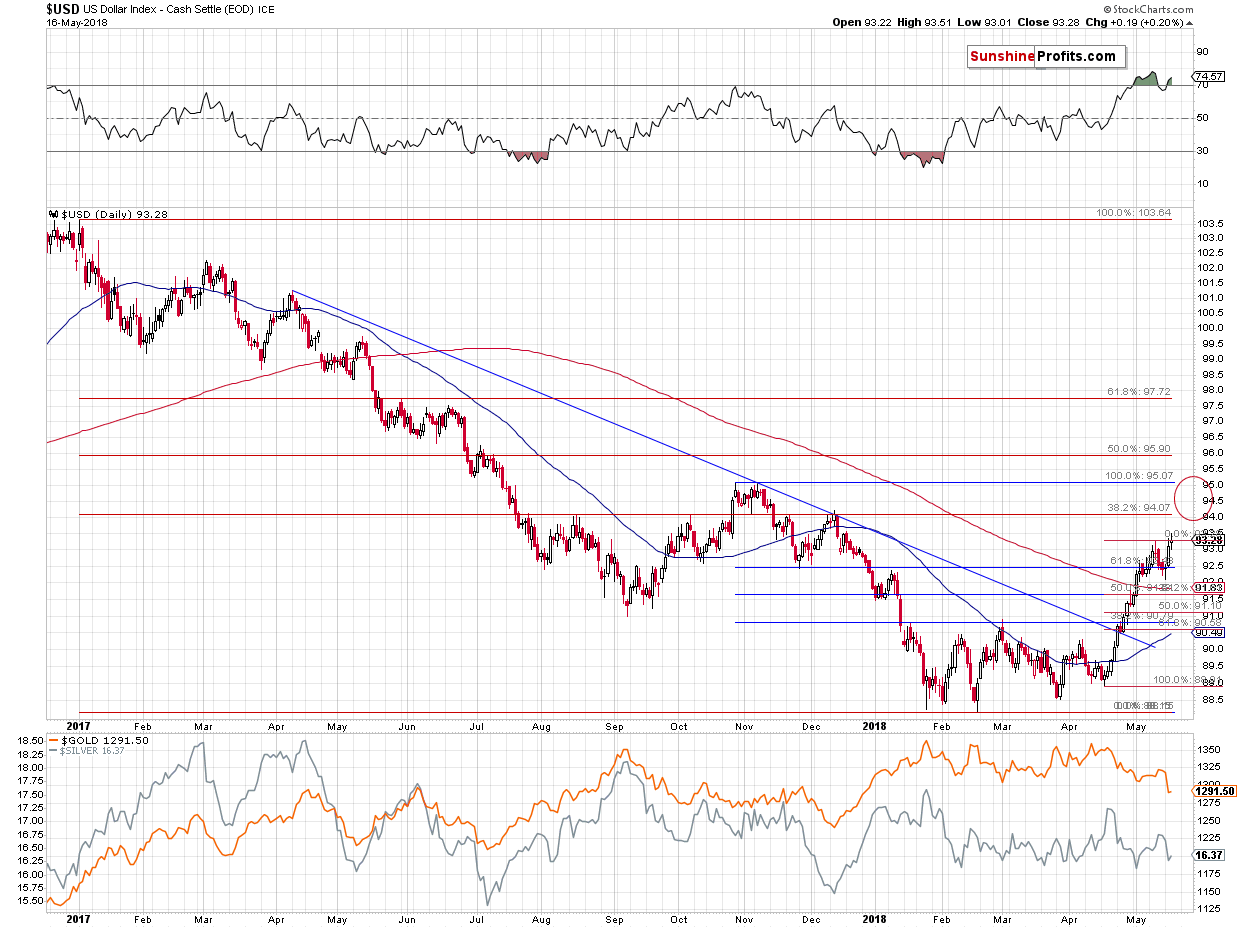
The situation in the USD Index was the only thing that had bullish implications for the PMs and based on what happened yesterday, the implications are now bearish. The USDX moved to new 2018 highs in terms of both intraday and closing prices. This invalidates the previous theory according to which there will be another short-term downswing after a few days of pause. Based on the breakout, this is no longer likely. Instead, the USD is now likely to move to the next resistance or even higher (in fact, our short positions in EUR/USD are already profitable). The next two target prices are at about 94 and 95. The former is provided by the December 2017 top and the latter is based on the October / November top. The 94 level seems more important as its strengthened by the August and early October tops and the 38.2% Fibonacci retracement level.
The above remains up-to-date and the thing that we would like to emphasize is that during yesterday’s trading, the USD didn’t move back below the previous May high. Instead, it closed a bit higher. This means that the breakout is being confirmed and that the mentioned bearish implications for PMs are getting more bearish.
The second major short-term development that we discussed yesterday, was the breakdown in the GDX ETF.
We wrote the following:
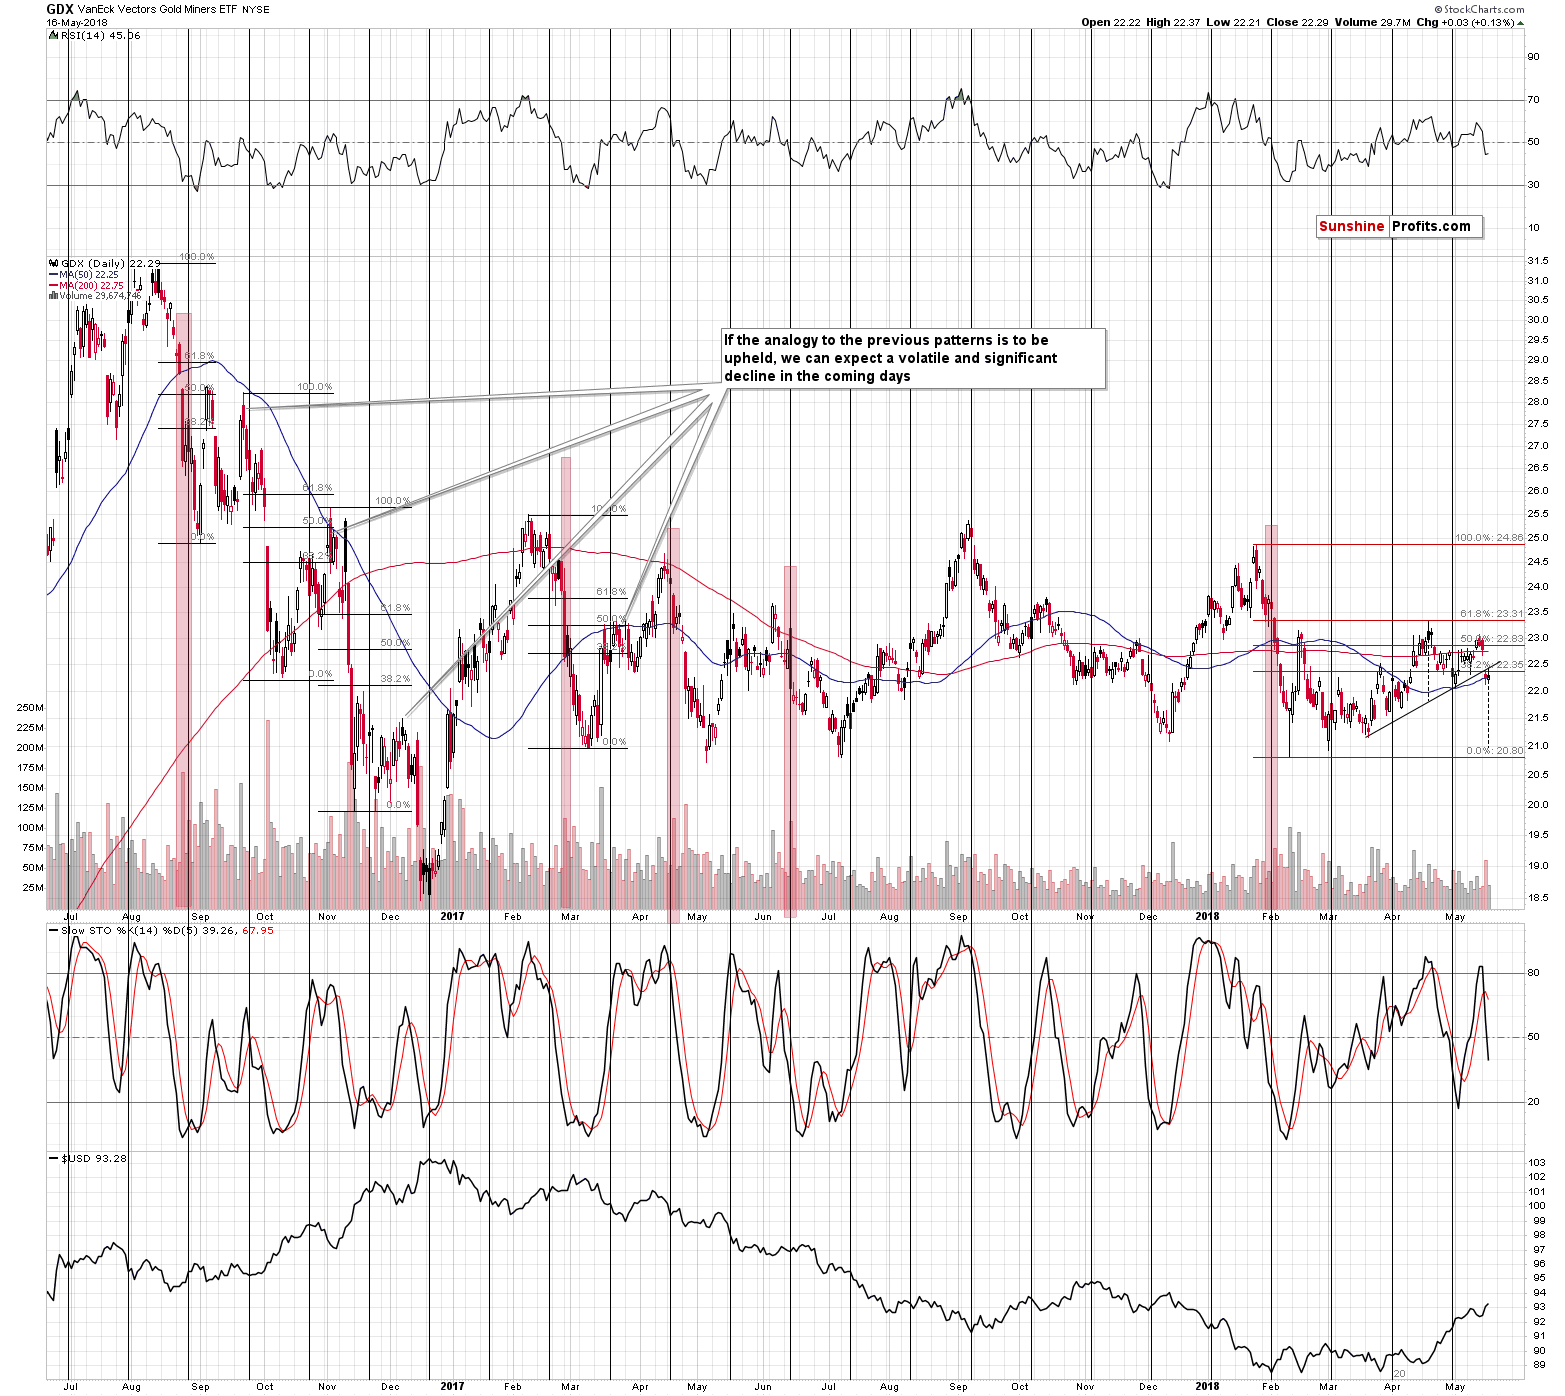
The breakdown is clear and it took place on huge volume. While its usually best to wait for two additional closes below a certain price level, based on the size of the volume, we can say that the breakdown was already verified in a way.
Moreover, yesterday’s decline created and completed a bearish head-and-shoulders pattern. The minimum target based on this formation can be obtained by applying the size of the head to the price of the breakdown. We marked both with dashed lines and based on this technique it seems that the GDX is about to decline to the previous 2018 lows. At about $21.
However, there are two factors that suggest that miners will decline much more. The less important is the analogy to the late-2016 declines. The double / triple (when counting this month’s upswing) move back to the 50% - 61.8% Fibonacci retracement levels makes the entire 2018 performance similar to the short-term downswings that we saw in late 2016. If the similarity is to continue, then the first big sharp move lower is just a start of something much bigger.
It’s best if a given breakdown is confirmed by two additional closes and we saw the first of them yesterday. GDX moved back to the neck of previously completed head-and-shoulders pattern and then it declined. That’s a textbook example of the pattern’s verification. The volume during this daily pause was nothing special – about half of what we saw during Tuesday’s decline. This further confirms the bearish outlook as it’s what is common during post-breakdown pauses and verifications.
Gold Remains at Support
As far as gold is concerned, we wrote the following:
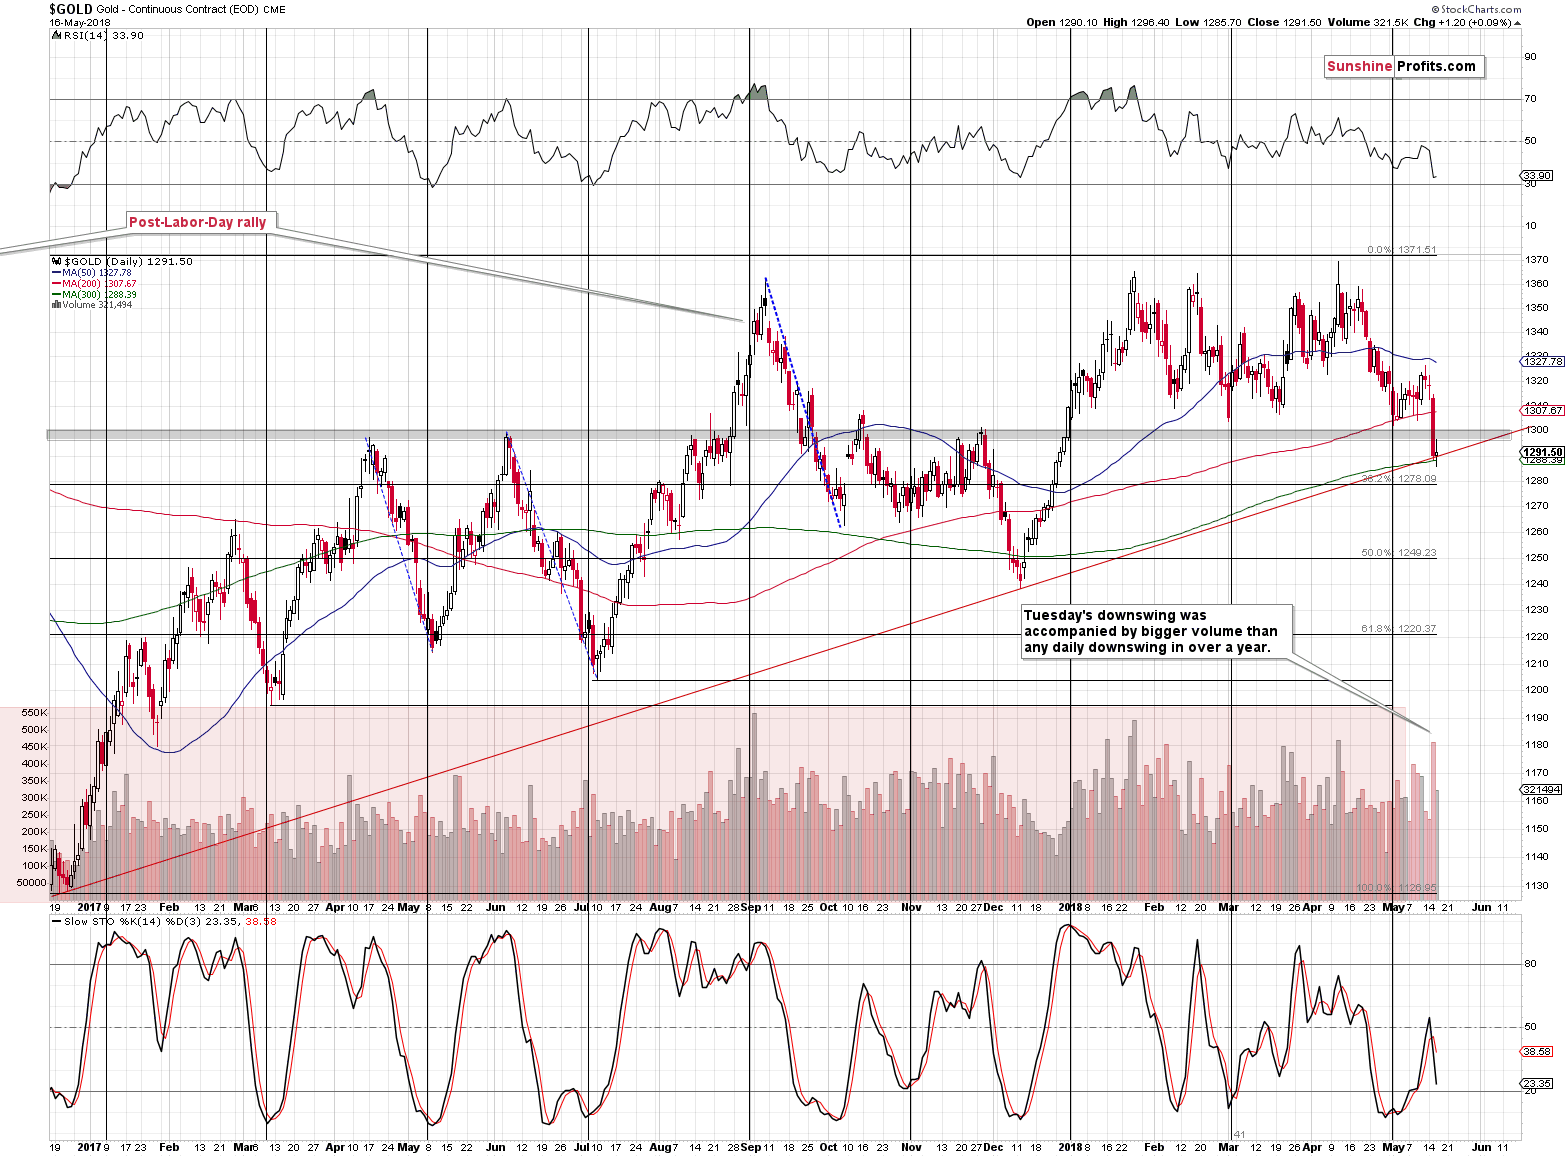
What’s significant about gold is that the decline took place on enormous volume – the last time we saw a daily decline on volume that was even bigger, was in November 2016. That was the beginning of a powerful and sharp decline. To be clear, there were also cases when similarly big volume was followed by a brief pause – for instance the September 21, 2017 decline. The bigger decline continued after a few days nonetheless.
The bullish factor here is the rising, long-term support line based on the December 2016 and December 2017 bottoms. It was just reached yesterday, which means that gold could show some temporary strength.
While we may get a very short-term bounce here, based on multiple factors that we discussed above, it seems that waiting for it before adding to the short position is not worth it. Gold could get several dollars higher, but it might (which seems more likely) also decline a few tens of dollars and even if it does move higher today or tomorrow, it’s very likely to turn south shortly anyway.
The above remains up-to-date. Gold moved a bit higher, ending the session about $1 above Tuesday’s close. That was a rather weak bounce that was accompanied by volume that was not very low, but it was not huge either. The latter would be required for one to view gold’s session as an important reversal. The volume was rather normal, which suggests that gold is simply taking a breather after a volatile downswing.
The outlook remains bearish.
Bigger Bounce in Silver
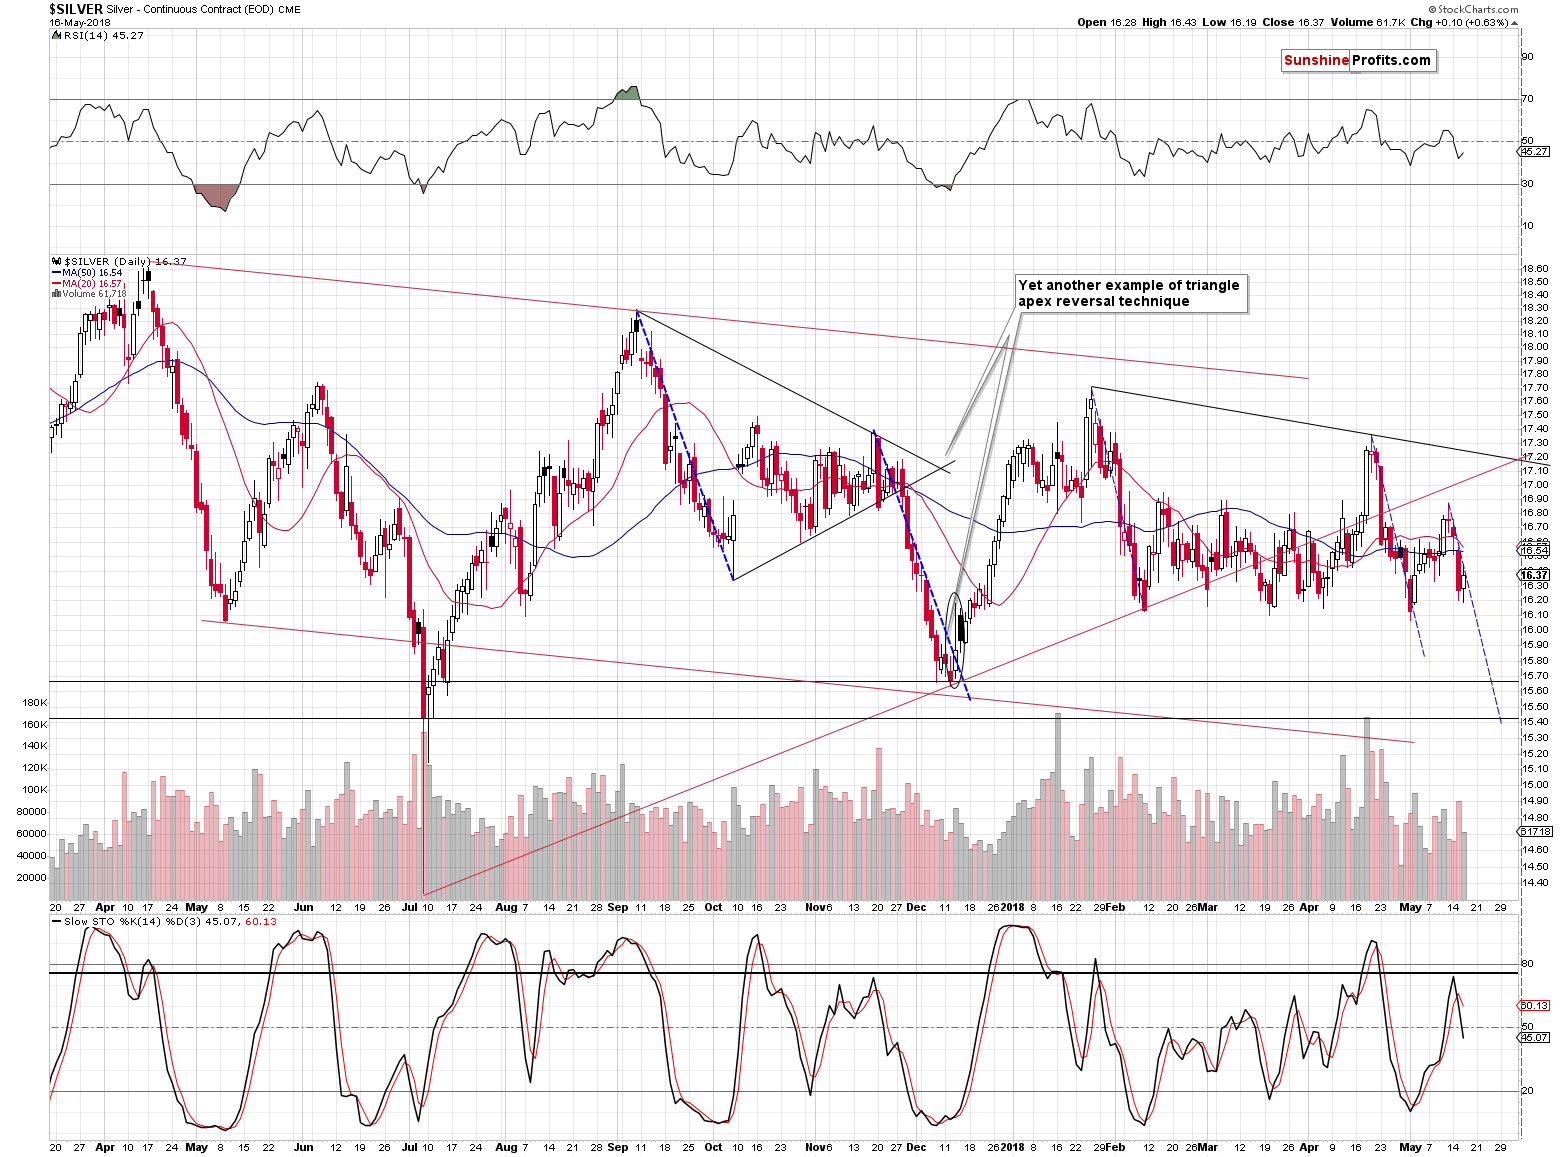
From the gold, silver and miners trio, only the white metal showed more visible strength. It doesn’t mean that silver moved higher in a meaningful way – it was simply noticeable, while the moves in miners and gold were practically nonexistent.
Silver’s move has bearish implications as well because it’s both: small enough no to change anything on its own and it’s big enough for one to say that we saw silver’s short-term outperformance. The latter is a sell sign.
The move higher was not big enough to change anything on its own, because silver’s Tuesday daily decline was quite sizable and thus some kind of bounce is rather natural. Based on the fact that gold reached an important support and silver didn’t, one might have expected the yellow metal to bounce in a more meaningful way. It was the other way around and since white metal’s outperformance is a sell sign, it’s hard to imagine a more bearish combination that at the same time would allow one to easily add to their short positions.
Yesterday’s session truly seems like a blessing.
Summary
Summing up, based on the apex-based reversals, True Seasonal patterns for gold, silver and mining stocks, USDX’s breakout, GDX’s breakdown and silver’s yesterday’s outperformance, it seems that the local top is already in and that we can expect a sharp decline in the coming days and weeks.
Based on the nearby apex-based reversals in gold and silver, we might expect a turnaround next week on Wednesday or Thursday.
As always, we will keep you – our subscribers – informed.
To summarize:
Trading capital (supplementary part of the portfolio; our opinion): Full short positions (200% of the full position) in gold, silver and mining stocks are justified from the risk/reward perspective with the following stop-loss orders and initial target price levels:
- Gold: initial target price: $1,218; stop-loss: $1,382; initial target price for the DGLD ETN: $52.98; stop-loss for the DGLD ETN $37.48
- Silver: initial target price: $14.63; stop-loss: $18.06; initial target price for the DSLV ETN: $33.48; stop-loss for the DSLV ETN $19.17
- Mining stocks (price levels for the GDX ETF): initial target price: $19.22; stop-loss: $23.54; initial target price for the DUST ETF: $39.48; stop-loss for the DUST ETF $21.16
In case one wants to bet on junior mining stocks' prices (we do not suggest doing so – we think senior mining stocks are more predictable in the case of short-term trades – if one wants to do it anyway, we provide the details), here are the stop-loss details and initial target prices:
- GDXJ ETF: initial target price: $27.82; stop-loss: $36.14
- JDST ETF: initial target price: $92.88 stop-loss: $40.86
Long-term capital (core part of the portfolio; our opinion): No positions (in other words: cash)
Insurance capital (core part of the portfolio; our opinion): Full position
Important Details for New Subscribers
Whether you already subscribed or not, we encourage you to find out how to make the most of our alerts and read our replies to the most common alert-and-gold-trading-related-questions.
Please note that the in the trading section we describe the situation for the day that the alert is posted. In other words, it we are writing about a speculative position, it means that it is up-to-date on the day it was posted. We are also featuring the initial target prices, so that you can decide whether keeping a position on a given day is something that is in tune with your approach (some moves are too small for medium-term traders and some might appear too big for day-traders).
Plus, you might want to read why our stop-loss orders are usually relatively far from the current price.
Please note that a full position doesn’t mean using all of the capital for a given trade. You will find details on our thoughts on gold portfolio structuring in the Key Insights section on our website.
As a reminder – “initial target price” means exactly that – an “initial” one, it’s not a price level at which we suggest closing positions. If this becomes the case (like it did in the previous trade) we will refer to these levels as levels of exit orders (exactly as we’ve done previously). Stop-loss levels, however, are naturally not “initial”, but something that, in our opinion, might be entered as an order.
Since it is impossible to synchronize target prices and stop-loss levels for all the ETFs and ETNs with the main markets that we provide these levels for (gold, silver and mining stocks – the GDX ETF), the stop-loss levels and target prices for other ETNs and ETF (among other: UGLD, DGLD, USLV, DSLV, NUGT, DUST, JNUG, JDST) are provided as supplementary, and not as “final”. This means that if a stop-loss or a target level is reached for any of the “additional instruments” (DGLD for instance), but not for the “main instrument” (gold in this case), we will view positions in both gold and DGLD as still open and the stop-loss for DGLD would have to be moved lower. On the other hand, if gold moves to a stop-loss level but DGLD doesn’t, then we will view both positions (in gold and DGLD) as closed. In other words, since it’s not possible to be 100% certain that each related instrument moves to a given level when the underlying instrument does, we can’t provide levels that would be binding. The levels that we do provide are our best estimate of the levels that will correspond to the levels in the underlying assets, but it will be the underlying assets that one will need to focus on regarding the signs pointing to closing a given position or keeping it open. We might adjust the levels in the “additional instruments” without adjusting the levels in the “main instruments”, which will simply mean that we have improved our estimation of these levels, not that we changed our outlook on the markets. We are already working on a tool that would update these levels on a daily basis for the most popular ETFs, ETNs and individual mining stocks.
Our preferred ways to invest in and to trade gold along with the reasoning can be found in the how to buy gold section. Additionally, our preferred ETFs and ETNs can be found in our Gold & Silver ETF Ranking.
As a reminder, Gold & Silver Trading Alerts are posted before or on each trading day (we usually post them before the opening bell, but we don't promise doing that each day). If there's anything urgent, we will send you an additional small alert before posting the main one.
=====
Latest Free Trading Alerts:
Although gold gained in the first tertile of 2018, the balance of fundamental risks for gold has turned to the downside. Why? We invite you to read our today’s article about the gold market in the first four months of the year and find out which way the answer to this question.
Gold Market in First Tertile of 2018
Tuesday's move down was reversed yesterday, as investors were buying stocks despite recent bond yield rise worries. But will this short-term uptrend continue today? There are still two possible medium-term scenarios.
Sell-Off and Then Bounce, Topping Pattern or Just Correction?
=====
Hand-picked precious-metals-related links:
PRECIOUS-Gold dips as dollar holds near 2018 peak
Yamana begins gold and silver production at Cerro Moro mine in Argentina
=====
In other news:
Euro slips on Italian political risk and U.S. bond yield rise
When Market Pessimism Becomes a Self-Fulfilling Prophecy
Fitch Says Emerging Markets Vulnerable as Debt Hits $19 Trillion
May says Britain will leave customs union, EU warns on Irish border again
Oil Rises to $80 a Barrel in London for First Time Since 2014
=====
Thank you.
Sincerely,
Przemyslaw Radomski, CFA
Founder, Editor-in-chief, Gold & Silver Fund Manager
Gold & Silver Trading Alerts
Forex Trading Alerts
Oil Investment Updates
Oil Trading Alerts

