

Briefly: In our opinion, full (150% of the regular full position) speculative short positions in gold, silver and mining stocks are justified from the risk/reward perspective at the moment of publishing this alert.
We normally don’t post alerts on days when there is no trading in the U.S., but we thought you might appreciate Monday’s alert earlier. The geopolitical tensions may increase or ease over the weekend and the Japanese yen could have already reached its resistance level (the one that we discussed on Thursday) and start another big wave lower before the US markets open next week. Let’s see what the charts are pointing to and if anything changed based on Thursday’s price swings. Let’s start with silver (charts courtesy of http://stockcharts.com).
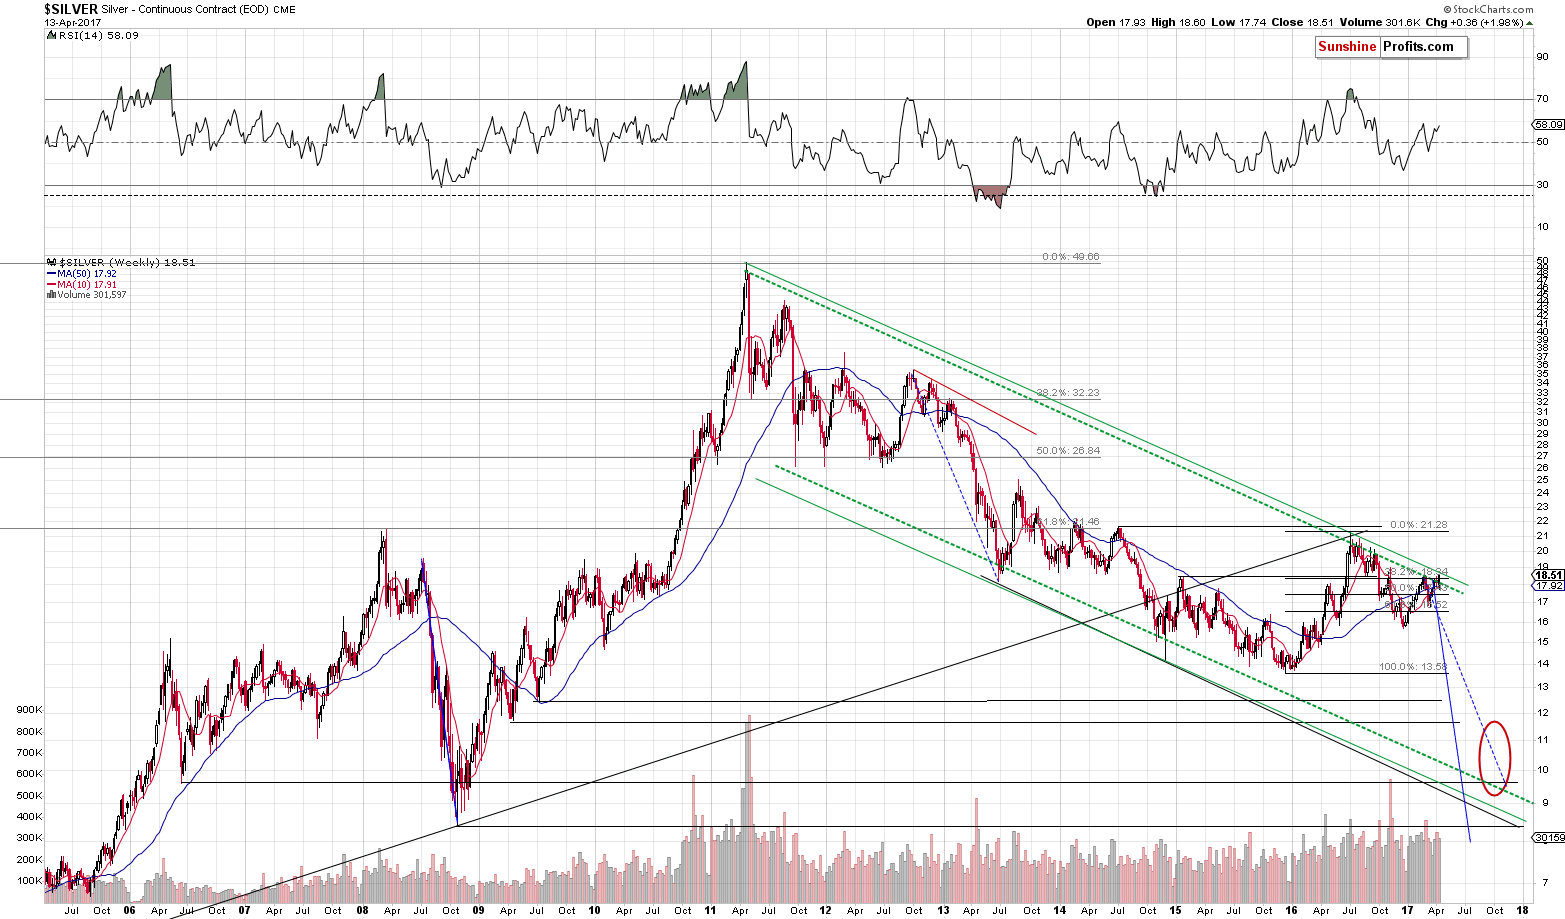
Silver moved and closed the week above the declining long-term resistance line. We previously wrote that this resistance line was very important, so the question is if the breakout changes anything. In our view, this is generally not the case, as the week was not quite representative – there was no trading on Friday. Still, if gold was to move higher (to $1,310 or so), then the above chart provides us with an analogous upside target – the upper, long-term green line (based on the same major tops as the lower line, but drawn through intra-day tops). It’s currently at about $18.70 – just 10 cents above this week’s high. So, the upside is quite limited.
As far as gold’s long-term chart is concerned, nothing really changed based on Thursday’s session:
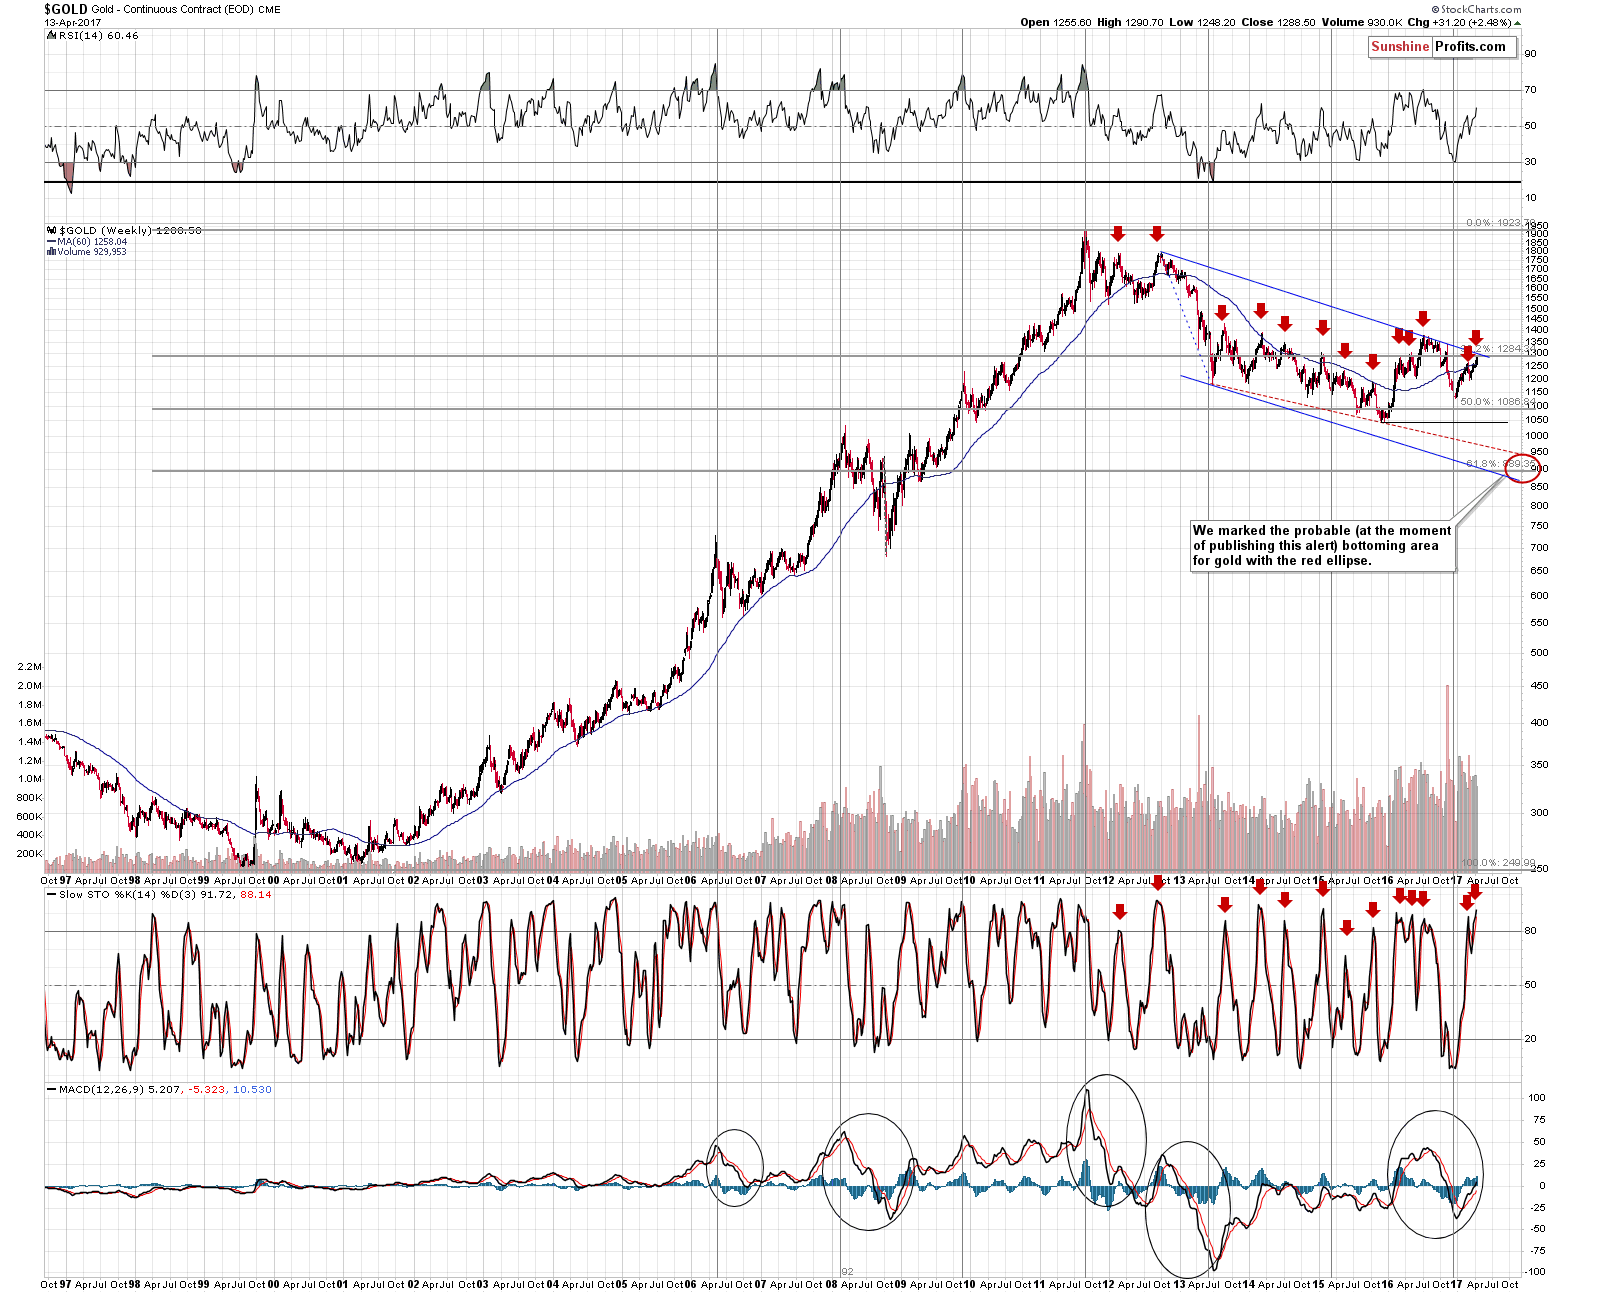
The RSI also suggests that a major (!) turnaround is just around the corner, but as far as the resistance levels and lines are concerned, there are also two important levels that one should keep in mind: the 38.2% Fibonacci retracement and the long-term declining resistance line. The former is at $1,284 (which is yet another reason not to treat yesterday’s / today’s upswing seriously without confirmation) and the latter is either at $1,293 (based on weekly closing prices) or $1,309 (based on intra-day highs).
Let’s keep in mind that the long-term indications are more important than the short-term ones, so the mentioned resistance levels are very significant.
So, the question is, if one prefers to adjust the position based on the possibility (! – not big probability) of a $20 move higher in light of multiple signs pointing to lower prices in the coming weeks regardless of whether gold reverses right away or higher.
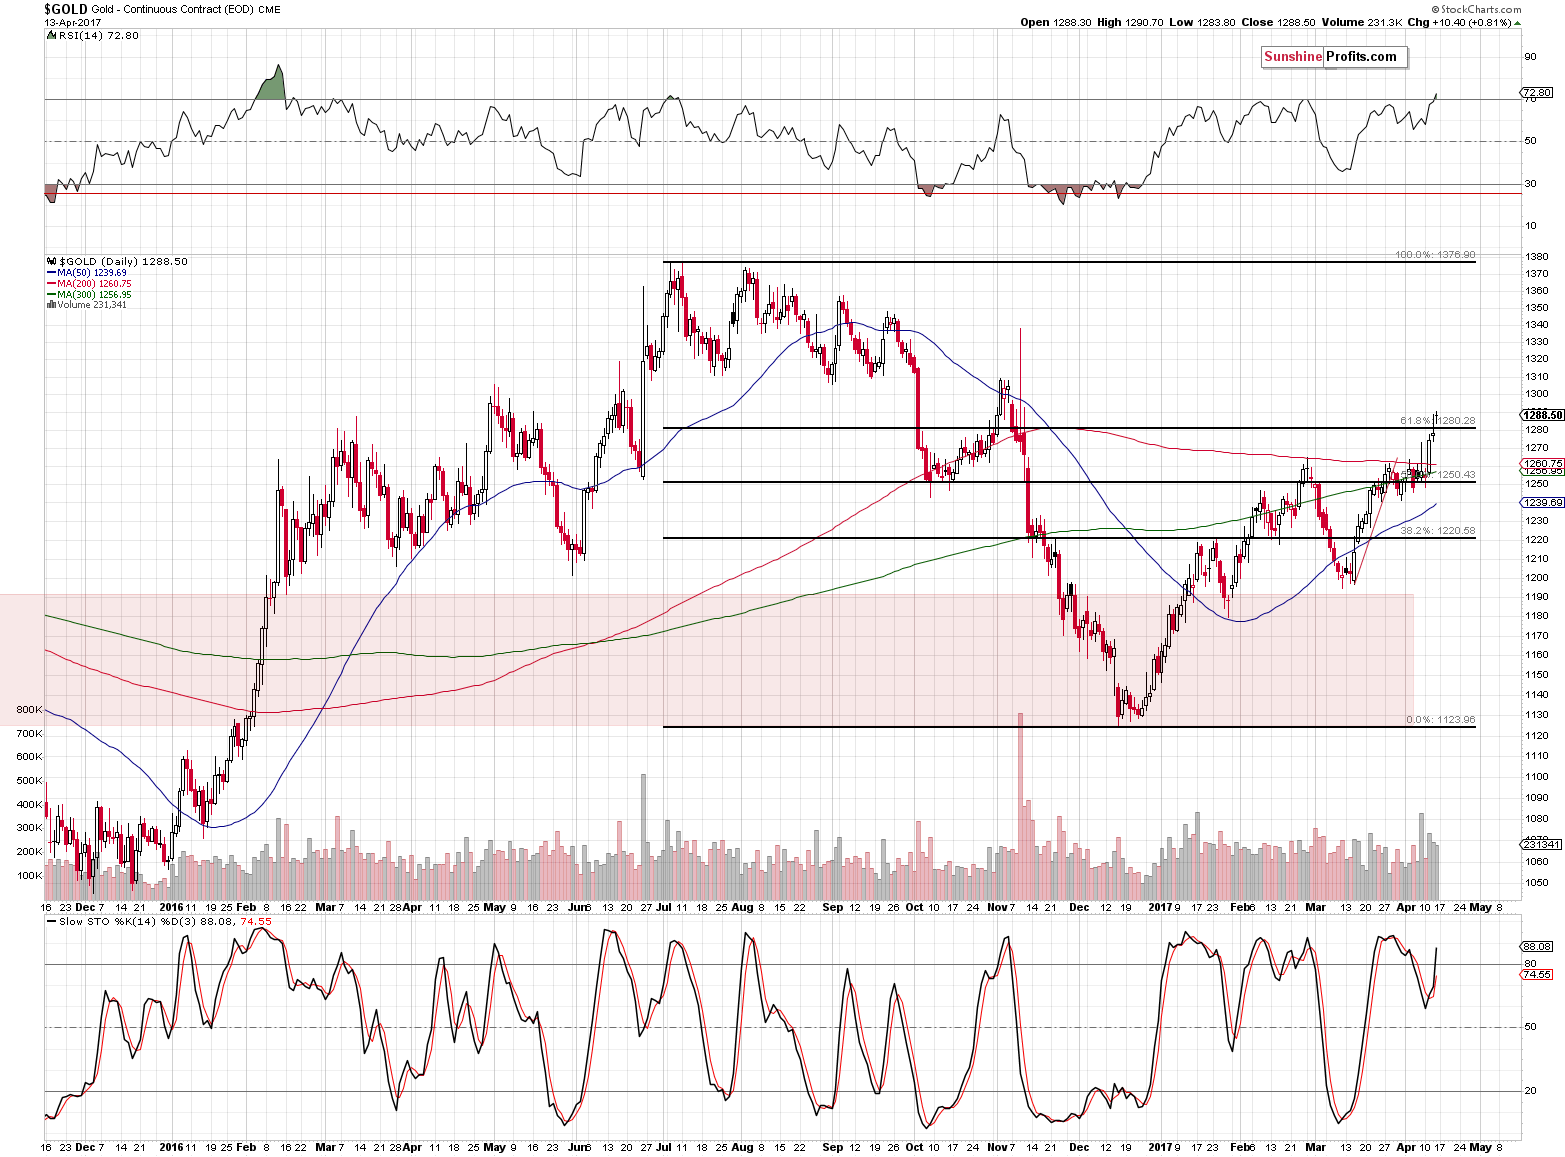
Gold’s short-term chart features its breakout above the 61.8% Fibonacci retracement (again, the long-term resistance is relatively close, so the above is not likely to result in a substantial rally) and a new sell signal from the RSI indicator. In Thursday’s alert we wrote the following:
Besides the mentioned 61.8% Fibonacci retracement level, the thing that should be kept in mind is the RSI indicator at the 70 level. Technically, it was 69.24 yesterday, but based on gold’s move above $1,285, it seems fair to assume that the RSI indeed moved above 70. That’s a new sell signal.
The above chart features two resistance levels above the retracement – the November highs: one in terms of the closing prices and the other in terms of intra-day prices. The closest resistance is at about $1,310.
The sell signal is now a clear fact.
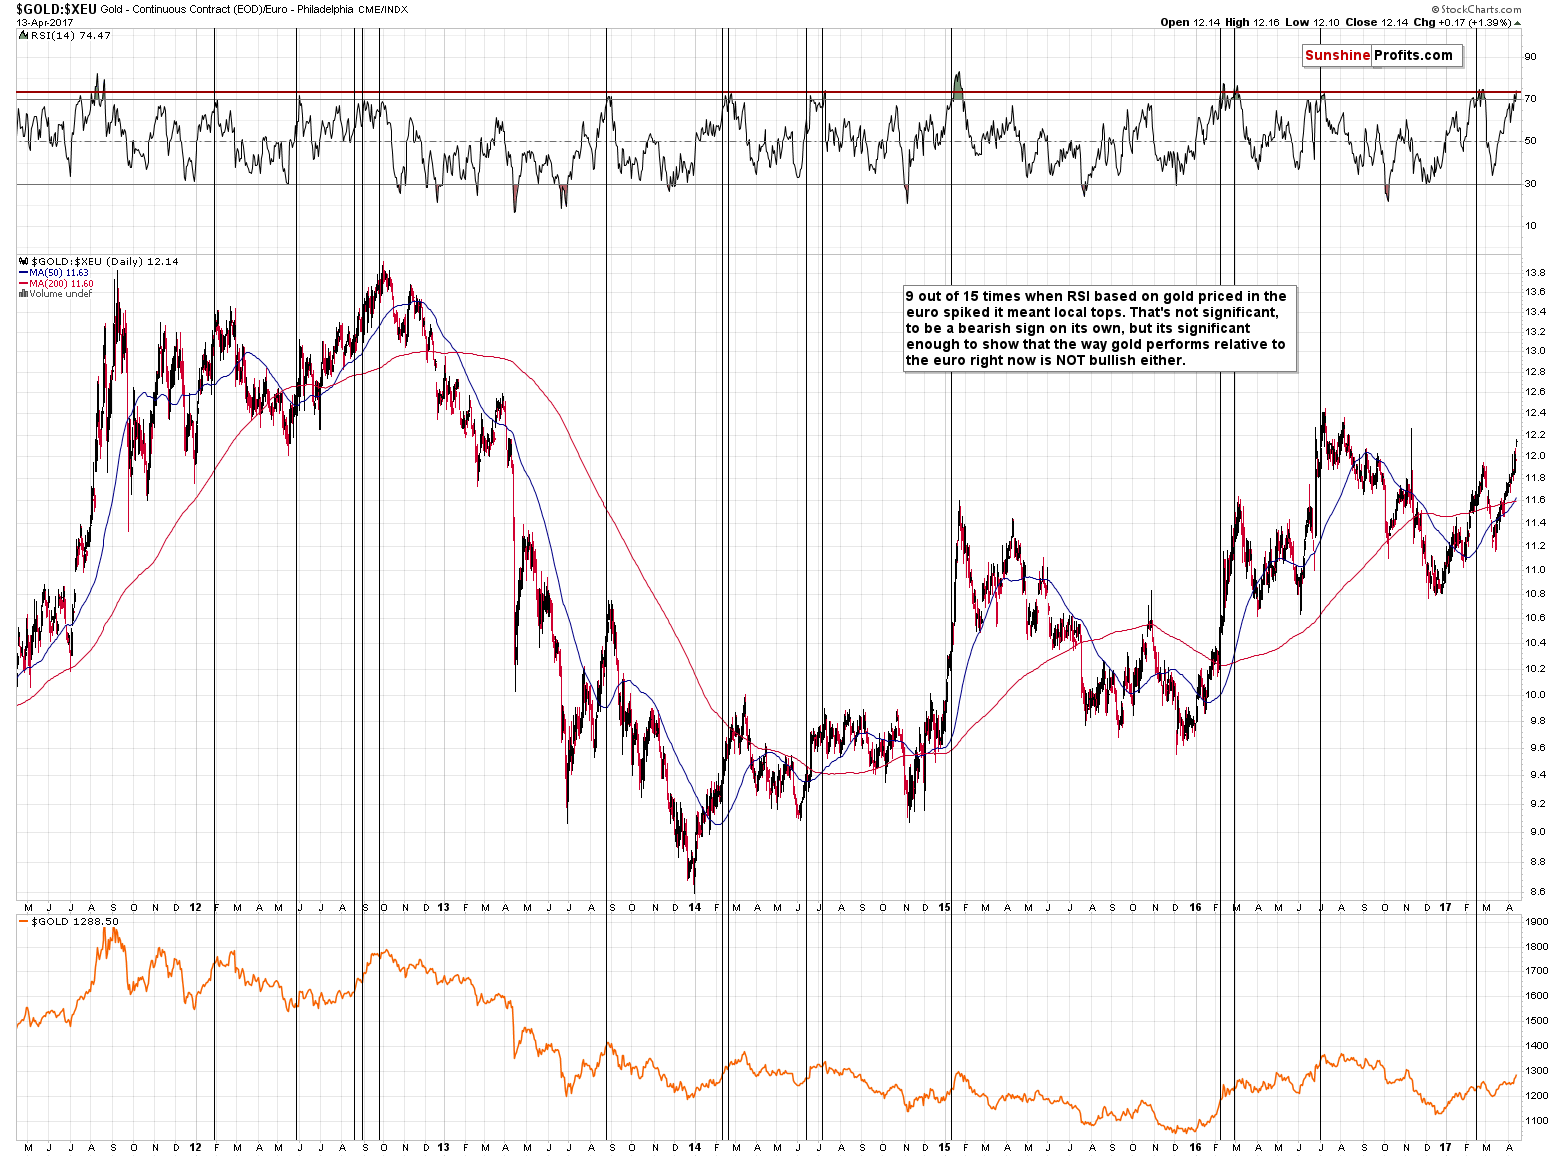
The same goes for the RSI indicator in the case of gold priced in the euro, and the implications are also bearish.
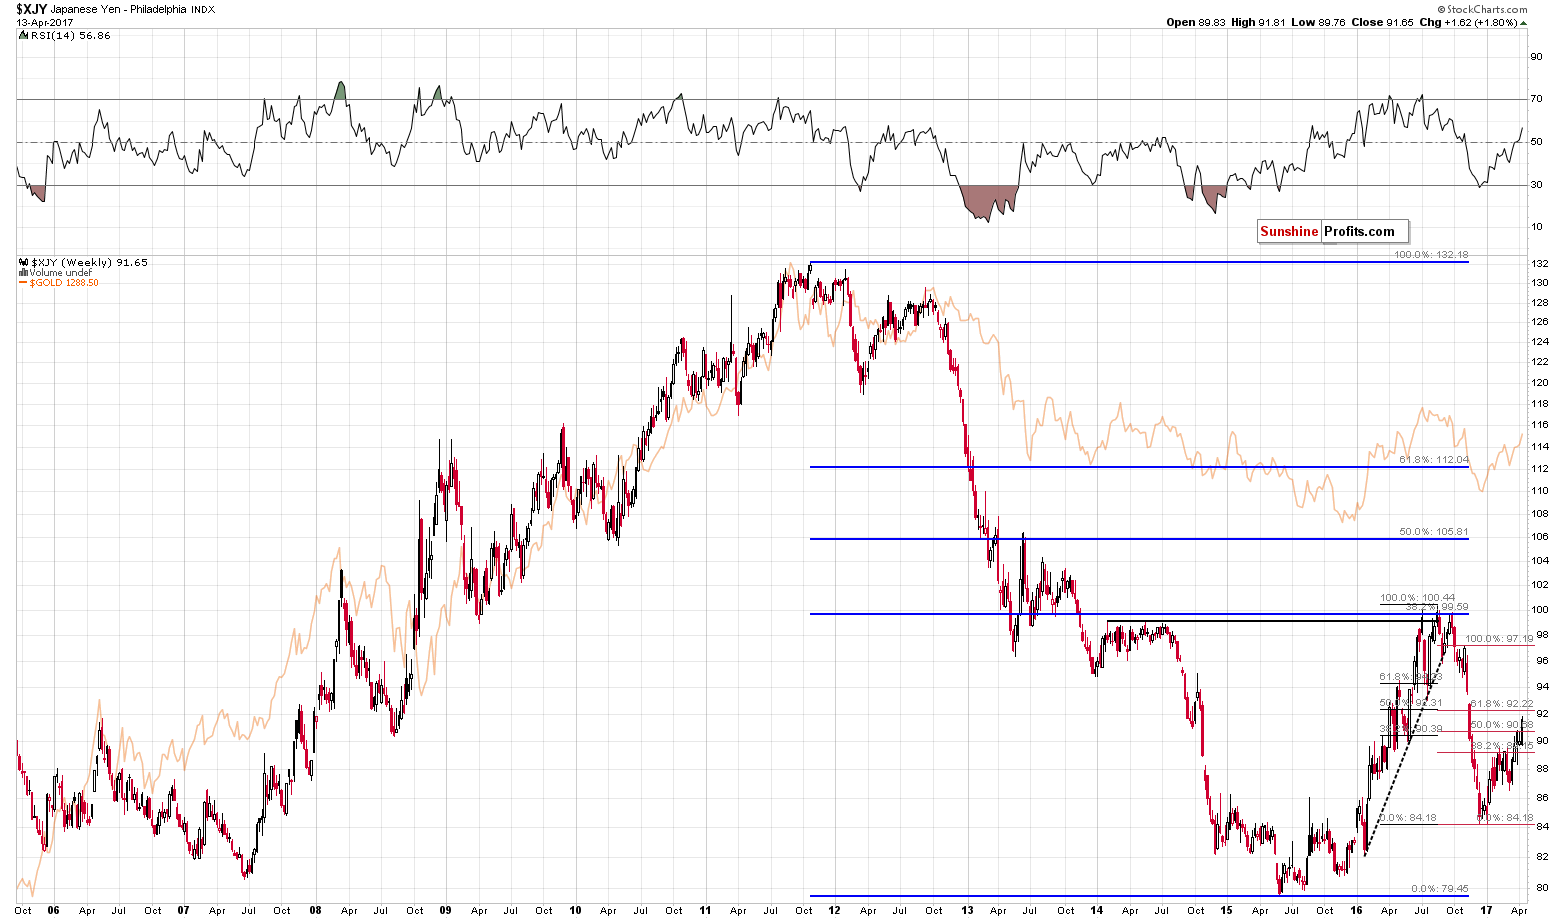
As far as the Japanese yen is concerned, we finally didn’t see any meaningful changes on Thursday:
Gold’s strong and positive link to the Japanese yen is yet another reason to view the current move as something unsustainable. On the above chart, it seems that the correction in the value of the Japanese currency is almost over as it approached both Fibonacci retracement levels (based on different starting points: one marked in black and the other one marked in red) and it moved higher in a classic corrective zig-zag form, which adds to the credibility of the resistance that was encountered.
Yen moved further on Friday, so it could be the case that the top was reached even though it is not visible on the above chart. We’ll be able to say that yen reversed once it starts to decline once again, but based on Friday’s session and yen’s move almost right to the resistance levels, the outlook appears to have deteriorated.
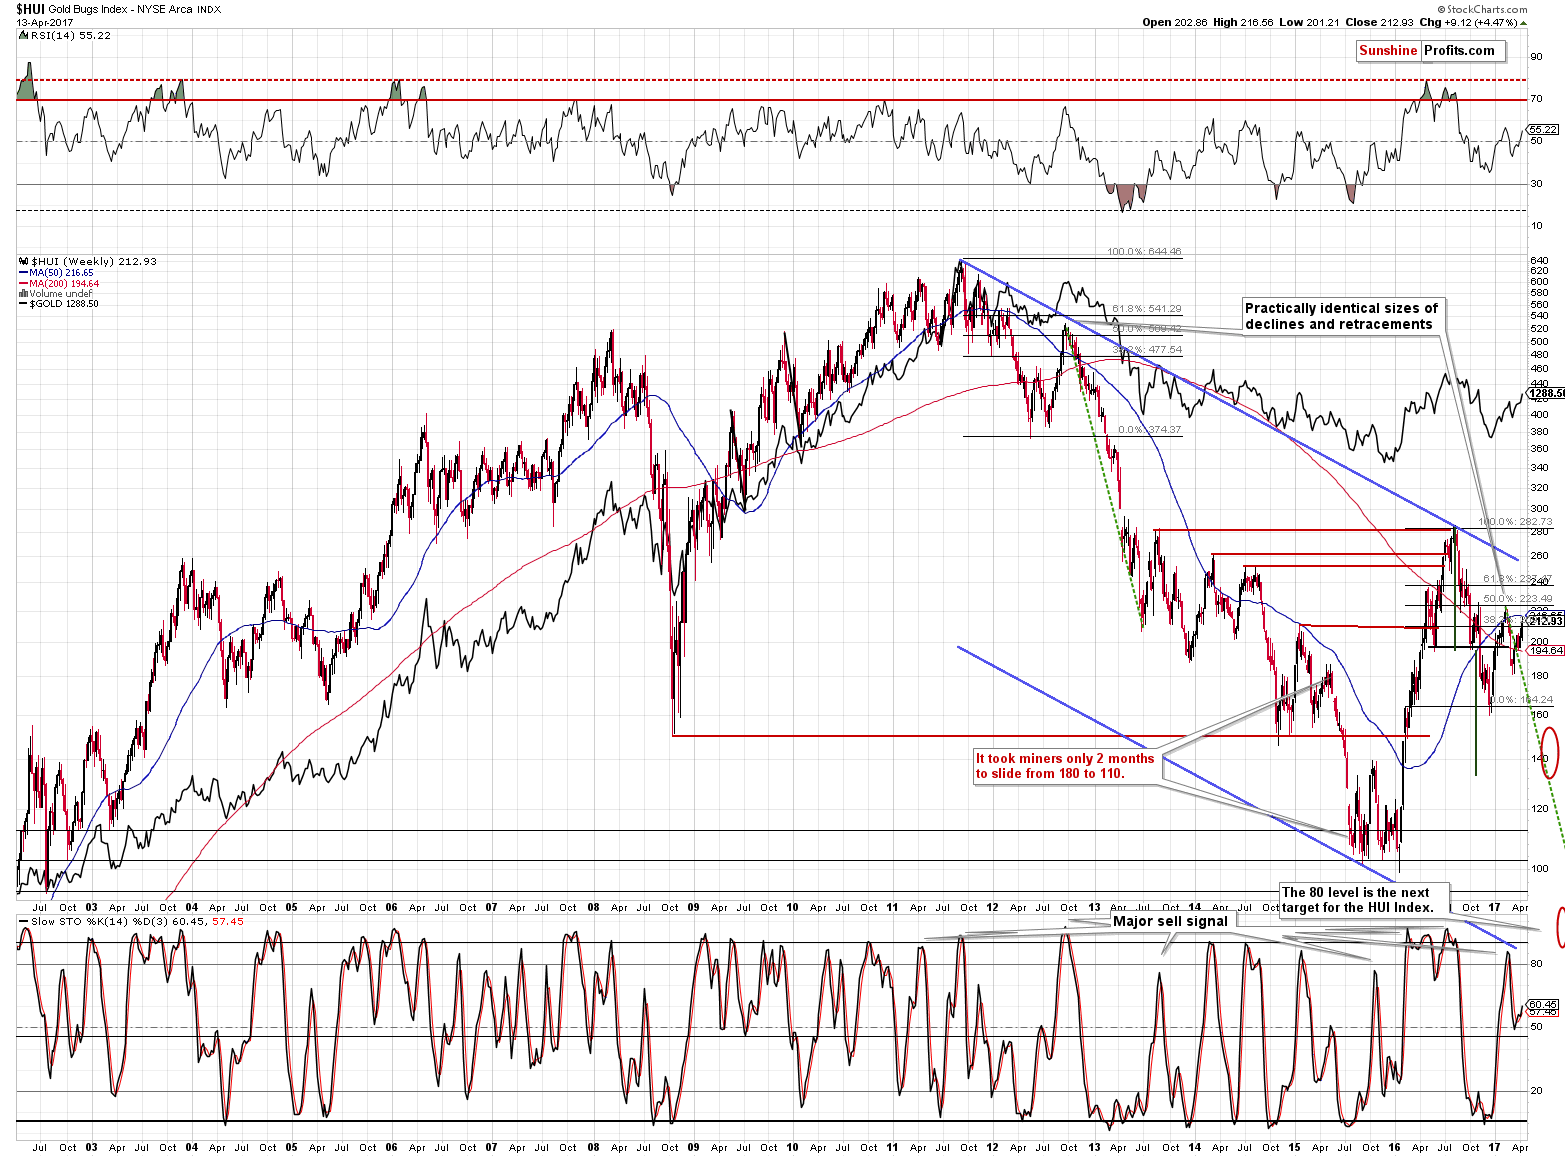
Gold stocks moved to their 50-week moving average, which served as resistance in early 2015 approximately at the same level as they are right now, which is mildly bearish. Only mildly, because in several other cases, this moving average did not serve as strong resistance.
The more important thing about this moving average is that it started to decline. Is it significant? Well, the only times that it previously happened in a really visible way were in late 2011 (at the top), in mid-2008 (also at the local top – after the first part of the slide and the first correction), and in late 2004 (before the biggest part of the decline). The current decline in this MA is not very visible yet, so the implications are not strongly bearish, but still, it is a somewhat bearish indication that will become a very bearish one once miners decline or consolidate some more (and the MA declines more visibly).
Moreover, please note that while gold and silver moved higher on Thursday, mining stocks didn’t – they actually declined slightly, which is a subtle bearish sign.
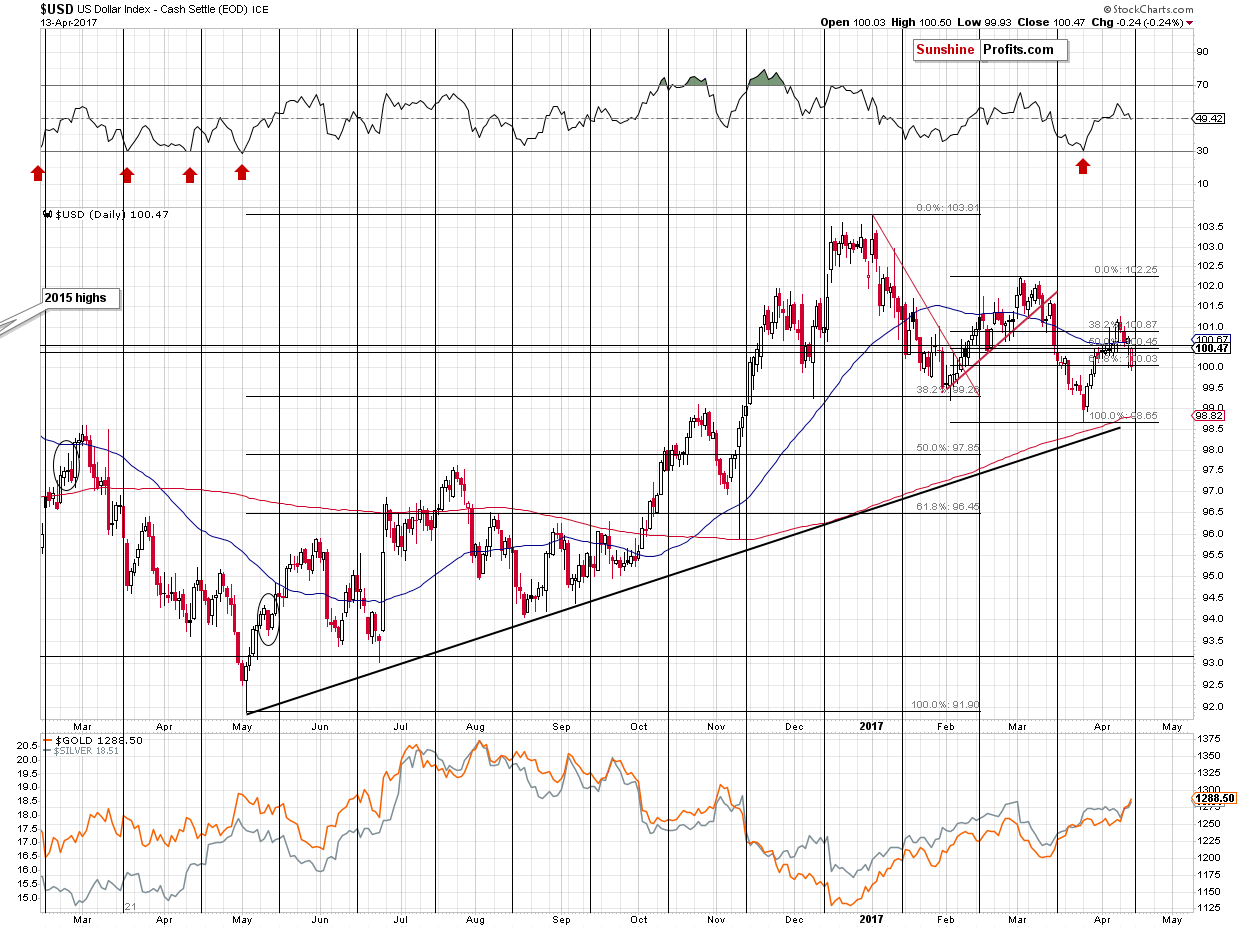
The USD Index declined right before its cyclical turning point, which suggests that this corrective decline is likely overdone or very close to being over (turning points tend to work on a near-to basis).
Naturally, the most important picture is the long-term one.
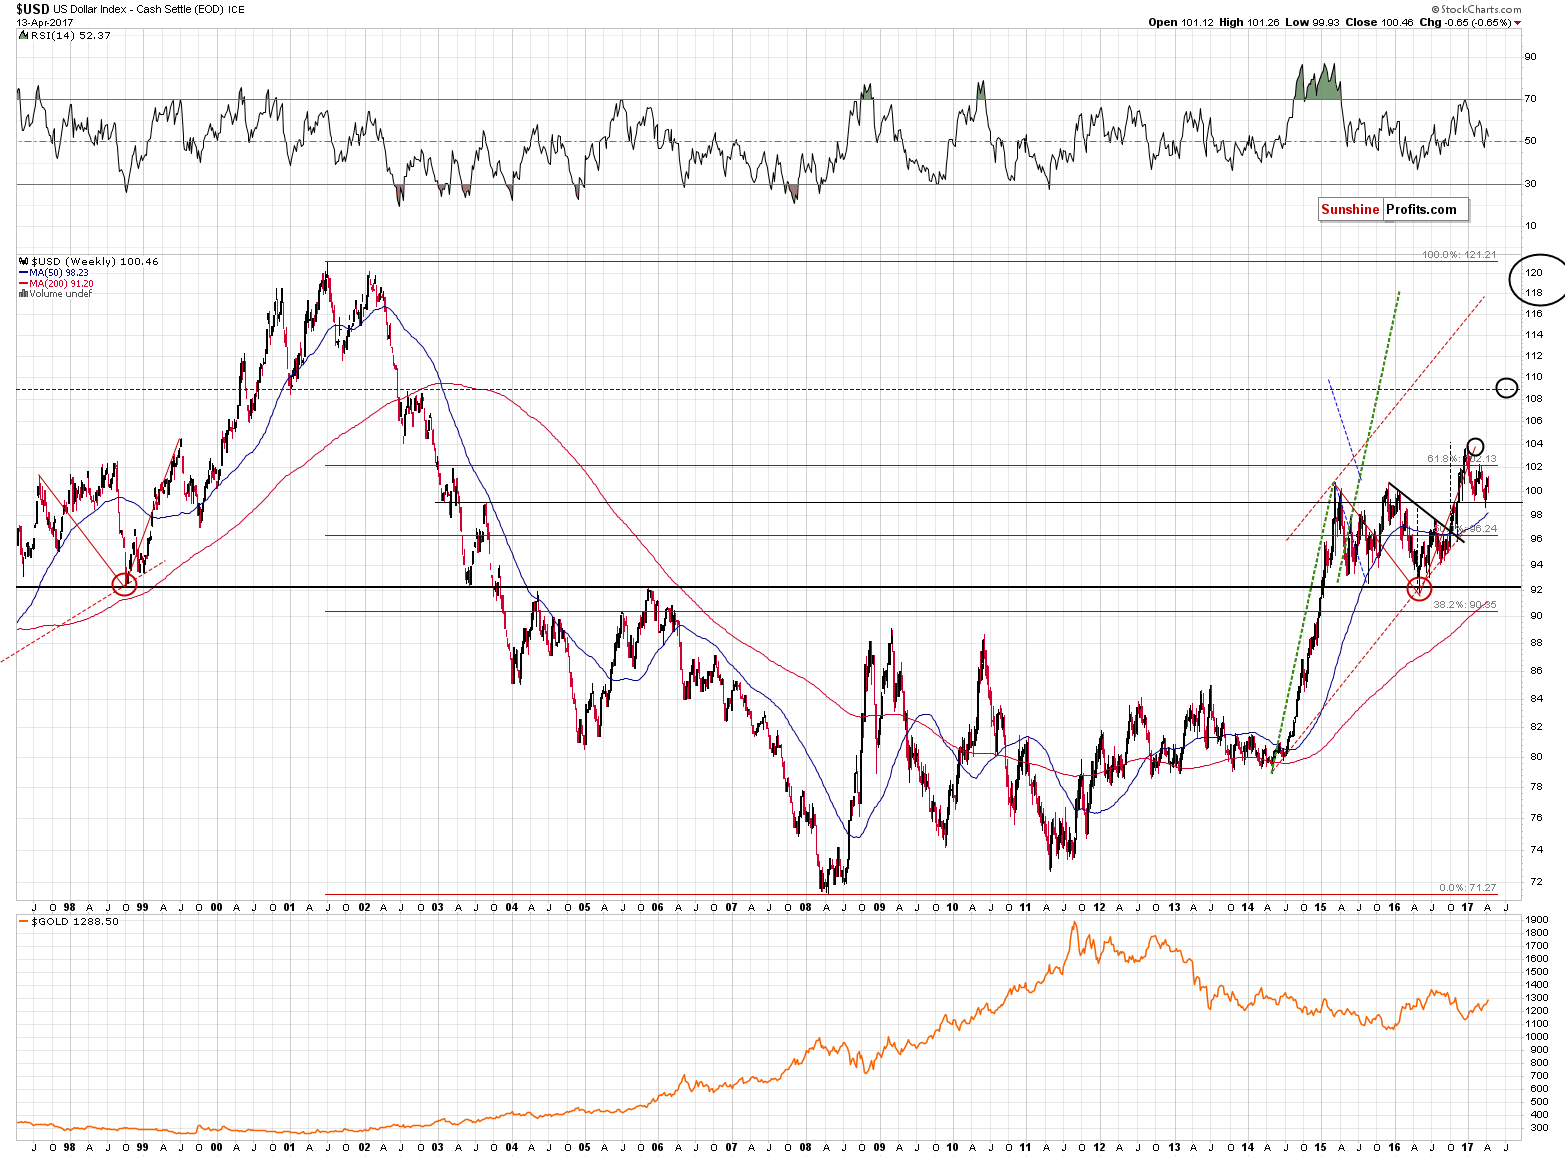
While gold doesn’t necessarily respond to USD’s short-term price swings, it’s medium-term moves are usually opposite to USD’s moves. Therefore, the major breakout in the USD Index that we saw in late 2016 and the subsequent verification of this breakout that made the picture for the USD Index very bullish, make the outlook for gold very bearish for the following months.
Additionally, the reflective nature of the current upswing in the USD Index (the 2009 – now rally and its comparison to the pre-2009-bottom decline) suggests that a sharp upswing is just around the corner. This further confirms the points made above.
Summing up, not much changed on the precious metals market on Friday and points made previously remain up-to-date. The same goes for the summary of Thursday’s alert:
So, with gold’s bearish signals (described yesterday) remaining intact, a new sell signal from the RSI indicator, and the proximity of a sell signal in the Japanese yen and the fact that long-term resistance level ($1,309) is at hand, is an unconfirmed and tiny breakout above the important 61.8 Fibonacci retracement level enough to change the outlook? We don’t think so. It appears to be a good time to enter a short position in the precious metals sector instead of closing one.
As always, we will keep you – our subscribers – informed.
To summarize:
Trading capital (supplementary part of the portfolio; our opinion): Short positions (150% of the full position) in gold, silver and mining stocks are justified from the risk/reward perspective with the following stop-loss orders and initial target price levels / profit-take orders:
- Gold: exit-profit-take level: $1,063; stop-loss: $1,317; initial target price for the DGLD ETN: $81.88; stop-loss for the DGLD ETN $44.57
- Silver: initial target price: $13.12; stop-loss: $19.22; initial target price for the DSLV ETN: $46.18; stop-loss for the DSLV ETN $17.93
- Mining stocks (price levels for the GDX ETF): initial target price: $9.34; stop-loss: $26.34; initial target price for the DUST ETF: $143.56; stop-loss for the DUST ETF $21.37
In case one wants to bet on junior mining stocks' prices (we do not suggest doing so – we think senior mining stocks are more predictable in the case of short-term trades – if one wants to do it anyway, we provide the details), here are the stop-loss details and initial target prices:
- GDXJ ETF: initial target price: $14.13; stop-loss: $45.31
- JDST ETF: initial target price: $104.26; stop-loss: $10.78
Long-term capital (core part of the portfolio; our opinion): No positions (in other words: cash)
Insurance capital (core part of the portfolio; our opinion): Full position
Please note that the in the trading section we describe the situation for the day that the alert is posted. In other words, it we are writing about a speculative position, it means that it is up-to-date on the day it was posted. We are also featuring the initial target prices, so that you can decide whether keeping a position on a given day is something that is in tune with your approach (some moves are too small for medium-term traders and some might appear too big for day-traders).
Plus, you might want to read why our stop-loss orders are usually relatively far from the current price.
Please note that a full position doesn’t mean using all of the capital for a given trade. You will find details on our thoughts on gold portfolio structuring in the Key Insights section on our website.
As a reminder – “initial target price” means exactly that – an “initial” one, it’s not a price level at which we suggest closing positions. If this becomes the case (like it did in the previous trade) we will refer to these levels as levels of exit orders (exactly as we’ve done previously). Stop-loss levels, however, are naturally not “initial”, but something that, in our opinion, might be entered as an order.
Since it is impossible to synchronize target prices and stop-loss levels for all the ETFs and ETNs with the main markets that we provide these levels for (gold, silver and mining stocks – the GDX ETF), the stop-loss levels and target prices for other ETNs and ETF (among other: UGLD, DGLD, USLV, DSLV, NUGT, DUST, JNUG, JDST) are provided as supplementary, and not as “final”. This means that if a stop-loss or a target level is reached for any of the “additional instruments” (DGLD for instance), but not for the “main instrument” (gold in this case), we will view positions in both gold and DGLD as still open and the stop-loss for DGLD would have to be moved lower. On the other hand, if gold moves to a stop-loss level but DGLD doesn’t, then we will view both positions (in gold and DGLD) as closed. In other words, since it’s not possible to be 100% certain that each related instrument moves to a given level when the underlying instrument does, we can’t provide levels that would be binding. The levels that we do provide are our best estimate of the levels that will correspond to the levels in the underlying assets, but it will be the underlying assets that one will need to focus on regarding the signs pointing to closing a given position or keeping it open. We might adjust the levels in the “additional instruments” without adjusting the levels in the “main instruments”, which will simply mean that we have improved our estimation of these levels, not that we changed our outlook on the markets. We are already working on a tool that would update these levels on a daily basis for the most popular ETFs, ETNs and individual mining stocks.
Our preferred ways to invest in and to trade gold along with the reasoning can be found in the how to buy gold section. Additionally, our preferred ETFs and ETNs can be found in our Gold & Silver ETF Ranking.
As always, we'll keep you - our subscribers - updated should our views on the market change. We will continue to send out Gold & Silver Trading Alerts on each trading day and we will send additional Alerts whenever appropriate.
The trading position presented above is the netted version of positions based on subjective signals (opinion) from your Editor, and the Tools and Indicators.
As a reminder, Gold & Silver Trading Alerts are posted before or on each trading day (we usually post them before the opening bell, but we don't promise doing that each day). If there's anything urgent, we will send you an additional small alert before posting the main one.
=====
Latest Free Trading Alerts:
This week, the price of gold reached five-month highs. What does it mean for the gold market?
Geopolitics and Trump Support Gold
After a long wait, President has finally presented his budget blueprint “to make America great again”. How could the upcoming fiscal policy affect the gold market? We invite you to read our today’s article about the Trump’s budget plan and find out what does it mean for the gold prices.
=====
Hand-picked precious-metals-related links:
The mysterious quiescence of the gold market
Gold Rally Gets Feverish as Trader Survey Flashes Extreme Level
U.K. Royal Mint's Gold Sales Jump 20% Amid Political Turmoil
=====
In other news:
Trump Rattles Saber at North Korea as Pence Dispatched to Seoul
Falling Inflation, Retail Sales Bolster Fed's Go-Slow Approach
The $7 Trillion Hazard That Lies Beneath the M&A Boom
Why Trump's Weak-Dollar Policy Threatens the U.S. Stock Rally
As Trump Falters on Corporate Tax Cut, Wall Street Could Plummet
French presidential race tightens further as vote looms
North Korea displays apparently new missiles as U.S. carrier group approaches
=====
Thank you.
Sincerely,
Przemyslaw Radomski, CFA
Founder, Editor-in-chief, Gold & Silver Fund Manager
Gold & Silver Trading Alerts
Forex Trading Alerts
Oil Investment Updates
Oil Trading Alerts

