

Briefly: In our opinion, full (150% of the regular full position) speculative short positions in gold, silver and mining stocks are justified from the risk/reward perspective at the moment of publishing this alert. We are moving the stop-loss level higher for gold.
During yesterday’s session gold moved above the 61.8% Fibonacci retracement level, closed the session back below it (at least the continuous futures contract did) and it’s back above it in today’s pre-market trading. What can this tell us about gold’s future price movement?
First of all, the breakout was not and is not confirmed at the moment of writing these words. However, gold is close enough to it to consider what to do if gold does indeed move above the 61.8% Fibonacci retracement. How high would it be likely to rally?
Let’s take a look at the gold chart for details (charts courtesy of http://stockcharts.com).
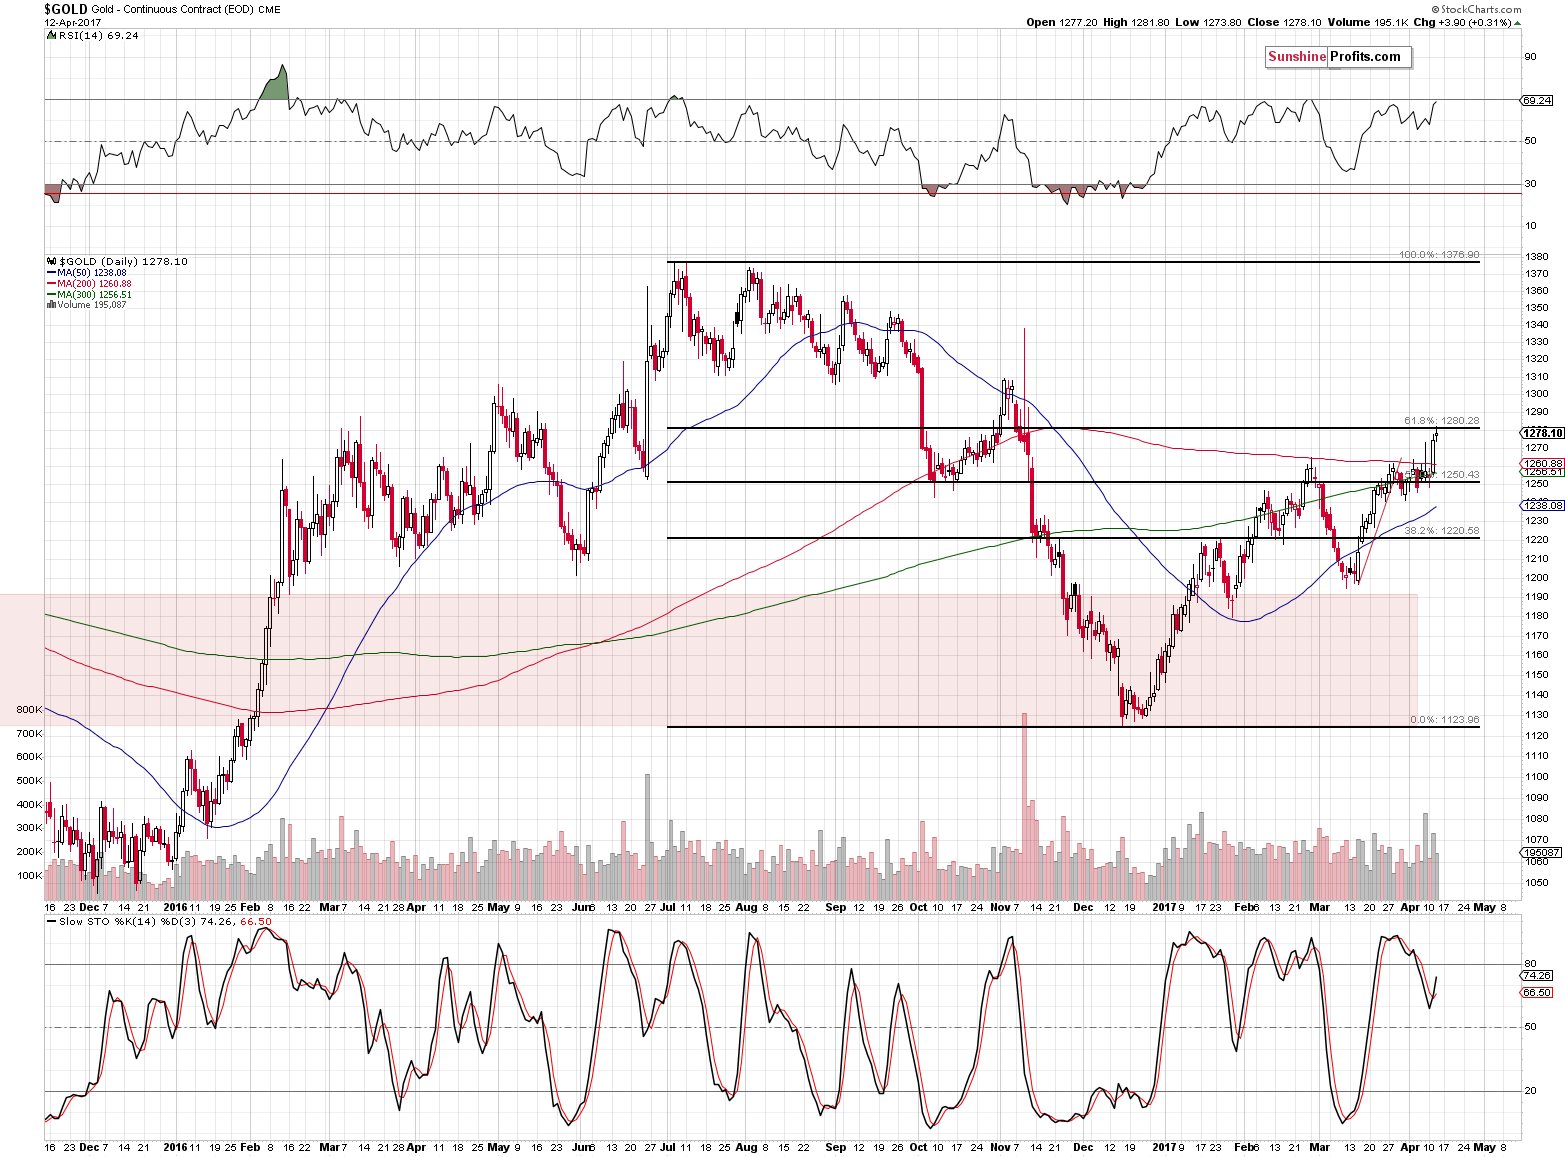
Besides the mentioned 61.8% Fibonacci retracement level, the thing that should be kept in mind is the RSI indicator at the 70 level. Technically, it was 69.24 yesterday, but based on gold’s move above $1,285, it seems fair to assume that the RSI indeed moved above 70. That’s a new sell signal.
The above chart features two resistance levels above the retracement – the November highs: one in terms of the closing prices and the other in terms of intra-day prices. The closest resistance is at about $1,310.
Now, let’s take a look at the more important – long-term chart.
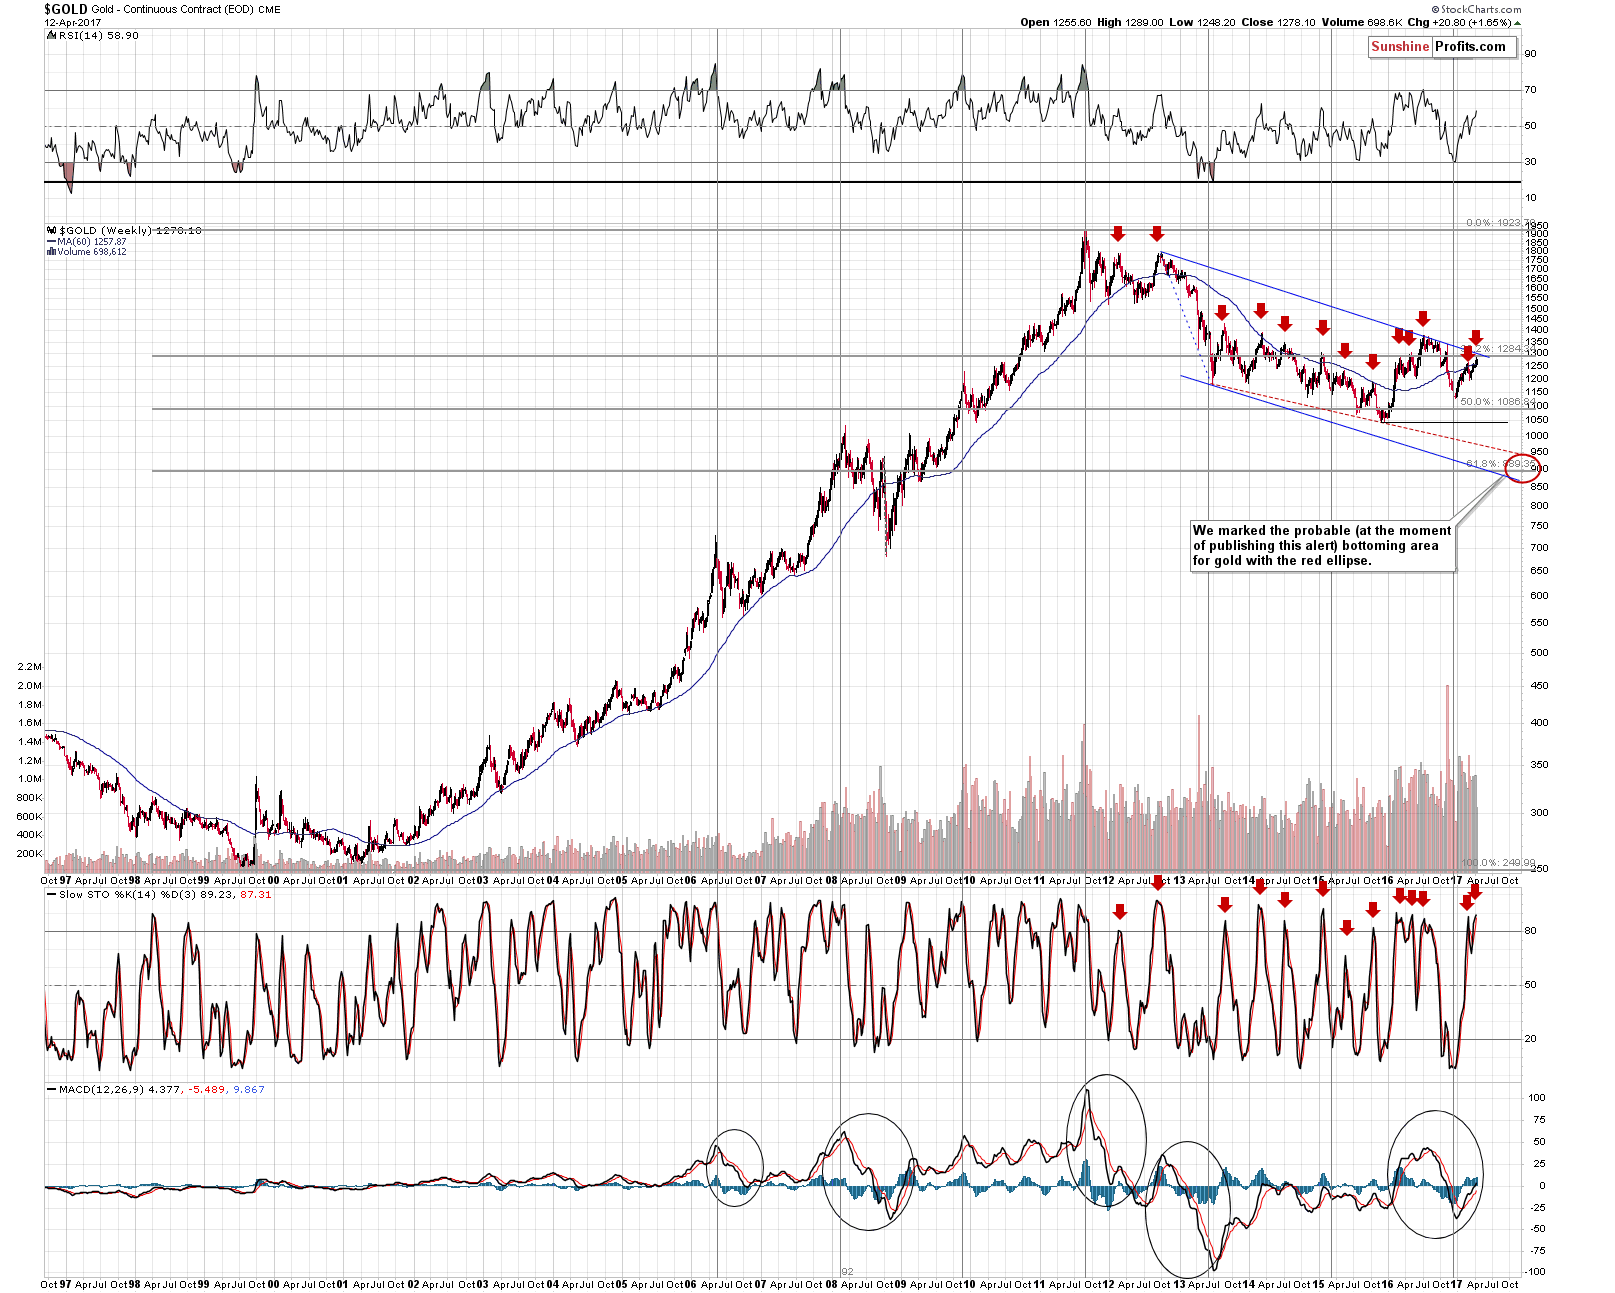
The RSI also suggests that a major (!) turnaround is just around the corner, but as far as the resistance levels and lines are concerned, there are also two important levels that one should keep in mind: the 38.2% Fibonacci retracement and the long-term declining resistance line. The former is at $1,284 (which is yet another reason not to treat yesterday’s / today’s upswing seriously without confirmation) and the latter is either at $1,293 (based on weekly closing prices) or $1,309 (based on intra-day highs).
Let’s keep in mind that the long-term indications are more important than the short-term ones, so the mentioned resistance levels are very significant.
So, the question is, if one prefers to adjust the position based on the possibility (! – not big probability) of a $20 move higher in light of multiple signs pointing to lower prices in the coming weeks regardless of whether gold reverses right away or higher.
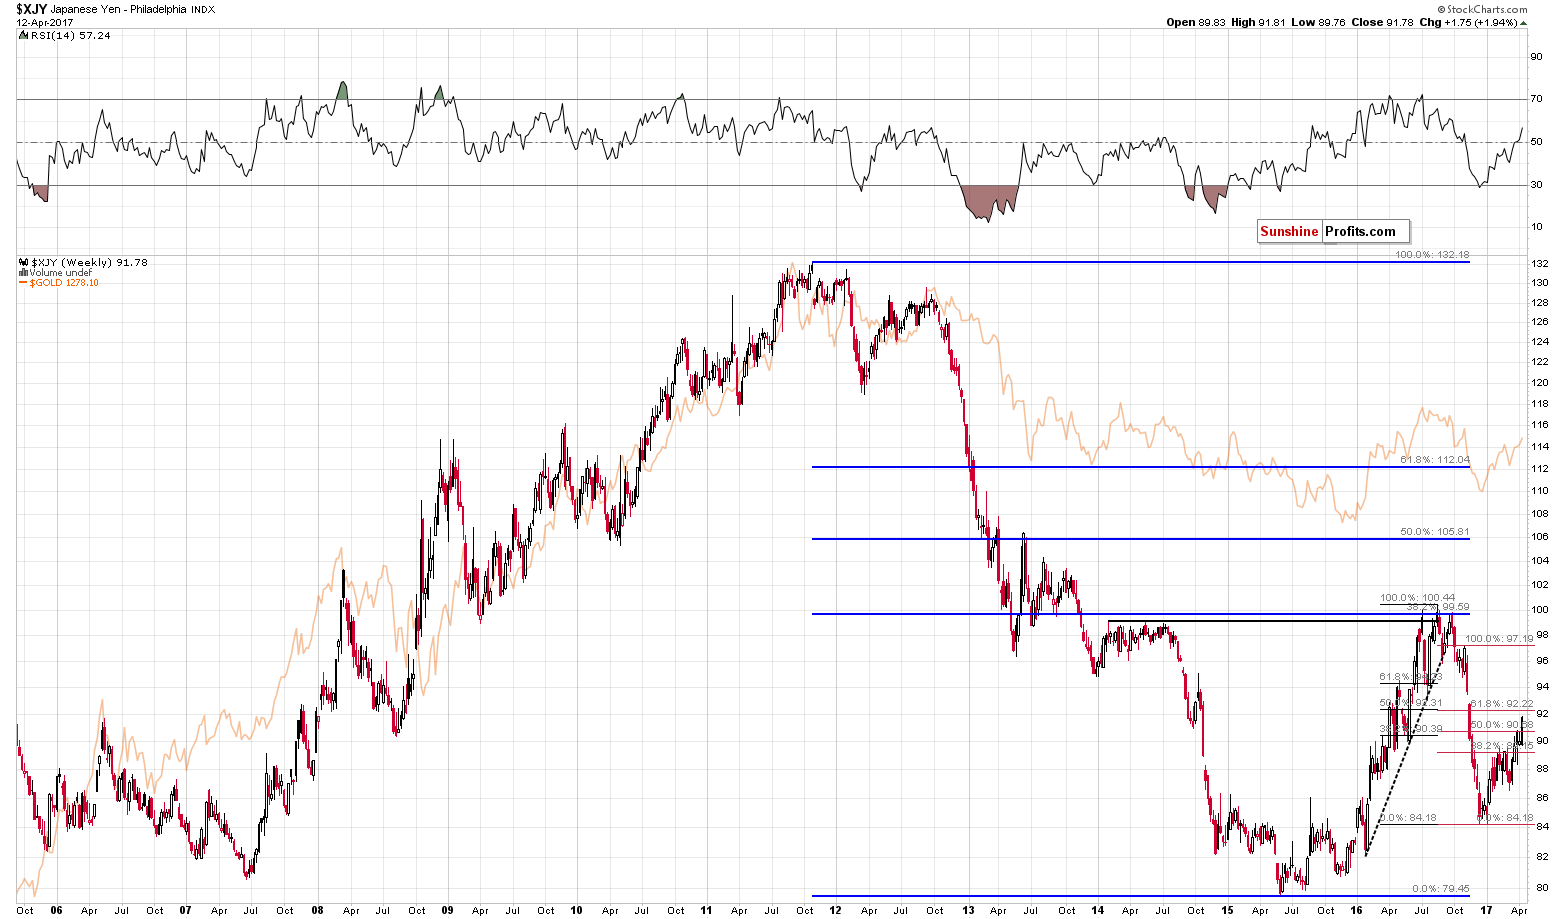
Gold’s strong and positive link to the Japanese yen is yet another reason to view the current move as something unsustainable. On the above chart, it seems that the correction in the value of the Japanese currency is almost over as it approached both Fibonacci retracement levels (based on different starting points: one marked in black and the other one marked in red) and it moved higher in a classic corrective zig-zag form, which adds to the credibility of the resistance that was encountered. It’s not clearly visible on the above chart, so let’s take a look at the short-term and up-to-date chart (it includes today’s price moves) – you will find a quote from today’s Forex Trading Alert below (please note that the chart below is inverse to the above one):
Quoting our last commentary on this currency pair:
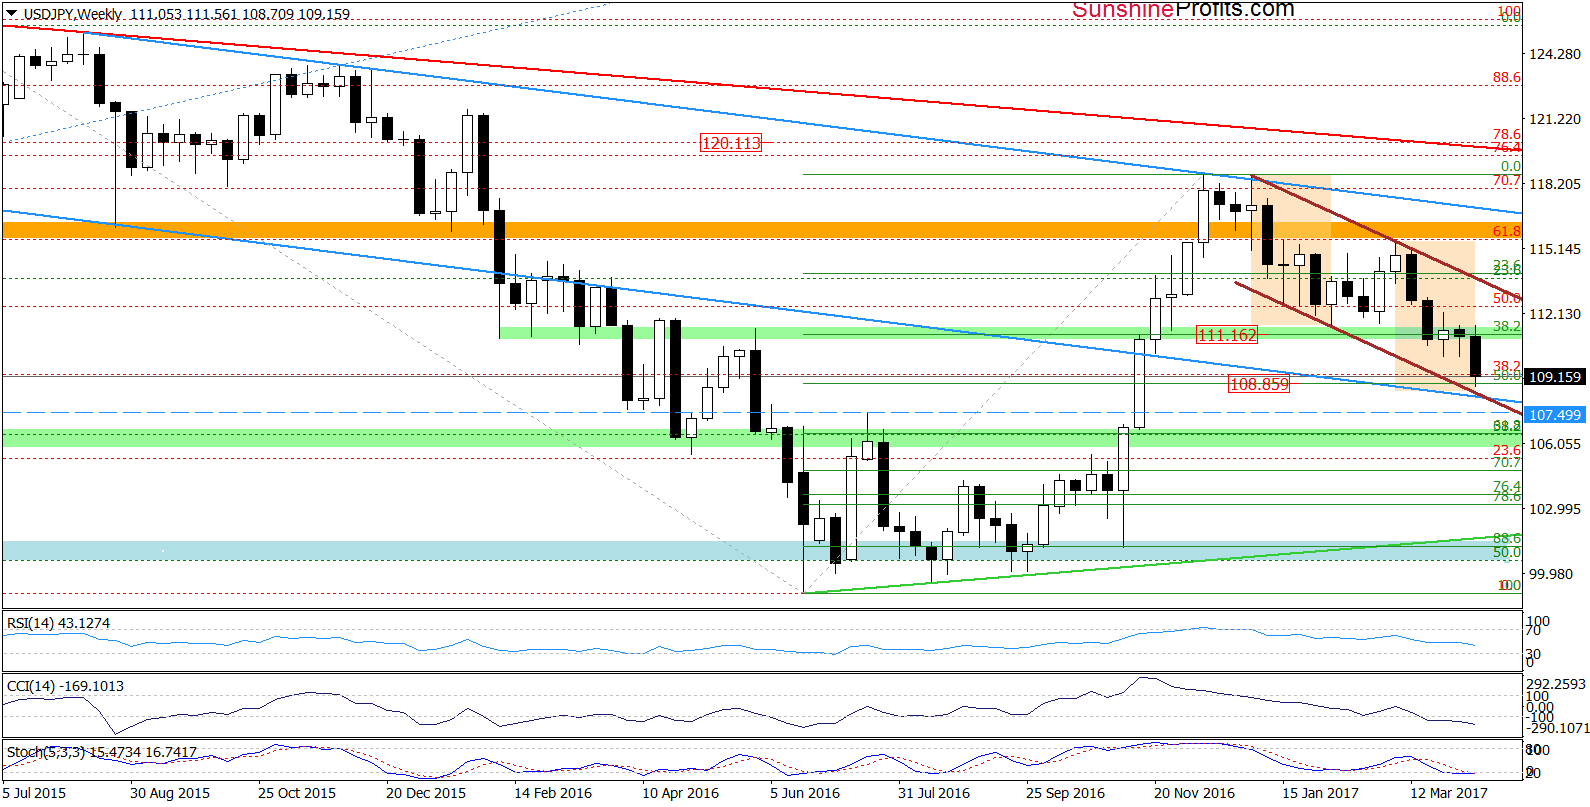
(…) What’s next? (…) considering the sell signal generated by the Stochastic Oscillator it seems to us that the pair will re-test the recent lows in the coming days. (…) But what could happen if this support area is broken?
(…) if USD/JPY breaks below the recent lows, we may see a decline even to around 108.86, where the 50% Fibonacci retracement based on the entire June-November upward move is. At this point, it is also worth noting that in this area the size of the current decline will correspond to the downward move, which we saw between January and early February.
From today’s point of view, we see that the situation developed in tune with the above scenario and USD/JPY declined to our downside target earlier today. This support level triggered a small rebound in the following hours, however, in our opinion as long as the exchange rate remains in the blue declining trend channel and there are no buy signals another downswing can’t be ruled out. Nevertheless, even if we see such price action, the space for declines seems limited – especially when we take into account the fact that the weekly and daily indicators are oversold and very close to generating buy signals.
The space for declines is indeed limited as the bottom of the trading channel was almost reached. The bottom on the above chart corresponds to a top one the previous chart, which in turn is likely to correspond to a top in gold.
The yen had previously moved to the previous Fibonacci retracement levels (and then moved above them), however, since this time these retracements are strengthened by the existence of the zigzag pattern, this time the chance for stopping the corrective move is bigger.
So, with gold’s bearish signals (described yesterday) remaining intact, a new sell signal from the RSI indicator, and the proximity of a sell signal in the Japanese yen and the fact that long-term resistance level ($1,309) is at hand, is an unconfirmed and tiny breakout above the important 61.8 Fibonacci retracement level enough to change the outlook? We don’t think so. It appears to be a good time to enter a short position in the precious metals sector instead of closing one. Consequently, we are moving the stop-loss above the mentioned resistance and keeping the short position intact. With dollars of upside potential (possibly) and tens or even hundreds of dollars of downside potential, the above seems to be justified.
As always, we will keep you – our subscribers – informed.
To summarize:
Trading capital (supplementary part of the portfolio; our opinion): Short positions (150% of the full position) in gold, silver and mining stocks are justified from the risk/reward perspective with the following stop-loss orders and initial target price levels / profit-take orders:
- Gold: exit-profit-take level: $1,063; stop-loss: $1,317; initial target price for the DGLD ETN: $81.88; stop-loss for the DGLD ETN $44.57
- Silver: initial target price: $13.12; stop-loss: $19.22; initial target price for the DSLV ETN: $46.18; stop-loss for the DSLV ETN $17.93
- Mining stocks (price levels for the GDX ETF): initial target price: $9.34; stop-loss: $26.34; initial target price for the DUST ETF: $143.56; stop-loss for the DUST ETF $21.37
In case one wants to bet on junior mining stocks' prices (we do not suggest doing so – we think senior mining stocks are more predictable in the case of short-term trades – if one wants to do it anyway, we provide the details), here are the stop-loss details and initial target prices:
- GDXJ ETF: initial target price: $14.13; stop-loss: $45.31
- JDST ETF: initial target price: $104.26; stop-loss: $10.78
Long-term capital (core part of the portfolio; our opinion): No positions (in other words: cash)
Insurance capital (core part of the portfolio; our opinion): Full position
Please note that the in the trading section we describe the situation for the day that the alert is posted. In other words, it we are writing about a speculative position, it means that it is up-to-date on the day it was posted. We are also featuring the initial target prices, so that you can decide whether keeping a position on a given day is something that is in tune with your approach (some moves are too small for medium-term traders and some might appear too big for day-traders).
Plus, you might want to read why our stop-loss orders are usually relatively far from the current price.
Please note that a full position doesn’t mean using all of the capital for a given trade. You will find details on our thoughts on gold portfolio structuring in the Key Insights section on our website.
As a reminder – “initial target price” means exactly that – an “initial” one, it’s not a price level at which we suggest closing positions. If this becomes the case (like it did in the previous trade) we will refer to these levels as levels of exit orders (exactly as we’ve done previously). Stop-loss levels, however, are naturally not “initial”, but something that, in our opinion, might be entered as an order.
Since it is impossible to synchronize target prices and stop-loss levels for all the ETFs and ETNs with the main markets that we provide these levels for (gold, silver and mining stocks – the GDX ETF), the stop-loss levels and target prices for other ETNs and ETF (among other: UGLD, DGLD, USLV, DSLV, NUGT, DUST, JNUG, JDST) are provided as supplementary, and not as “final”. This means that if a stop-loss or a target level is reached for any of the “additional instruments” (DGLD for instance), but not for the “main instrument” (gold in this case), we will view positions in both gold and DGLD as still open and the stop-loss for DGLD would have to be moved lower. On the other hand, if gold moves to a stop-loss level but DGLD doesn’t, then we will view both positions (in gold and DGLD) as closed. In other words, since it’s not possible to be 100% certain that each related instrument moves to a given level when the underlying instrument does, we can’t provide levels that would be binding. The levels that we do provide are our best estimate of the levels that will correspond to the levels in the underlying assets, but it will be the underlying assets that one will need to focus on regarding the signs pointing to closing a given position or keeping it open. We might adjust the levels in the “additional instruments” without adjusting the levels in the “main instruments”, which will simply mean that we have improved our estimation of these levels, not that we changed our outlook on the markets. We are already working on a tool that would update these levels on a daily basis for the most popular ETFs, ETNs and individual mining stocks.
Our preferred ways to invest in and to trade gold along with the reasoning can be found in the how to buy gold section. Additionally, our preferred ETFs and ETNs can be found in our Gold & Silver ETF Ranking.
As always, we'll keep you - our subscribers - updated should our views on the market change. We will continue to send out Gold & Silver Trading Alerts on each trading day and we will send additional Alerts whenever appropriate.
The trading position presented above is the netted version of positions based on subjective signals (opinion) from your Editor, and the Tools and Indicators.
As a reminder, Gold & Silver Trading Alerts are posted before or on each trading day (we usually post them before the opening bell, but we don't promise doing that each day). If there's anything urgent, we will send you an additional small alert before posting the main one.
=====
Latest Free Trading Alerts:
Last week, Donald Trump met with Xi Jinping. What does it mean for the gold market?
S&P 500 index lost 0.4% on Wednesday, as it got closer to its Tuesday's local low. Is this a new downtrend or just short-term consolidation? Is holding short position still justified?
Stock Trading Alert: Negative Expectations, But Will Market Break Below Short-Term Consolidation?
=====
Hand-picked precious-metals-related links:
PRECIOUS-Gold hits five-month high as Trump comments hurt dollar
Gold price jumps on Trump comments, North Korea
CME & Royal Mint test blockchain platform for gold
=====
In other news:
U.S. dollar drops sharply after Trump calls it 'too strong'
Trump tanked the dollar, but it’ll bounce back soon, analysts say
Fear Is Creeping Back Into Markets
Trump’s Reversal on China Currency His Latest Abandoned Promise
JPMorgan: 'U.S. consumers and businesses are healthy'
Time has come for banks to prepare for interest rate rises: Bundesbank
Why GDP Is a Dumb Way to Measure Economic Output
IEA says global oil market nears balance even as stocks rise
=====
Thank you.
Sincerely,
Przemyslaw Radomski, CFA
Founder, Editor-in-chief, Gold & Silver Fund Manager
Gold & Silver Trading Alerts
Forex Trading Alerts
Oil Investment Updates
Oil Trading Alerts

