

Briefly: In our opinion, full (150% of the regular full position) speculative short positions in gold, silver and mining stocks are justified from the risk/reward perspective at the moment of publishing this alert.
How does yesterday’s upswing in gold, silver and mining stocks change the current outlook? Does it alter the long-term outlook or is it something important for short-term traders only?
Yesterday’s move was most likely not important for long-term investments and as far as trading is concerned, the session was important, but this doesn’t mean that it should be viewed as a game-changer.
Before jumping right into the charts (charts courtesy of http://stockcharts.com), let’s mention one important short-term factor regarding yesterday’s trading: gold just got cramerized. In other words, gold was just featured as the asset of choice by Jim Cramer on his Mad Money show. It is quite often the case that the additional and sudden popularity that a given asset gets due to this how is subject to a volatile decline right after the post-show upswing. The likely reason is that it is the investment public, not professionals that make investment decisions based on the show and, well, when the public enters a given market it is usually a good idea to do the opposite. Now, gold is a large market, so the above cannot explain the entire daily rally, but it does give good background information that could explain the relative strength in mining stocks and make one think twice before accepting their breakout at face value.
In yesterday’s second alert, we emphasized that gold was generally where it had been on Friday, so what we wrote back then remained up-to-date – it is still the case today:
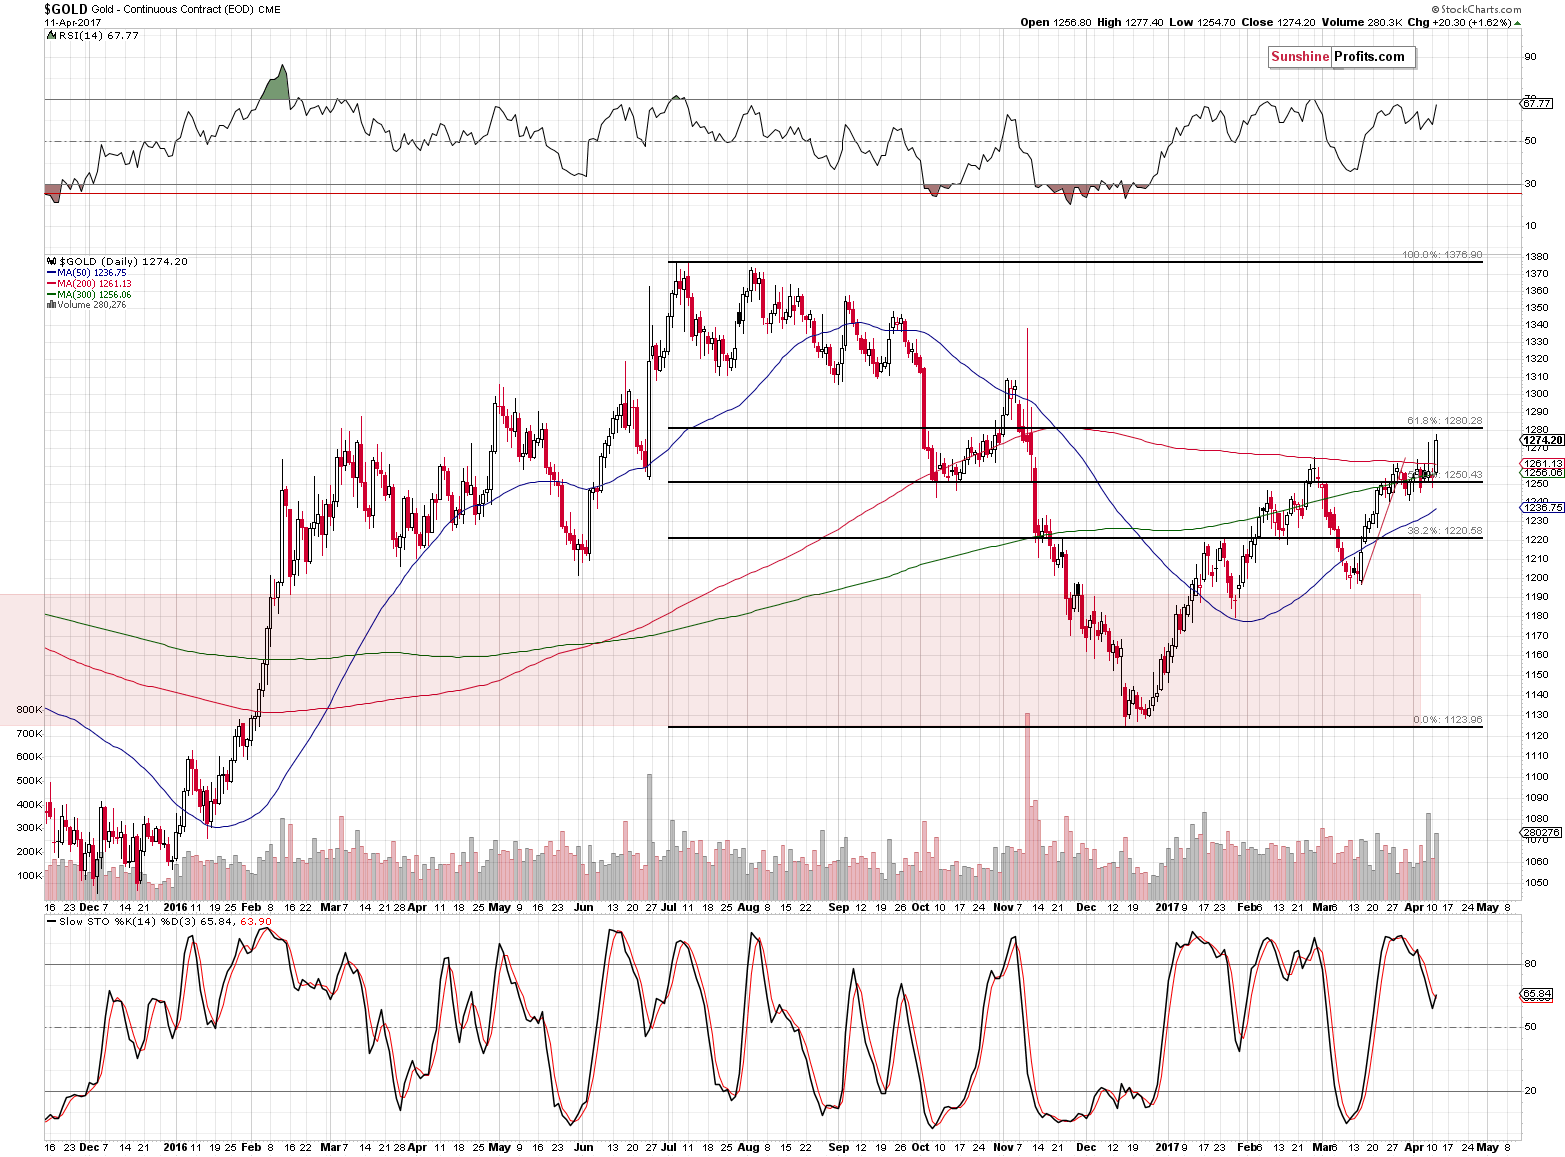
The 61.8% Fibonacci retracement based on the 2016 decline – at about $1,280 would be the target for the rally, which is just around the corner. Now, if it wasn’t for the much improved situation in the USD Index (compared with what we had several weeks / months ago) and other signals with bearish implications for the precious metals market, gold could rally even higher based on the move above the $1,273 level, however, as of today, it seems doubtful.
Neither the events in Syria, nor the weak employment numbers that were reported today negate the major signals that are currently in play.
Yesterday’s fundamental news was not about Syria but about increased tensions between the U.S. and North Korea, but the remaining part of the above quote remains in tune with the current situation – especially the part about the target. The 61.8% Fibonacci retracement level was not broken at all (let alone in a meaningful way), so actually little changed.
The Stochastic indicator shows a tiny buy signal, which is more than negated by the RSI indicator almost at the 70 level – the latter corresponded to important tops on multiple occasions.
The thing that we would like to add today is that there appears to be a self-similar pattern in the price of gold. The entire 2016 rally can be divided into 3 stages with specific endings. First, a sharp rally, a correction that ended at the 50-day moving average. Second, another – bigger - correction that took gold below the 50-day moving average. Third, gold rallied more or less to its most recent high (in mid-June) and just when gold was about to slide, odd news (Brexit) made gold move sharply higher on an intra-day basis (on huge volume, with a reversal before the end of the session). Shortly thereafter gold moved a bit above the previous intra-day high and closed the session above it. That was more or less the final top.
The first stage of the current upswing was seen in the first half of January, then the first correction took place in the second half and the second – bigger – correction took place in early March. Gold moved to the previous high in late March and just when gold was about to slide, odd news (…) made gold move sharply higher on an intra-day basis (on huge volume, with a reversal before the end of the session). Shortly thereafter (yesterday) gold moved a bit above the previous intra-day high and closed the session above it. Naturally, the implications are bearish for the following weeks.
Additionally, according to the True Seasonal tendencies (we’ll discuss more details in the following alerts), April 11 was the local top (gold tends to move higher before this date and decline in the following days), which fits the previous points.
Some may say that gold’s performance relative to the USD indicates higher prices, but this is not necessarily the case.
We previously wrote the following about the above chart:
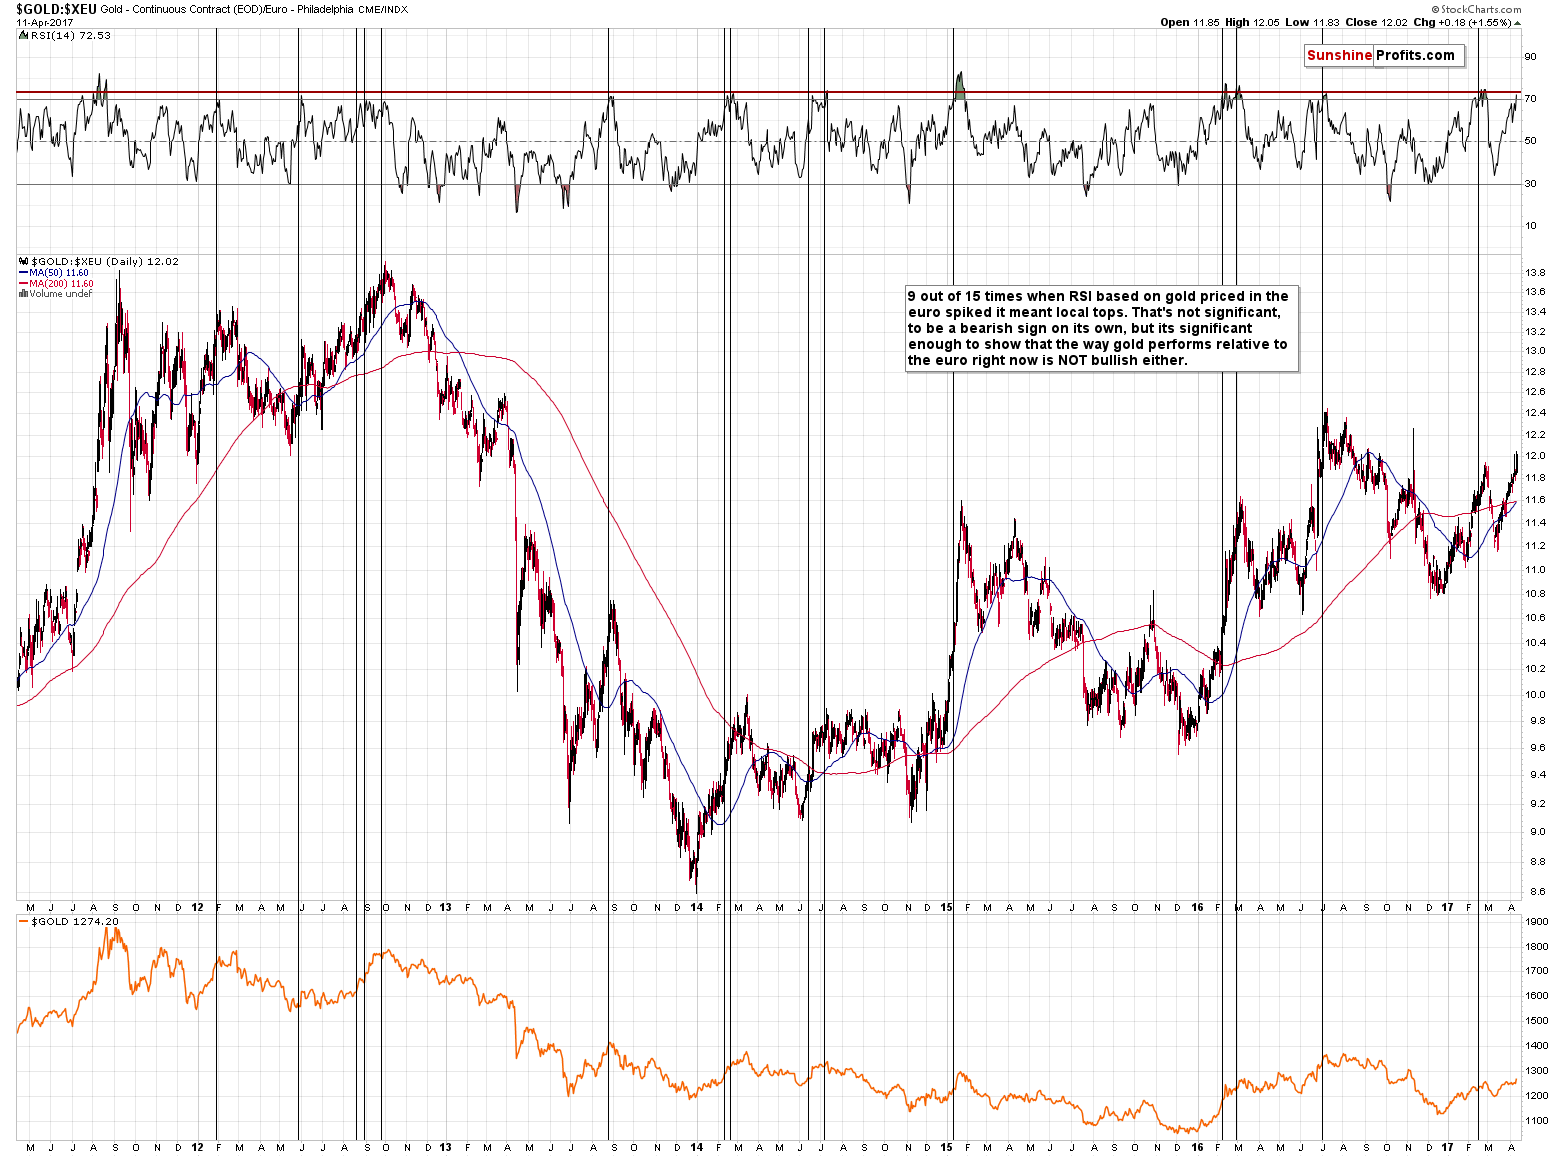
Gold moved higher in terms of the euro in the past few weeks, just like it did in the USD. Unlike the move in the USD Index, however, the move higher in the euro took gold back to the November 2016 highs. This means that gold in terms of the euro has indeed outperformed gold in terms of the USD. Is this something that should make one open long positions in gold?
Not really – while it is true that very short-term outperformance (when gold holds up well despite the USD’s gains) can be viewed as a bullish sign (all other things being equal), bigger (but still, not very big) moves in both directions (gold’s under- and outperformance relative to the U.S. dollar) tend to follow each other. In order to estimate the impact of both changes in the gold price and changes in gold’s strength relative to the USD, we can measure how well gold priced in the euro performs and that’s exactly what the above charts shows. The RSI indicator based on it shows that gold’s upswing and its outperformance have been in place for long enough to push the indicator above 70. This level usually marks overbought levels and indicates an upcoming reversal, but before assuming that this is indeed the case here, let’s check how such a reading performed in the past.
We marked similar cases with black vertical lines. It turns out that a bit more than half of the cases were actually local tops, so the implications should be rather bearish. However, the strength of the signal is too weak to really consider it. Does it mean that it’s worthless? No, it simply tells us something different – not what’s useful, but what isn’t. While gold’s outperformance and rally could be seen as a bullish sign on a short-term basis, the size of both phenomena is still in tune with the past patterns and at this time it indicates declines rather than a continuation of the rally. In other words, gold’s rally and it’s good performance relative to the USD Index is not really a bullish sign at this time.
Naturally, if the USD Index continues to move much higher (say, above 105) and gold still fails to decline, it will likely indicate a change in the gold-USD link and show that higher prices are to be expected. For now, however, it looks like gold’s “strong performance” is rather normal and it moved to levels that are significant enough to indicate a reversal, but not extreme enough to suggest a change in the trend.
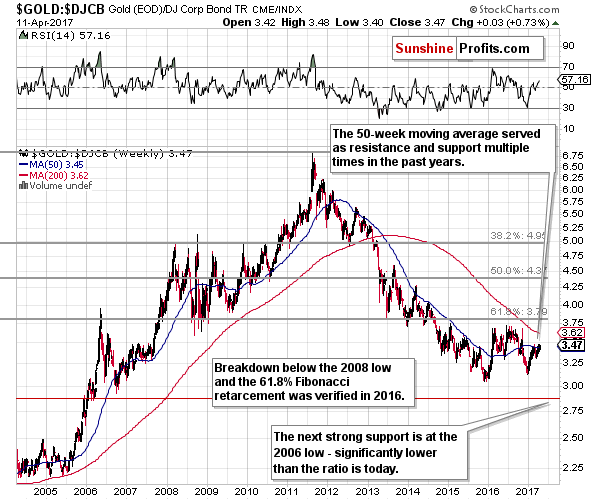
Moreover, the price of gold compared with bonds and the general stock market continue to indicate lower prices in the coming weeks.
Our yesterday’s comments on the above chart remain up-to-date:
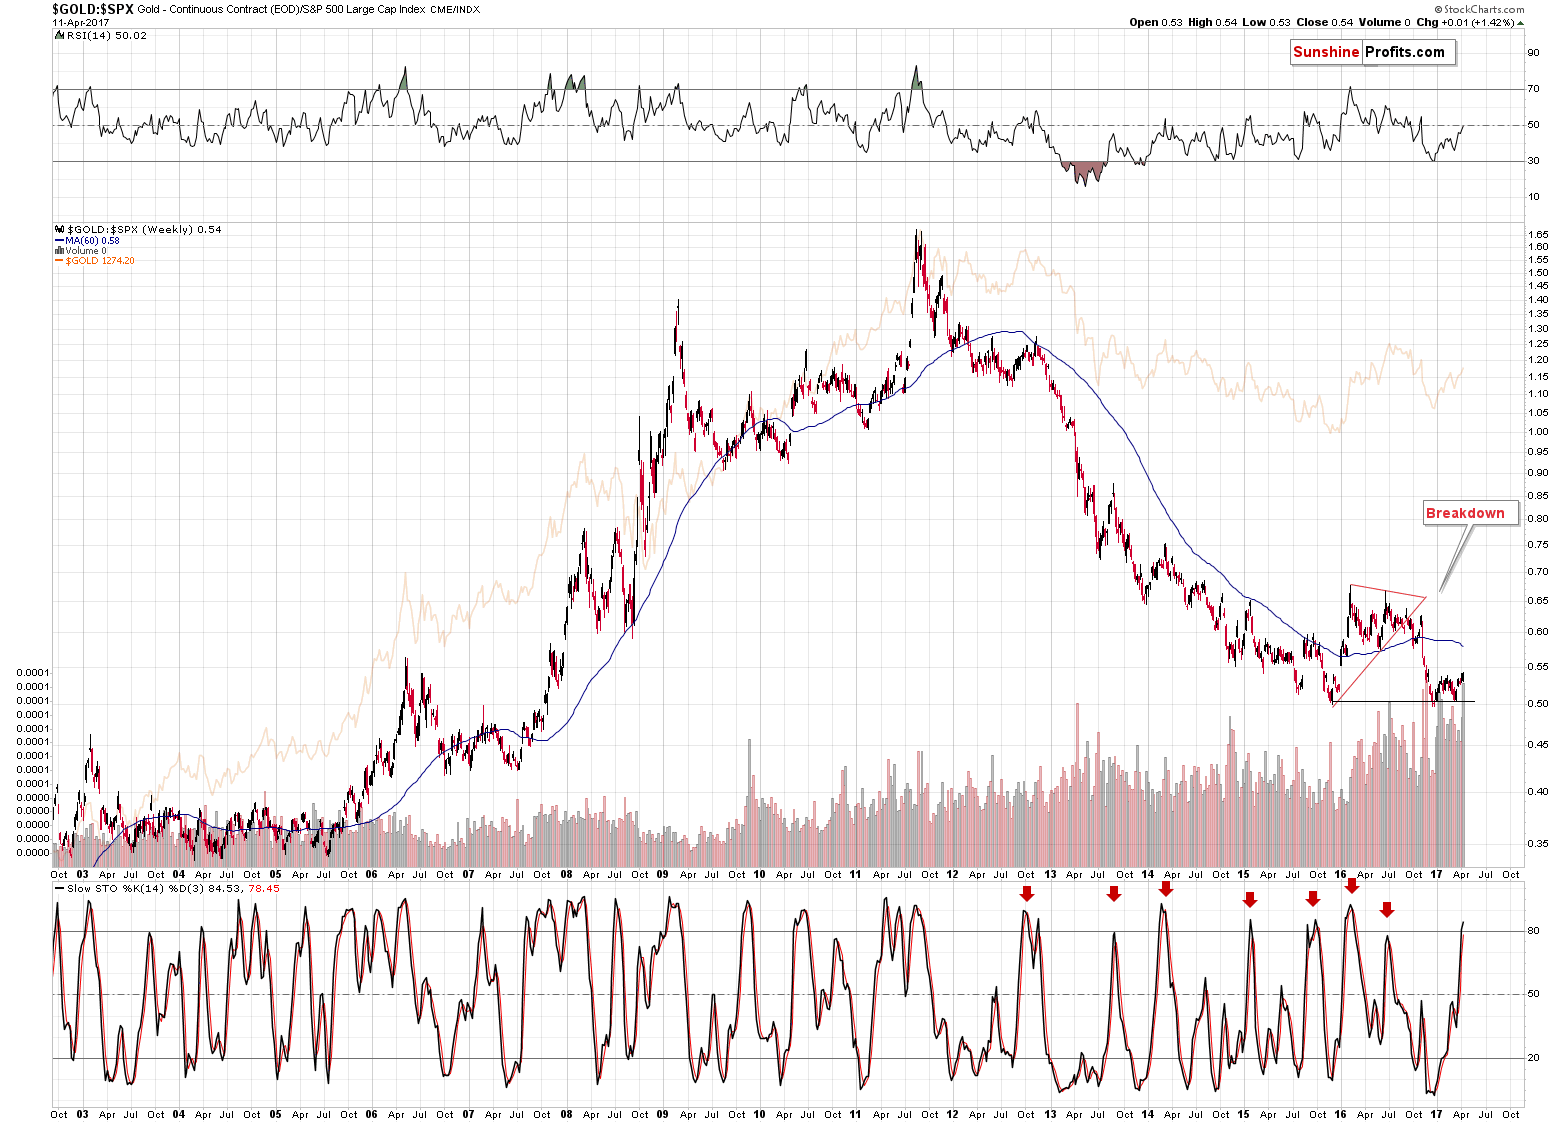
Major tops in the gold to S&P ratio generally corresponded to the major tops in gold and the same goes for the tops in the Stochastic indicator. The important new development on the above chart is that the latter moved above the 80 level and then back below it. Stochastic didn’t move below the red line, thus flashing a classic sell signal, but please note that in the past a move back below 80 level also meant that an important top was likely in. Consequently, the bearish implication are already in place and a move below the red line in Stochastic will serve as a confirmation.
The Dow to gold ratio is once again that the 50-week moving average – something at stopped the rallies multiple times in the past. Once again the implications are bearish for the following weeks.
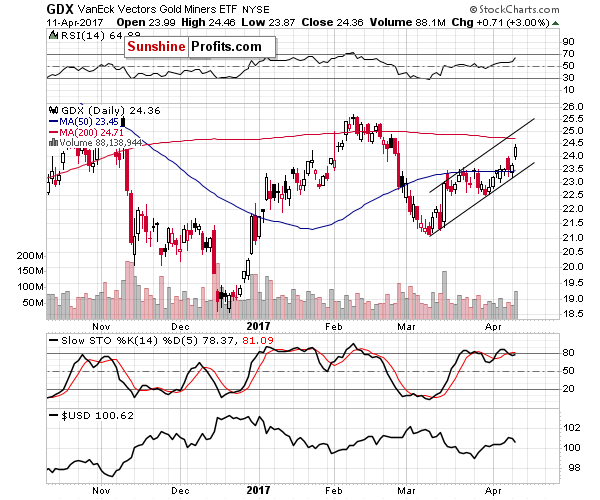
The mining stocks’ rally on strong volume is a bullish sign, especially that it broke above the previous highs, but please note that it is still not confirmed and given yesterday’s cramerization of gold, a confirmation would be very much needed to be a really bullish sign. The 65 reading on the RSI indicator suggests that the short-term rally is not likely to remain in place for much longer anyway, so it doesn’t seem that it will be able to invalidate any of the medium-term points made earlier today – and without that, a much (!) bigger slide is likely to following in the coming weeks anyway.
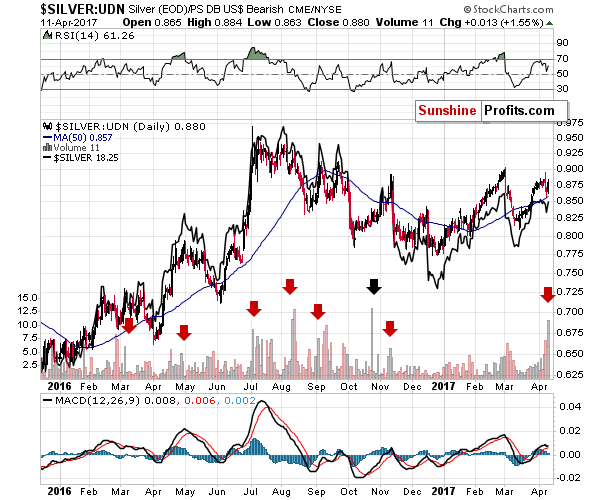
Speaking of short-term signs, we also saw one in case of silver seen from the non-USD perspective. In particular, the size of the volume in the case of silver was many times higher than the volume in the USD ETF (UDN).
What’s so special about it? The fact that in 7 cases out of 8 in the past year, the above meant that a local top was in. This kind of efficiency is quite significant and thus this sign should not be ignored. Why would it work? It’s one of the ways to detect silver’s strong performance which is often driven by the general investment public (which often signals tops).
Summing up, not as much changed as it appears at first sight. In today’s pre-market trading gold almost moved to its 61.8% Fibonacci retracement level (there was no breakout), which could mean that the rally is finally over. There are multiple signs pointing to much lower precious metals prices that remain in place and it doesn’t seem that any of them changed based on yesterday’s price swings.
As always, we will keep you – our subscribers – informed.
To summarize:
Trading capital (supplementary part of the portfolio; our opinion): Short positions (150% of the full position) in gold, silver and mining stocks are justified from the risk/reward perspective with the following stop-loss orders and initial target price levels / profit-take orders:
- Gold: exit-profit-take level: $1,063; stop-loss: $1,294; initial target price for the DGLD ETN: $81.88; stop-loss for the DGLD ETN $45.87
- Silver: initial target price: $13.12; stop-loss: $19.22; initial target price for the DSLV ETN: $46.18; stop-loss for the DSLV ETN $17.93
- Mining stocks (price levels for the GDX ETF): initial target price: $9.34; stop-loss: $26.34; initial target price for the DUST ETF: $143.56; stop-loss for the DUST ETF $21.37
In case one wants to bet on junior mining stocks' prices (we do not suggest doing so – we think senior mining stocks are more predictable in the case of short-term trades – if one wants to do it anyway, we provide the details), here are the stop-loss details and initial target prices:
- GDXJ ETF: initial target price: $14.13; stop-loss: $45.31
- JDST ETF: initial target price: $104.26; stop-loss: $10.78
Long-term capital (core part of the portfolio; our opinion): No positions (in other words: cash)
Insurance capital (core part of the portfolio; our opinion): Full position
Please note that the in the trading section we describe the situation for the day that the alert is posted. In other words, it we are writing about a speculative position, it means that it is up-to-date on the day it was posted. We are also featuring the initial target prices, so that you can decide whether keeping a position on a given day is something that is in tune with your approach (some moves are too small for medium-term traders and some might appear too big for day-traders).
Plus, you might want to read why our stop-loss orders are usually relatively far from the current price.
Please note that a full position doesn’t mean using all of the capital for a given trade. You will find details on our thoughts on gold portfolio structuring in the Key Insights section on our website.
As a reminder – “initial target price” means exactly that – an “initial” one, it’s not a price level at which we suggest closing positions. If this becomes the case (like it did in the previous trade) we will refer to these levels as levels of exit orders (exactly as we’ve done previously). Stop-loss levels, however, are naturally not “initial”, but something that, in our opinion, might be entered as an order.
Since it is impossible to synchronize target prices and stop-loss levels for all the ETFs and ETNs with the main markets that we provide these levels for (gold, silver and mining stocks – the GDX ETF), the stop-loss levels and target prices for other ETNs and ETF (among other: UGLD, DGLD, USLV, DSLV, NUGT, DUST, JNUG, JDST) are provided as supplementary, and not as “final”. This means that if a stop-loss or a target level is reached for any of the “additional instruments” (DGLD for instance), but not for the “main instrument” (gold in this case), we will view positions in both gold and DGLD as still open and the stop-loss for DGLD would have to be moved lower. On the other hand, if gold moves to a stop-loss level but DGLD doesn’t, then we will view both positions (in gold and DGLD) as closed. In other words, since it’s not possible to be 100% certain that each related instrument moves to a given level when the underlying instrument does, we can’t provide levels that would be binding. The levels that we do provide are our best estimate of the levels that will correspond to the levels in the underlying assets, but it will be the underlying assets that one will need to focus on regarding the signs pointing to closing a given position or keeping it open. We might adjust the levels in the “additional instruments” without adjusting the levels in the “main instruments”, which will simply mean that we have improved our estimation of these levels, not that we changed our outlook on the markets. We are already working on a tool that would update these levels on a daily basis for the most popular ETFs, ETNs and individual mining stocks.
Our preferred ways to invest in and to trade gold along with the reasoning can be found in the how to buy gold section. Additionally, our preferred ETFs and ETNs can be found in our Gold & Silver ETF Ranking.
As always, we'll keep you - our subscribers - updated should our views on the market change. We will continue to send out Gold & Silver Trading Alerts on each trading day and we will send additional Alerts whenever appropriate.
The trading position presented above is the netted version of positions based on subjective signals (opinion) from your Editor, and the Tools and Indicators.
As a reminder, Gold & Silver Trading Alerts are posted before or on each trading day (we usually post them before the opening bell, but we don't promise doing that each day). If there's anything urgent, we will send you an additional small alert before posting the main one.
=====
Latest Free Trading Alerts:
On Monday, Yellen gave a talk at the University of Michigan. What does it imply for the gold market?
Yellen’s Talk at the University of Michigan and Gold
=====
Hand-picked precious-metals-related links:
PRECIOUS-Gold hits 5-mth peak as geopolitical tensions drive flight to safety
LBMA PM Gold Price Set $15 Below Spot Market
=====
In other news:
White House accuses Russia of Syria chemical attack 'cover up'
China's Xi urges peaceful resolution of North Korea tension in call with Trump
Global Economic Recovery Is Gaining Momentum, IMF's Lagarde Says
Health Care Reform First Will Pave Way for Tax Reform: Trump Exclusive
Puerto Rico seen sliding toward bankruptcy as deadline nears
Bitcoin value rises over $1 billion as Japan, Russia move to legitimize cryptocurrency
=====
Thank you.
Sincerely,
Przemyslaw Radomski, CFA
Founder, Editor-in-chief, Gold & Silver Fund Manager
Gold & Silver Trading Alerts
Forex Trading Alerts
Oil Investment Updates
Oil Trading Alerts

