

Briefly: In our opinion, full (150% of the regular full position) speculative short positions in gold, silver and mining stocks are justified from the risk/reward perspective. This position was originally featured on Jan. 12, 2017 at 3:49PM.
Several things happened on Friday and the markets reacted to them, so it’s not easy to interpret the final outcome. Was the reversal bearish or was the session bullish as gold didn’t decline substantially even though the USD rallied? Was gold’s reaction adequate, too small or too big?
Let’s start the discussion with a reminder of one of the reasons for Friday’s pre-market rally. In Friday’s alert, we wrote the following:
The likely direct reason behind today’s overnight spike in the price of gold is a cruise missile strike at a Syrian airbase, most likely the one from which a deadly chemical weapons attack had been launched earlier this week. However, it's not likely that 59 Tomahawk missiles was enough to ignite a rally alone. The strike had damaged ties between Washington and Moscow, as Russian spokesman Dmitry Peskov described the U.S. action as "aggression against a sovereign nation" on a "made-up pretext"
We have already mentioned that news-based rallies are likely to be temporary – today let’s focus on the temporary impact that the above was likely to have – it was likely to boost prices of assets that are viewed as safe havens – gold and… the U.S. dollar. Both are being viewed as safe bets and thus it’s no wonder that we saw a temporary increase in prices of both assets. Consequently, the fact that gold didn’t decline is not a reflection of gold’s true strength vs. the US dollar and thus it shouldn’t be viewed as a bullish sign.
The important thing is that whereas the USD rallied further during the session, gold and silver reversed and erased (or more than erased in the case of silver) the entire daily rally before the end of the session. So, even though the initial safe-haven reaction was quite natural, it was also the case that the news-based rally was temporary – it didn’t even take one trading day for the move in precious metals to be reversed.
All in all, it appears that the reversals are the thing to keep in mind, while gold’s supposed strength vs. the USD is not. Let’s take a look at gold’s chart (charts courtesy of http://stockcharts.com).
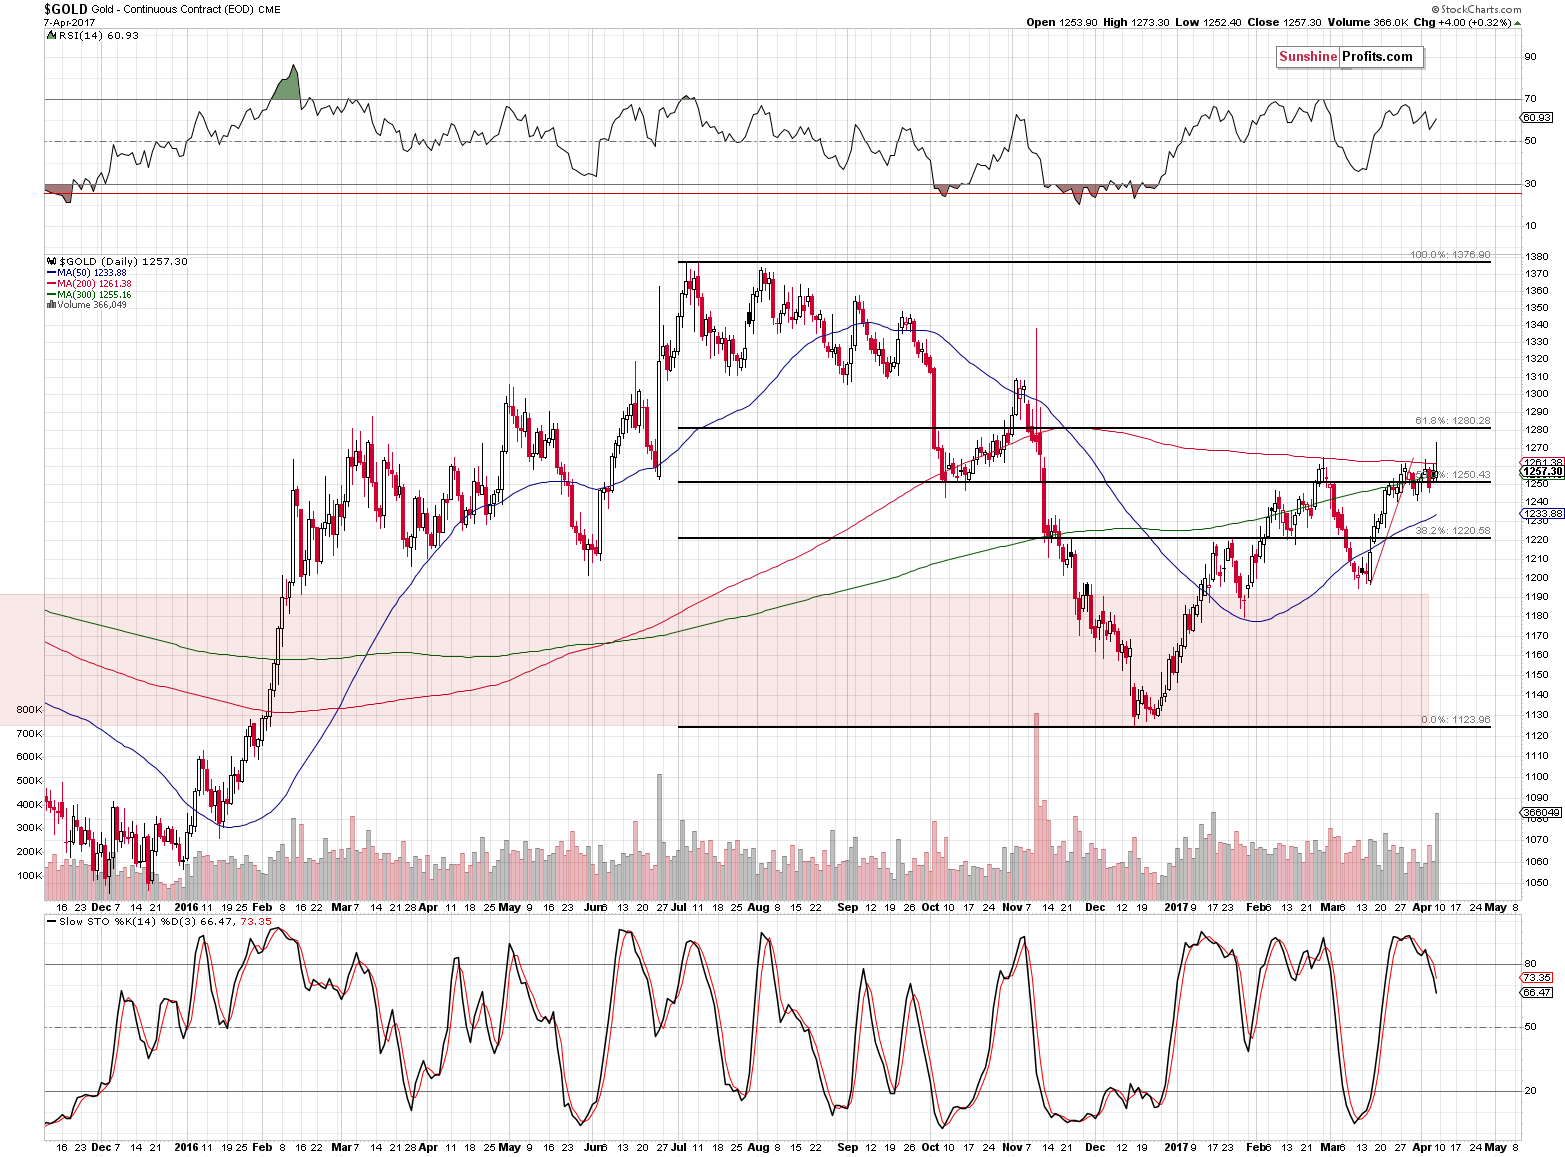
Gold’s reversal was not only sizable, it was also accompanied by huge volume – this is a classic, reliable reversal pattern. Needless to say, the implications are bearish. Moreover, please note that the sell signal from the Stochastic indicator remains in place.
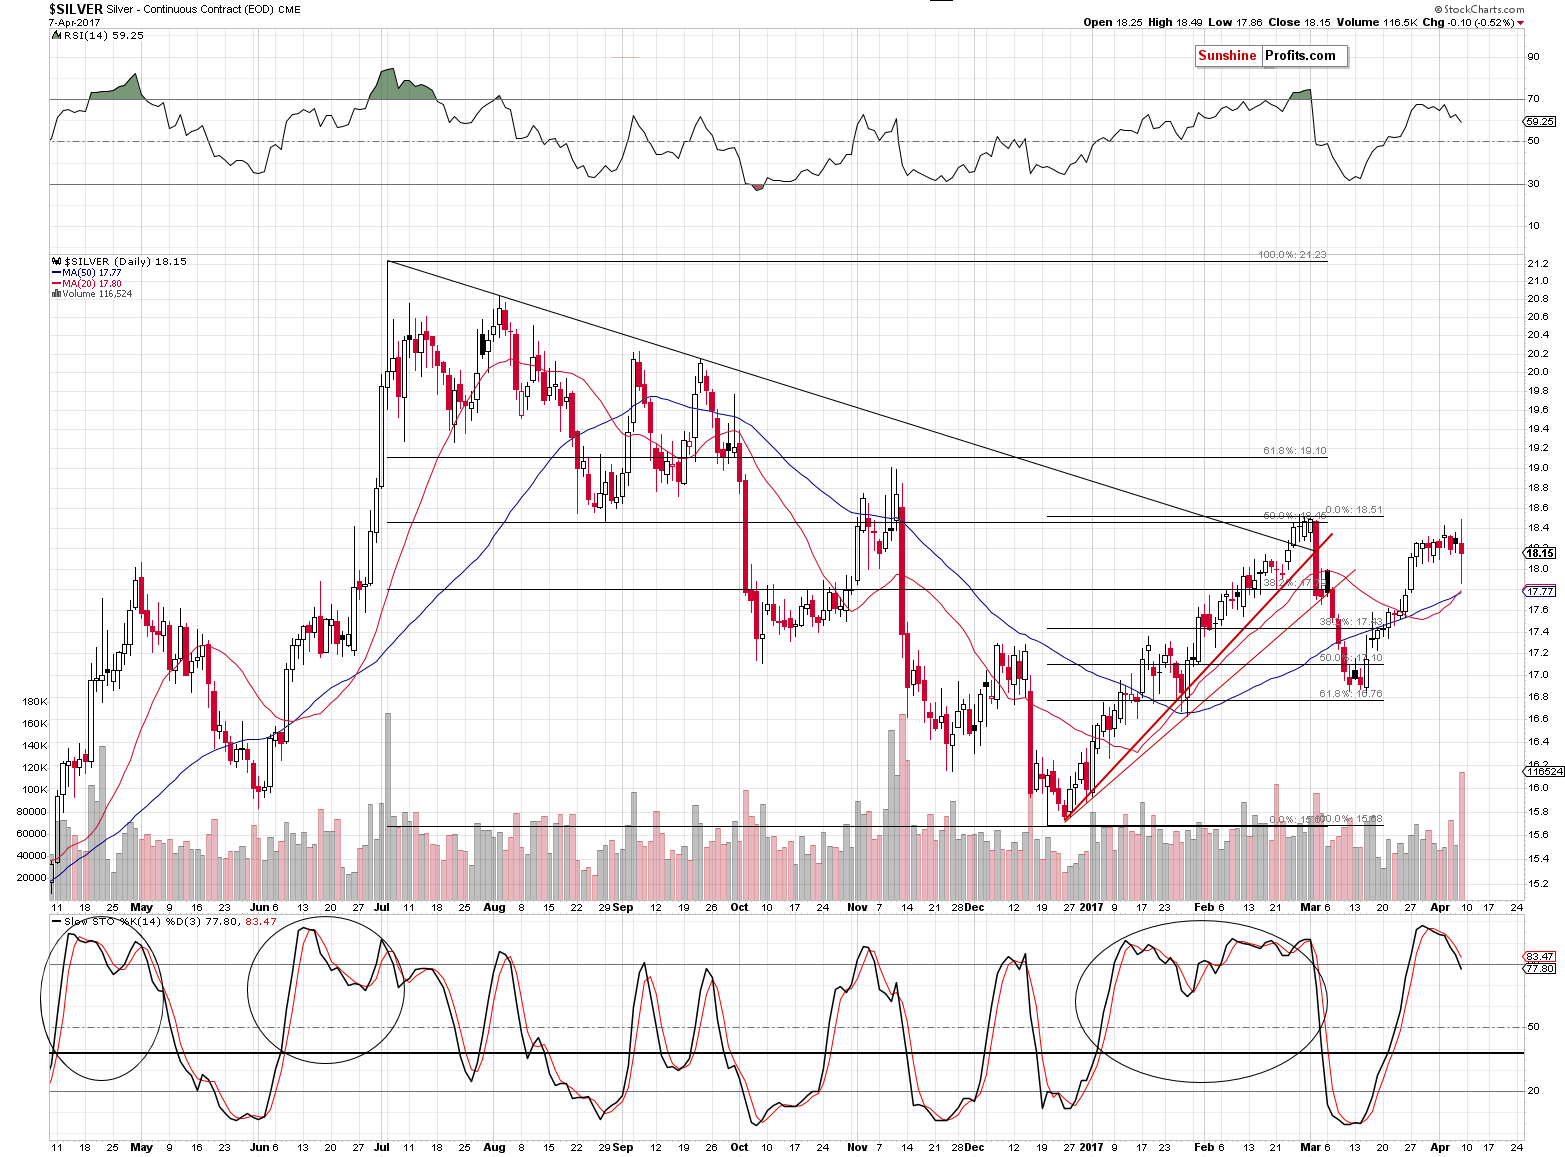
Not only is the reversal in gold significant by itself – it’s also confirmed by analogous action in silver. In fact, silver declined even more than gold (having closed below $18, which is not visible on the above chart) and it’s currently at $17.90. The implications are bearish.
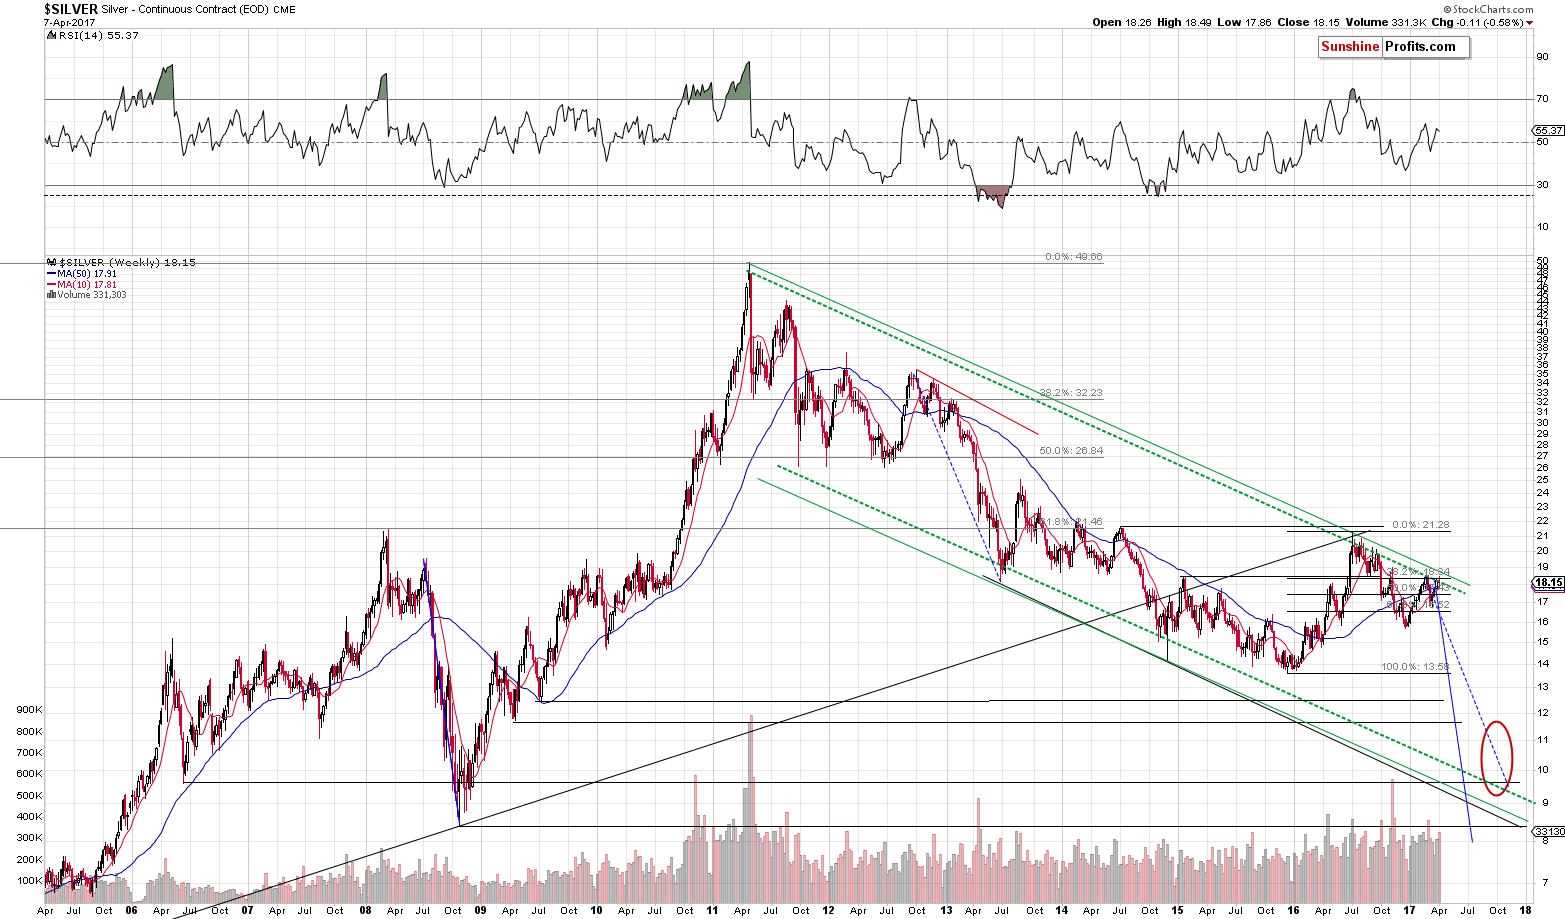
Last week, we wrote the following about silver’s long-term chart:
There are a few things that decide whether a resistance line is strong or not. The more important the tops that it’s based on, the more important the resistance line. The more tops create a given line, the more important the resistance is. Finally, for the line to be very important, the space between the tops that create it should be rather significant (for instance the red line based on 2 late-2012 tops didn’t result in anything in the following months and years).
Moreover, the way a given resistance line is likely to work is based on what created a given line. Therefore, a resistance line based on intra-day tops is likely to stop intra-day moves, a line based on daily closes is likely to stop the moves in terms of daily closing prices (so that the closing price doesn’t break the line even though intra-day moves might) and the line based on weekly closes is likely to stop the moves in terms of weekly closing prices (in analogy to daily closing prices).
After the rather lengthy introduction, let’s move to the point. Silver just moved to the line that is very important (green dashed line based on one extremely important top, one very important top and one less important top) and it did so in terms that were in tune with what the line was based on – silver closed the week at the line that was based on weekly closing prices.
The implications are naturally bearish for the following weeks and months as the above means that even if silver moves a bit higher temporarily, it’s unlikely to move higher substantially or for long. The above alone suggests that we are in the “pennies to the upside and dollars to the downside” territory without considering anything else (including the USD Index). The situation would be different if the silver had broken above this line and confirmed this breakout – but it didn’t, so the implications of moving to it are clearly bearish.
So, a reversal is very likely to occur shortly, if it didn’t occur on Friday.
Silver moved higher very temporarily, reversed before the end of the week and overall it declined last week. The mentioned long-term resistance line seems to have stopped the rally.
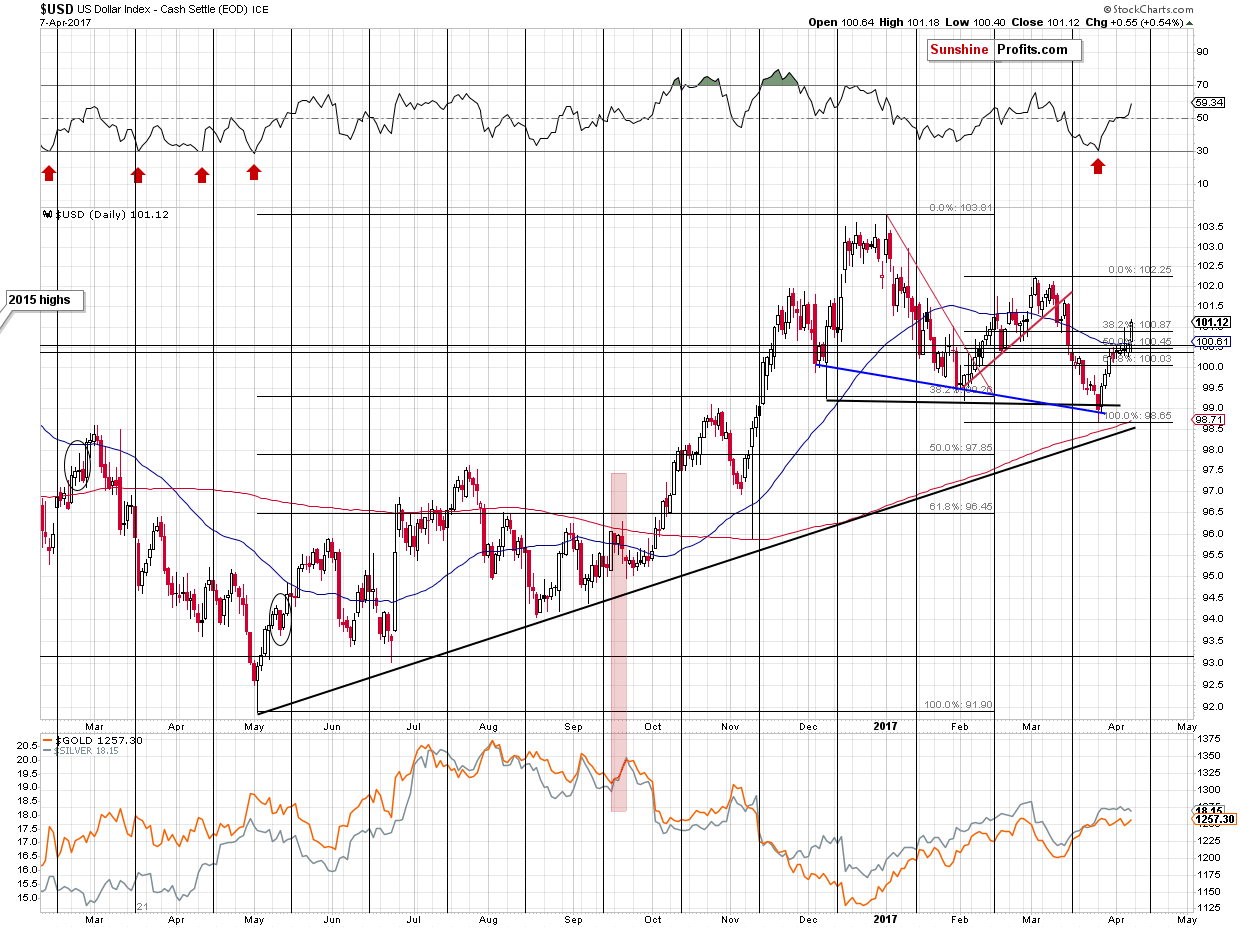
Moving back to the USD Index, the thing that we would like to emphasize today is the fact that it moved and closed the week above the 61.8% Fibonacci retracement based on the March decline. The implication is that the most recent rally is not just a correction within a decline, but a part of a bigger rally – a one that’s bigger than most people expect.
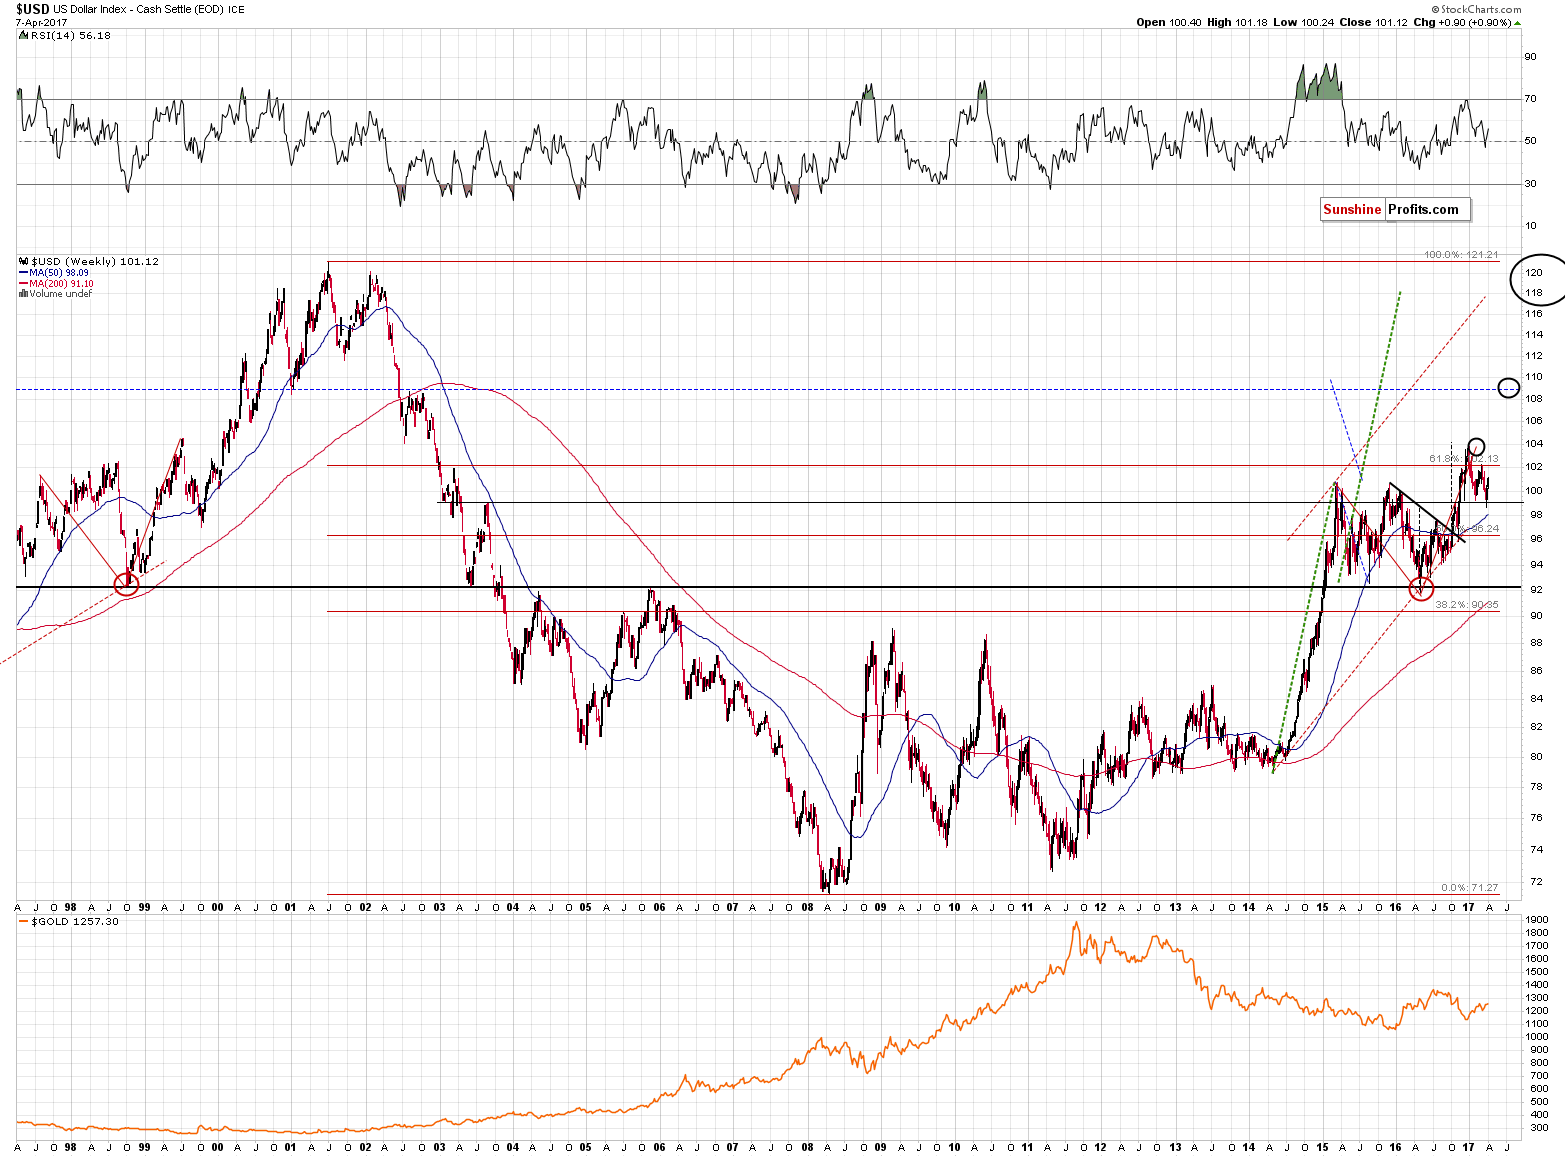
The reflective nature of the current rally (and its comparison to the 2002 – 2003 decline) clearly remains in place. The final correction appears to be behind us and just as there was no significant pause during the late 2002 – early 2003 slide, we don’t expect to see any significant pauses or additional significant corrections during the current rally. The next major target is the 108 – 110 area and since the major moves in the USD and gold are likely to correspond to each other, the above is likely to translate into a major slide in gold.
Summing up, Friday’s pre-market upswing in the precious metals sector appears to have been just a temporary news-based move that was already invalidated. The resulting reversals are very bearish developments especially that they were seen in both: gold and silver.
On Friday, we wrote that neither the events in Syria, nor the weak employment numbers that were reported negated the major signals that are currently in play. Several hours later the technical picture (the reversals) started to reflect that. The multiple additional signs pointing to much lower precious metals prices remain in place and Friday’s reversals serve as a short-term confirmation.
As always, we will keep you – our subscribers – informed.
To summarize:
Trading capital (supplementary part of the portfolio; our opinion): Short positions (150% of the full position) in gold, silver and mining stocks are justified from the risk/reward perspective with the following stop-loss orders and initial target price levels / profit-take orders:
- Gold: exit-profit-take level: $1,063; stop-loss: $1,294; initial target price for the DGLD ETN: $81.88; stop-loss for the DGLD ETN $45.87
- Silver: initial target price: $13.12; stop-loss: $19.22; initial target price for the DSLV ETN: $46.18; stop-loss for the DSLV ETN $17.93
- Mining stocks (price levels for the GDX ETF): initial target price: $9.34; stop-loss: $26.34; initial target price for the DUST ETF: $143.56; stop-loss for the DUST ETF $21.37
In case one wants to bet on junior mining stocks' prices (we do not suggest doing so – we think senior mining stocks are more predictable in the case of short-term trades – if one wants to do it anyway, we provide the details), here are the stop-loss details and initial target prices:
- GDXJ ETF: initial target price: $14.13; stop-loss: $45.31
- JDST ETF: initial target price: $104.26; stop-loss: $10.78
Long-term capital (core part of the portfolio; our opinion): No positions (in other words: cash)
Insurance capital (core part of the portfolio; our opinion): Full position
Please note that the in the trading section we describe the situation for the day that the alert is posted. In other words, it we are writing about a speculative position, it means that it is up-to-date on the day it was posted. We are also featuring the initial target prices, so that you can decide whether keeping a position on a given day is something that is in tune with your approach (some moves are too small for medium-term traders and some might appear too big for day-traders).
Plus, you might want to read why our stop-loss orders are usually relatively far from the current price.
Please note that a full position doesn’t mean using all of the capital for a given trade. You will find details on our thoughts on gold portfolio structuring in the Key Insights section on our website.
As a reminder – “initial target price” means exactly that – an “initial” one, it’s not a price level at which we suggest closing positions. If this becomes the case (like it did in the previous trade) we will refer to these levels as levels of exit orders (exactly as we’ve done previously). Stop-loss levels, however, are naturally not “initial”, but something that, in our opinion, might be entered as an order.
Since it is impossible to synchronize target prices and stop-loss levels for all the ETFs and ETNs with the main markets that we provide these levels for (gold, silver and mining stocks – the GDX ETF), the stop-loss levels and target prices for other ETNs and ETF (among other: UGLD, DGLD, USLV, DSLV, NUGT, DUST, JNUG, JDST) are provided as supplementary, and not as “final”. This means that if a stop-loss or a target level is reached for any of the “additional instruments” (DGLD for instance), but not for the “main instrument” (gold in this case), we will view positions in both gold and DGLD as still open and the stop-loss for DGLD would have to be moved lower. On the other hand, if gold moves to a stop-loss level but DGLD doesn’t, then we will view both positions (in gold and DGLD) as closed. In other words, since it’s not possible to be 100% certain that each related instrument moves to a given level when the underlying instrument does, we can’t provide levels that would be binding. The levels that we do provide are our best estimate of the levels that will correspond to the levels in the underlying assets, but it will be the underlying assets that one will need to focus on regarding the signs pointing to closing a given position or keeping it open. We might adjust the levels in the “additional instruments” without adjusting the levels in the “main instruments”, which will simply mean that we have improved our estimation of these levels, not that we changed our outlook on the markets. We are already working on a tool that would update these levels on a daily basis for the most popular ETFs, ETNs and individual mining stocks.
Our preferred ways to invest in and to trade gold along with the reasoning can be found in the how to buy gold section. Additionally, our preferred ETFs and ETNs can be found in our Gold & Silver ETF Ranking.
As always, we'll keep you - our subscribers - updated should our views on the market change. We will continue to send out Gold & Silver Trading Alerts on each trading day and we will send additional Alerts whenever appropriate.
The trading position presented above is the netted version of positions based on subjective signals (opinion) from your Editor, and the Tools and Indicators.
As a reminder, Gold & Silver Trading Alerts are posted before or on each trading day (we usually post them before the opening bell, but we don't promise doing that each day). If there's anything urgent, we will send you an additional small alert before posting the main one.
=====
Latest Free Trading Alerts:
The U.S. economy added only 98,000 jobs in March. What does it mean for the gold market?
S&P 500 index lost 0.1% on Friday, following worse-than-expected monthly jobs data announcement. Will the uptrend resume? Or is this just flat correction before another leg lower? Is holding short position still justified?
Stock Trading Alert: Still No Clear Short-Term Direction - Will Uptrend Continue?
=====
Hand-picked precious-metals-related links:
LAWRIE WILLIAMS: Chinese CB reports zero addition to gold reserves in March – back to its bad o...
DGCX opens Chinese bullion market with the historic launch of Shanghai Gold Futures
Shares of Barrick Gold could rise 30 percent: Barron's
=====
In other news:
U.S. Fed could end reinvestment policy this year: Fed's Bullard
Dollar at three-week highs, though Syria, North Korea concerns temper gains
What you need to know for the week ahead
US Dollar May Rise on Yellen Speech Unless G7 Dents Risk Appetite
US gas prices rise 9 cents over 2 weeks, to $2.43 a gallon
A Foreign Threat to U.S. Treasuries That Dwarfs Fed's Debt Hoard
Bank of Japan's Kuroda repeats resolve to maintain massive stimulus
French Election Becomes a Four-Way Race as Melenchon Surges
=====
Thank you.
Sincerely,
Przemyslaw Radomski, CFA
Founder, Editor-in-chief, Gold & Silver Fund Manager
Gold & Silver Trading Alerts
Forex Trading Alerts
Oil Investment Updates
Oil Trading Alerts

