

Briefly: In our opinion, full (150% of the regular full position) speculative short positions in gold, silver and mining stocks are justified from the risk/reward perspective. This position was originally featured on Jan. 12, 2017 at 3:49PM.
The USD Index broke down below its rising support line on Friday in a quite profound way and the mining stocks reacted by rallying strongly. Is the decline over?
In short, the decline is probably not over and we are likely already halfway (or completely) done with the corrective upswing. In order to better understand the situation in precious metals, it is a good idea to look at what’s happening with one of the main drivers of precious metals prices – the USD Index. Let’s start today’s analysis by looking at its chart (charts courtesy of http://stockcharts.com).
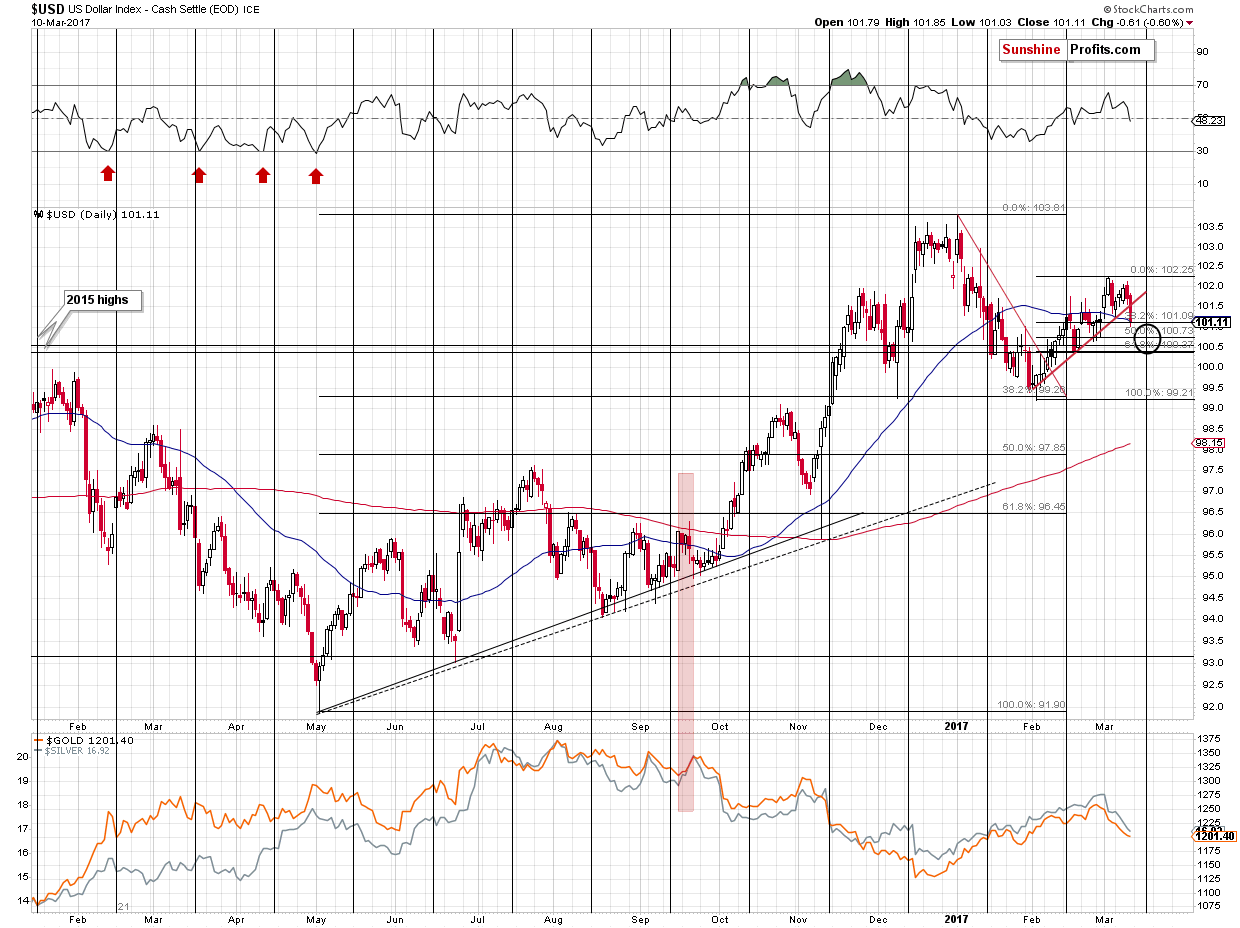
One of the bigger factors at this time is the current (alleged) head-and-shoulder pattern in the USD Index (the late December 2016 top being the head and the November top and the current being the shoulders) and in particular, its similarity to the previous (fake) head-and-shoulders pattern (the July 2016 top being the head and May 2016 and August-September tops being the shoulders).
Why “alleged” and “fake”? Because in both cases, the patterns were not completed and yet it appeared that they would be completed “shortly”. The head-and-shoulders patterns in the USD Index are quite often misleading (and as Nadia Simmons says regarding these patterns in case of USD Index’s biggest component – the EUR/USD pair – are anti-reliable as so many of them have the effect that is opposite to the expected one) and thus we can actually expect a rally in the following weeks instead of a decline – just like what we saw in October 2016 and the following months.
Both patterns are quite similar in terms of size and (to a smaller degree, but still) shape, so we could expect some similarity in the follow-up action as well. Back in September 2016, the second decline was visibly smaller than the previous one – it corrected about half of the previous short-term upswing. Applying this analogy to the current situation, gives us 100.73 as the downside target. Since the USD Index already moved to 101, it could be the case that the bottom was almost reached.
Still, other Fibonacci retracements (38.2% and 61.8%) are also useful in case of the USD Index (as well as the EUR/USD pair) and therefore 101.09 and 100.37 also serve as target levels. Moreover, the 100.5 level is particularly important as that’s what (approximately) stopped both major rallies of 2015.
All in all, it appears that the bottom in the USD Index is at hand, or perhaps already in. Why is that is important?
It is important for the USD Index, because (mostly based on the long-term chart but also due to the mentioned head-and-shoulders self-similarity) the rally that is likely to follow is probably going to be huge. A repeat of the late-2016 rally would take the USD Index to the 109 – 110 area, which is well above the current levels.
It is important for the precious metals market, because the late-2016 rally in the USD Index corresponded to a big decline in the metals. Gold declined over $200. We actually expect a decline that’s even bigger, but the above analogy is enough to indicate that the likely follow-up slide is probably going to be huge.
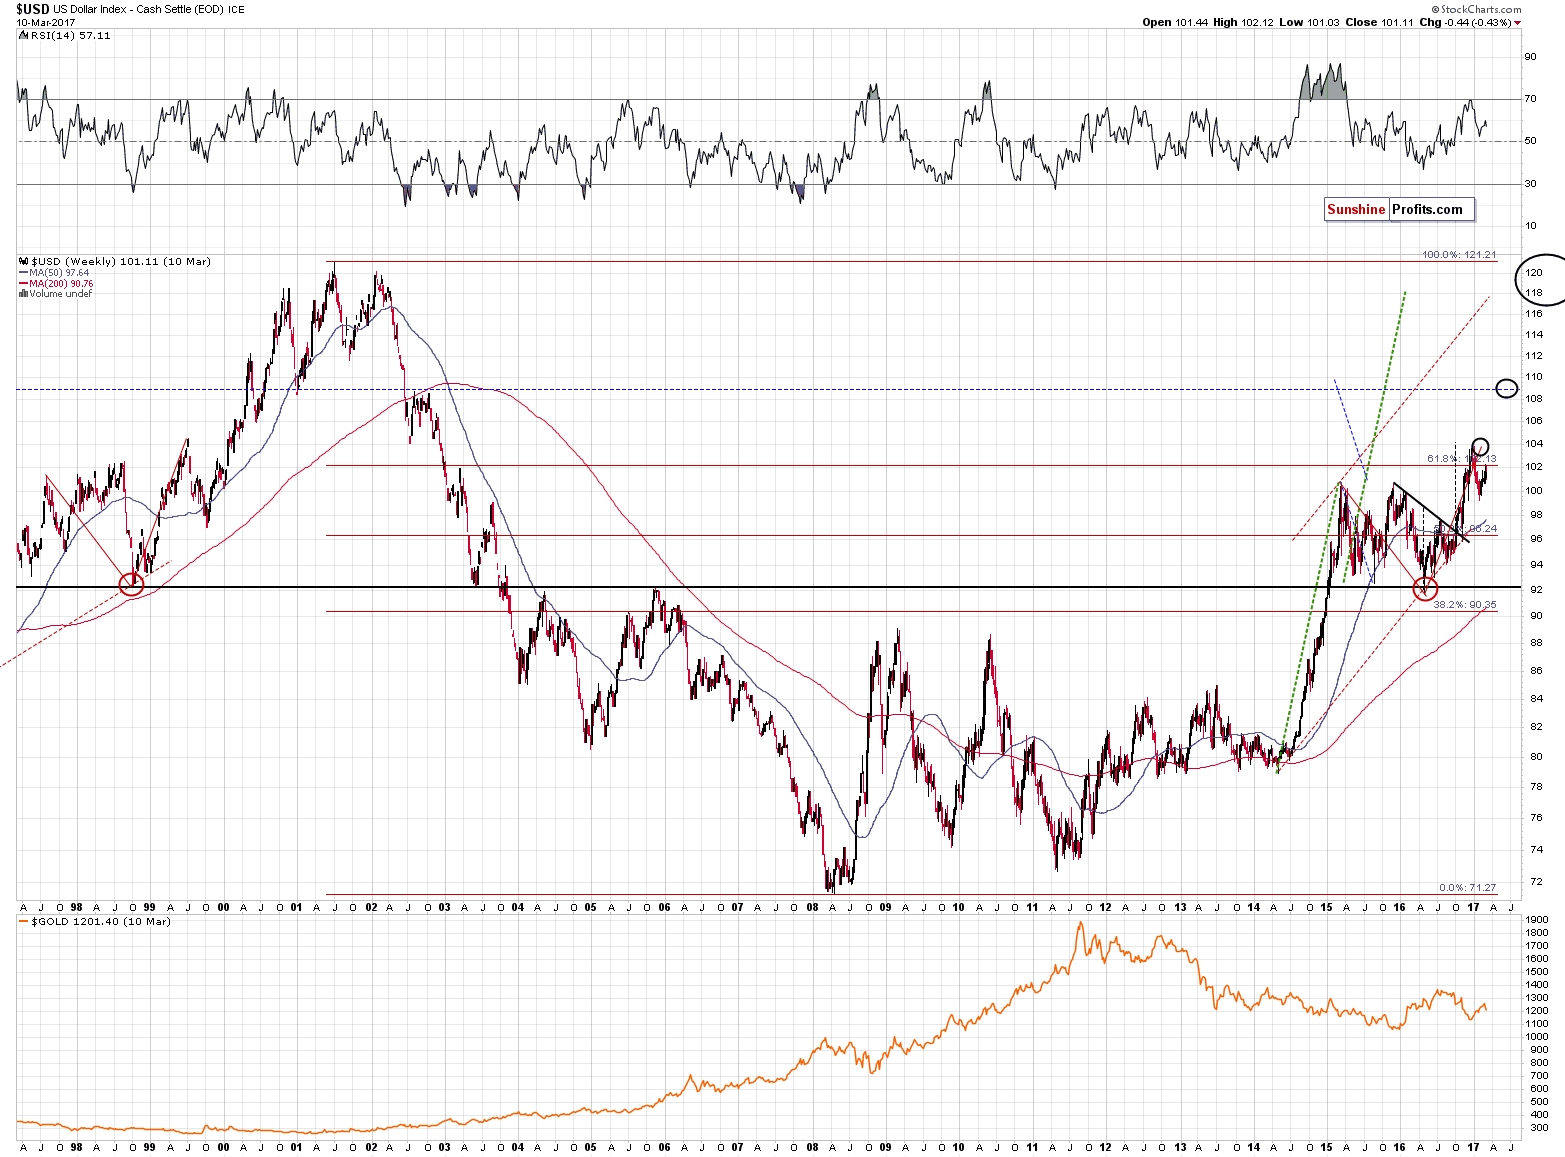
As mentioned above, the long-term USD Index chart favors a strong rally here due to the reflective nature of the current rally (the 2009 bottom being the center of symmetry).
The situation in the USD Index strongly favors keeping the short positions intact.
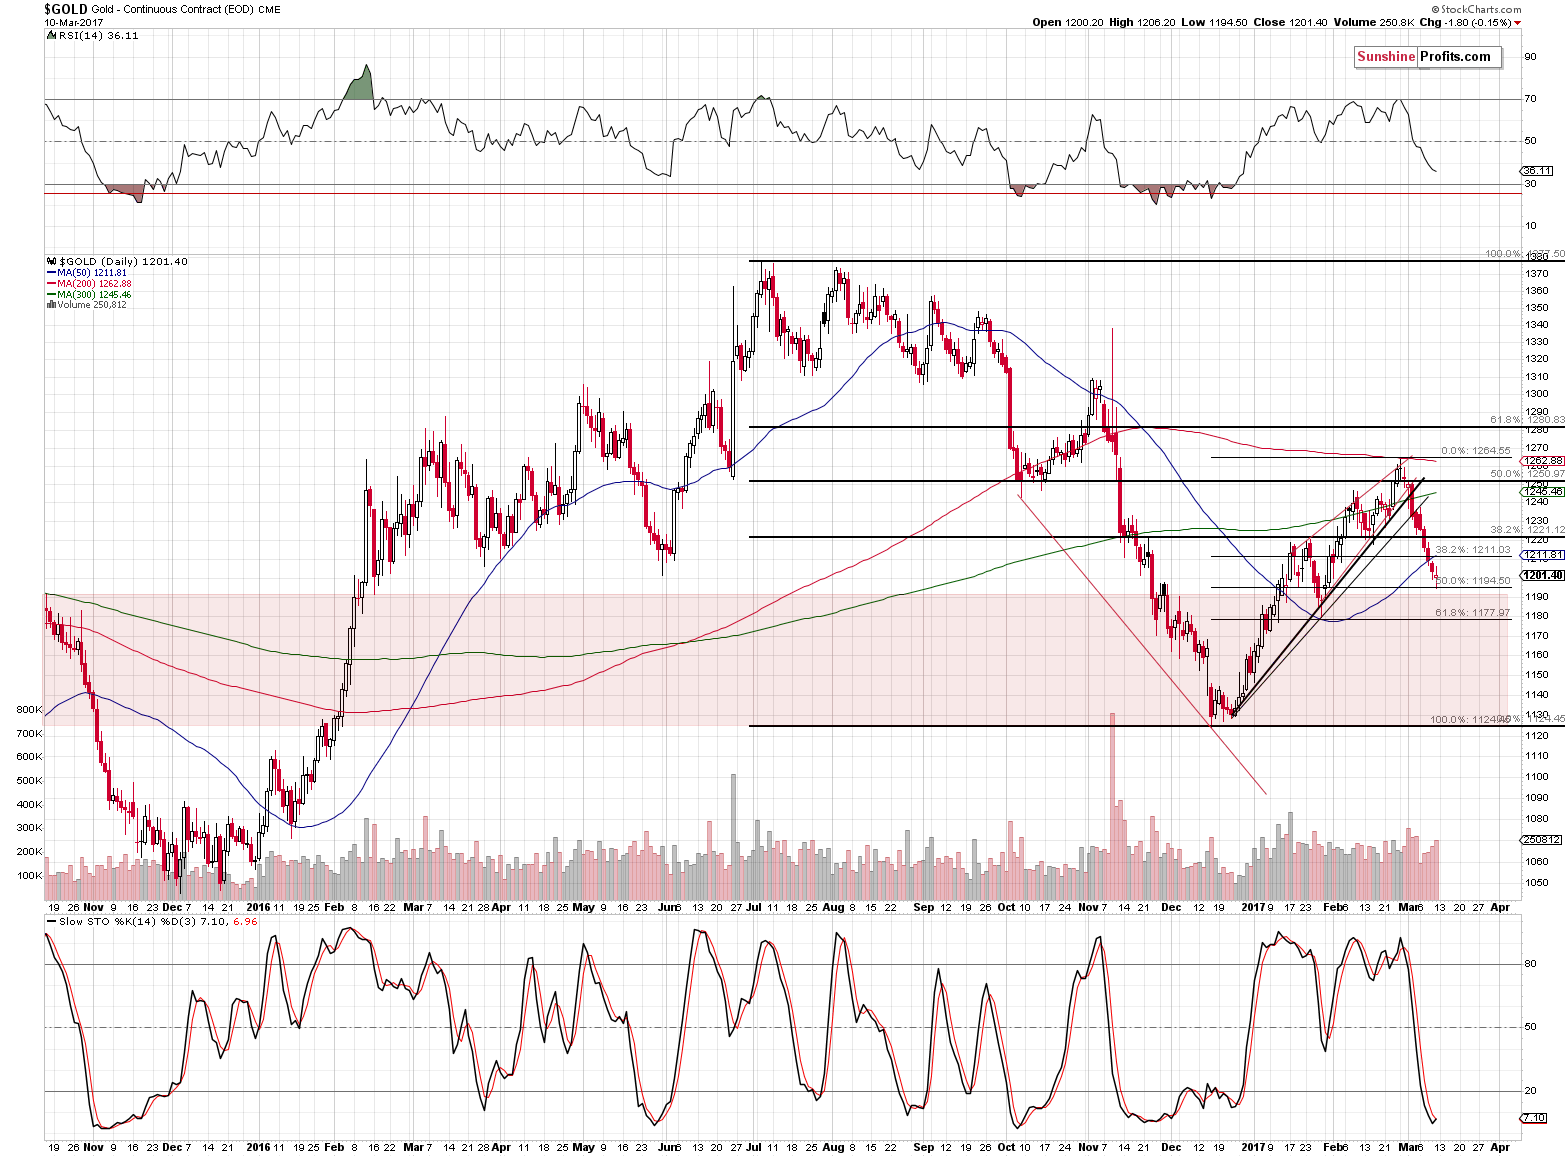
What about gold itself? The USD Index declined substantially on Friday and gold barely reacted. At the moment of writing these words, gold is trading at $1,204 (after a brief upswing to $1,211). If the decline in the USD Index is halfway or entirely done, then – especially given this kind of reaction in gold – we can expect only a small (or none at all) rally in gold. Is it therefore justified to exit the current short positions in the precious metals sector? It doesn’t seem so, especially that gold is just above the area (marked in red), where it doesn’t have any strong support (except for the 61.8% Fibonacci retracement) and through which it is likely to slide rather quickly (all the way down to $1,130 or so).
The situation in the silver market is very similar to the one in gold and as far as mining stocks are concerned, they showed strength on Friday by rallying visibly, but in light of the situation to the the USD Index and given gold’s (lack of) reaction on USD’s movement, it doesn’t seem this strength changes much. If the rally in GDX and other mining stock indices repeats itself (given the possibility of a repeat of Friday’s decline in the USD Index), then the additional rally is still not significant enough to adjust the positions in our view. The move lower (USD) and higher (miners) could be very temporary and one could not be able to get back into the short position at better prices if they chose to temporarily exit it. That’s something that day-traders may want to consider, but we are not adjusting our positions – at least not based on what we are seeing right now.
Summing up, it appears that the potential size of the decline in the USD Index and rally in metals is very limited and that the medium-term trends will resume shortly. We could see a slightly more meaningful rally in the mining stocks (a repeat of Friday’s rally), but it doesn’t seem that this would be anything more than a brief correction. It appears that speculative short positions remain justified from the risk to reward point of view.
As always, we will keep you – our subscribers – informed.
To summarize:
Trading capital (supplementary part of the portfolio; our opinion): Short positions (150% of the full position) in gold, silver and mining stocks are justified from the risk/reward perspective with the following stop-loss orders and initial target price levels / profit-take orders:
- Gold: exit-profit-take level: $1,063; stop-loss: $1,273; initial target price for the DGLD ETN: $81.88; stop-loss for the DGLD ETN $48.17
- Silver: initial target price: $13.12; stop-loss: $18.67; initial target price for the DSLV ETN: $46.18; stop-loss for the DSLV ETN $19.87
- Mining stocks (price levels for the GDX ETF): initial target price: $9.34; stop-loss: $26.34; initial target price for the DUST ETF: $143.56; stop-loss for the DUST ETF $21.37
In case one wants to bet on junior mining stocks' prices (we do not suggest doing so – we think senior mining stocks are more predictable in the case of short-term trades – if one wants to do it anyway, we provide the details), here are the stop-loss details and initial target prices:
- GDXJ ETF: initial target price: $14.13; stop-loss: $45.31
- JDST ETF: initial target price: $104.26; stop-loss: $10.78
Long-term capital (core part of the portfolio; our opinion): No positions (in other words: cash)
Insurance capital (core part of the portfolio; our opinion): Full position
Please note that the in the trading section we describe the situation for the day that the alert is posted. In other words, it we are writing about a speculative position, it means that it is up-to-date on the day it was posted. We are also featuring the initial target prices, so that you can decide whether keeping a position on a given day is something that is in tune with your approach (some moves are too small for medium-term traders and some might appear too big for day-traders).
Plus, you might want to read why our stop-loss orders are usually relatively far from the current price.
Please note that a full position doesn’t mean using all of the capital for a given trade. You will find details on our thoughts on gold portfolio structuring in the Key Insights section on our website.
As a reminder – “initial target price” means exactly that – an “initial” one, it’s not a price level at which we suggest closing positions. If this becomes the case (like it did in the previous trade) we will refer to these levels as levels of exit orders (exactly as we’ve done previously). Stop-loss levels, however, are naturally not “initial”, but something that, in our opinion, might be entered as an order.
Since it is impossible to synchronize target prices and stop-loss levels for all the ETFs and ETNs with the main markets that we provide these levels for (gold, silver and mining stocks – the GDX ETF), the stop-loss levels and target prices for other ETNs and ETF (among other: UGLD, DGLD, USLV, DSLV, NUGT, DUST, JNUG, JDST) are provided as supplementary, and not as “final”. This means that if a stop-loss or a target level is reached for any of the “additional instruments” (DGLD for instance), but not for the “main instrument” (gold in this case), we will view positions in both gold and DGLD as still open and the stop-loss for DGLD would have to be moved lower. On the other hand, if gold moves to a stop-loss level but DGLD doesn’t, then we will view both positions (in gold and DGLD) as closed. In other words, since it’s not possible to be 100% certain that each related instrument moves to a given level when the underlying instrument does, we can’t provide levels that would be binding. The levels that we do provide are our best estimate of the levels that will correspond to the levels in the underlying assets, but it will be the underlying assets that one will need to focus on regarding the signs pointing to closing a given position or keeping it open. We might adjust the levels in the “additional instruments” without adjusting the levels in the “main instruments”, which will simply mean that we have improved our estimation of these levels, not that we changed our outlook on the markets. We are already working on a tool that would update these levels on a daily basis for the most popular ETFs, ETNs and individual mining stocks.
Our preferred ways to invest in and to trade gold along with the reasoning can be found in the how to buy gold section. Additionally, our preferred ETFs and ETNs can be found in our Gold & Silver ETF Ranking.
As always, we'll keep you - our subscribers - updated should our views on the market change. We will continue to send out Gold & Silver Trading Alerts on each trading day and we will send additional Alerts whenever appropriate.
The trading position presented above is the netted version of positions based on subjective signals (opinion) from your Editor, and the Tools and Indicators.
As a reminder, Gold & Silver Trading Alerts are posted before or on each trading day (we usually post them before the opening bell, but we don't promise doing that each day). If there's anything urgent, we will send you an additional small alert before posting the main one.
=====
Latest Free Trading Alerts:
The U.S. economy added 235,000 jobs in February. What does it mean for the gold market?
S&P 500 index gained 0.3% on Friday, as investors reacted to better-than-expected monthly employment data release. Will stocks continue higher? Is holding short position still justified?
Stock Trading Alert: New Short-Term Uptrend Or Just Upward Correction Before Another Leg Down?
=====
Hand-picked precious-metals-related links:
PRECIOUS-Gold edges up on Europe political risk, but U.S. rate outlook drags
India gold recycling plan fails to tempt households
After gold's longest losing streak in 20 months, some spot a buying opportunity
=====
In other news:
Fed may have to accelerate rate rises to accommodate Trump policies -ECB's Visco
Trump budget opens new fight among Republicans
Reuters Poll: ECB won't hike rates before QE ends - traders
What to Expect in U.K. Markets When May Pulls Brexit Trigger
Sturgeon to Seek Right to Hold Second Scottish Independence Vote
Market Recon: Remember the Debt Ceiling Debate? Well, It Will Be Back
Oil prices fall to three-month low as U.S. rig count climbs
Bitcoin Miners Signal Revolt Amid Sluggish Blockchain
=====
Thank you.
Sincerely,
Przemyslaw Radomski, CFA
Founder, Editor-in-chief, Gold & Silver Fund Manager
Gold & Silver Trading Alerts
Forex Trading Alerts
Oil Investment Updates
Oil Trading Alerts

