

Briefly: In our opinion, full (150% of the regular full position) speculative short positions in gold, silver and mining stocks are justified from the risk/reward perspective. This position was originally featured on Jan. 12, 2017 at 3:49PM.
Gold, silver and mining stocks declined yesterday, but the decline in the latter was tiny compared to the one in the metals, which may suggest that the decline is over and the same goes for the cyclical turning point in silver. Is the bottom already in?
In short, most likely not. Let’s see why (charts courtesy of http://stockcharts.com).
In yesterday’s alert, we wrote the following:
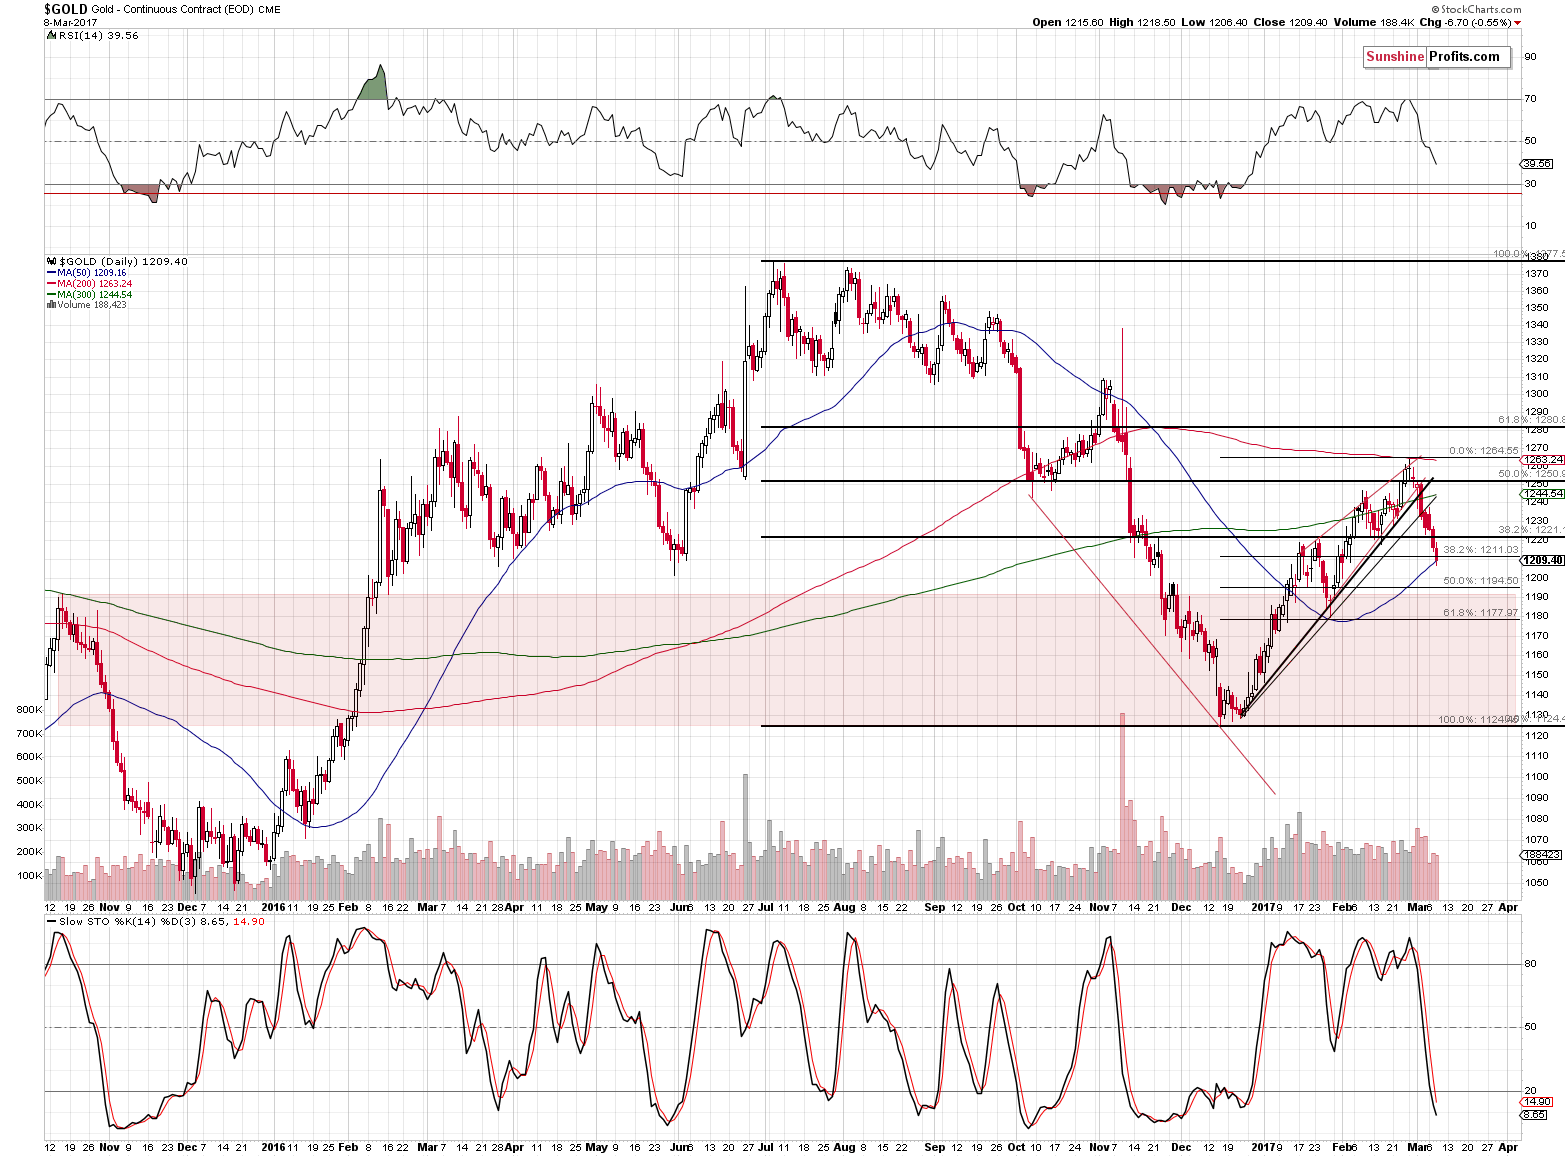
The Fibonacci retracement levels are relatively close and each of them could generate a corrective upswing, but we would like to stress that since the medium-term trend remains down, it doesn’t seem that the corrective upswing would be significant (for instance, gold corrected after the initial slide in early November, but this move was too small for one to adjust their position for it). Out of the 3 Fibonacci retracements, the final one (61.8%) appears to be the strongest as it is reinforced by the late-January low.
The important thing on the above chart is the rather large area that we marked in red – it shows that since late 2015 gold has had practically no support or resistance between about $1,190 and $1,125. What does this mean? That if gold is able to break below $1,190 (and the mentioned 61.8% Fibonacci retracement), it could slide all the way down to the $1,125 level without looking back. If this move is accompanied by the USD breaking to new highs (which seems likely), both moves (in the USD and gold) could be quick.
Consequently, by exiting the short position at the 61.8% Fibonacci retracement, one takes on the risk of missing a relatively large part of the decline (as it could be quite sharp) in case of a quick breakdown. Therefore, even though we have 2 support levels (late-January bottom and the 61.8% Fibonacci retracement) that coincide at the same price, it’s not a sure bet that we will actually see a reversal when they are reached. Of course, there are no certainties in trading, but in this case, the important thing is what happens if we don’t see the reversal – and the reply is that it could be costly.
That’s why we are going to pay extra attention to confirmations that we see once gold moves close to this level – if we see bullish confirmations, it could imply that temporarily exiting the short position will be justified. However, if we see none or we even see additional bearish confirmations, then it doesn’t seem that adjusting the position would be a good idea.
The first Fibonacci retracement was reached and the same goes for the 50-day moving average. Is this combination likely to stop the decline for some time? No, because based on today’s pre-market trading, gold is already below ($1,204) both levels. If the $1,209 level was so critical, it would be unlikely that it would be broken even insignificantly, especially without the USD’s help (the USD hasn’t really moved so far today).
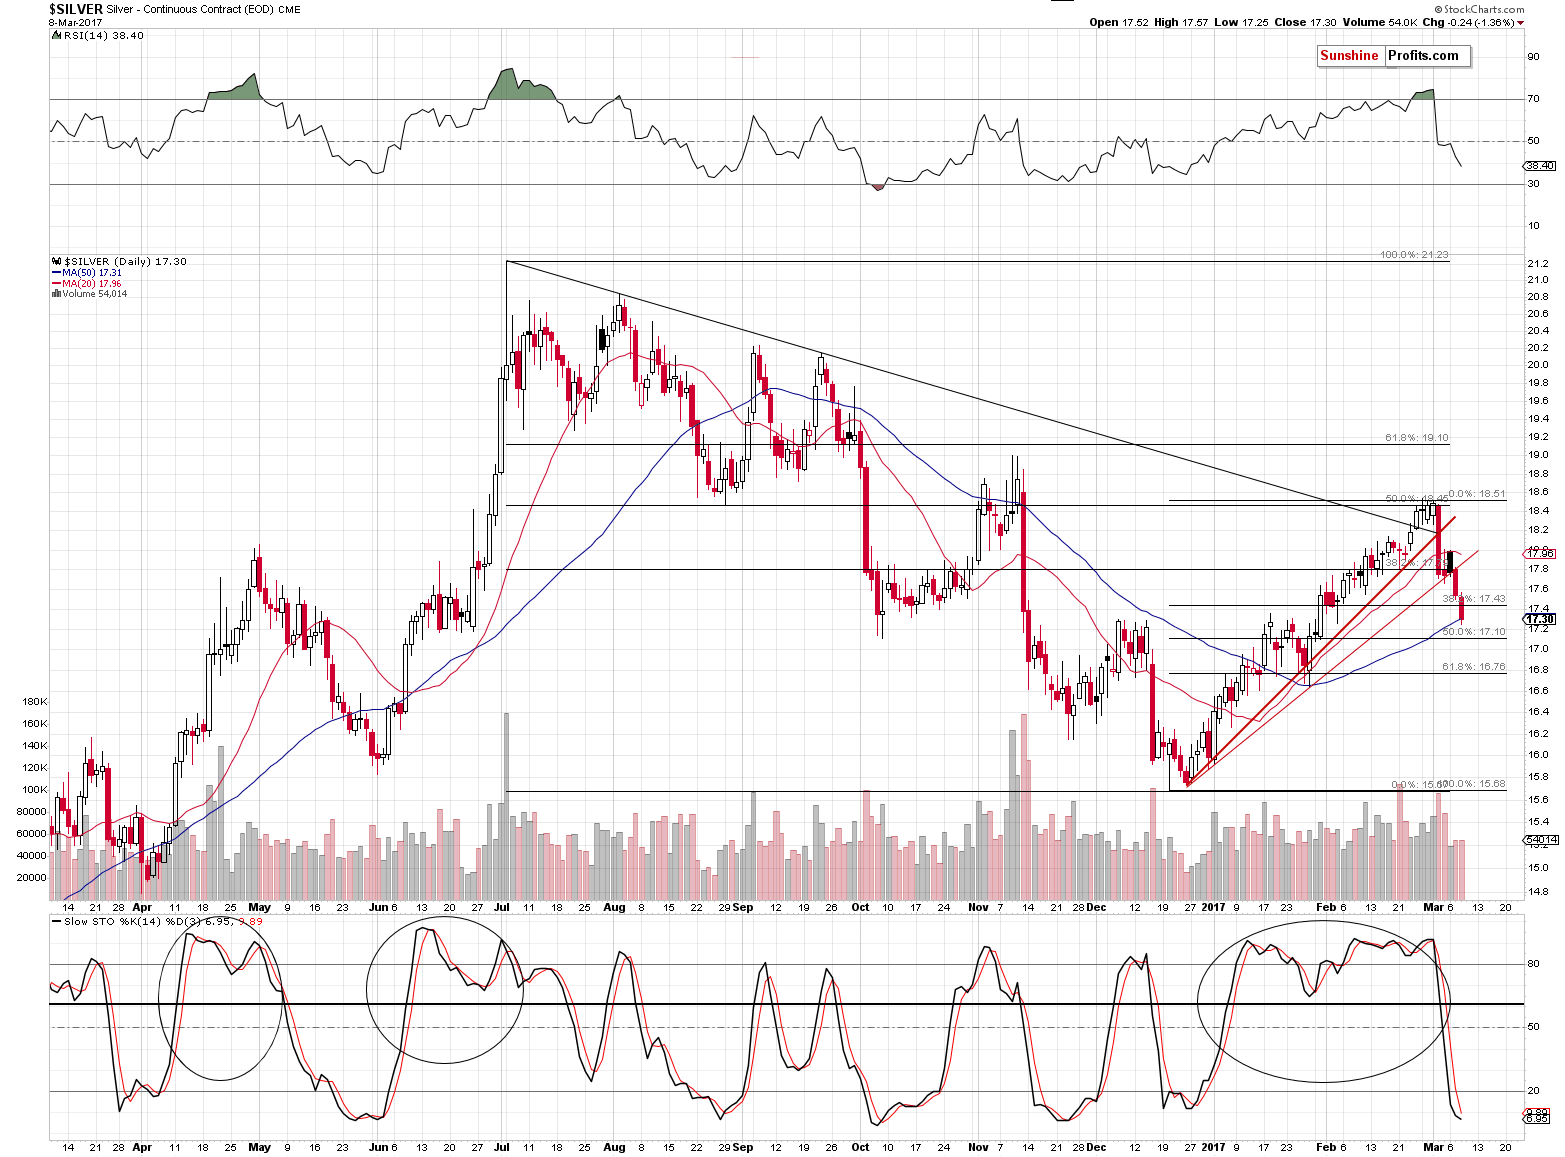
The same applies for silver. The above chart shows that silver closed at $17.30 – at the 50-day moving average. At the moment of writing these words, silver is at $17.15, so it’s visibly below the 50-day MA. The breakdown is not huge, but it does indicate that silver is most likely to move lower before it corrects.
The interesting thing about the silver market is that we have just seen a turning point, which seems to suggest that the bottom is already in. However, let’s not forget that the turning points work on a near-to basis, meaning that the bottom could be several days away.
This is especially the case that the USD’s turning point is about a week away.
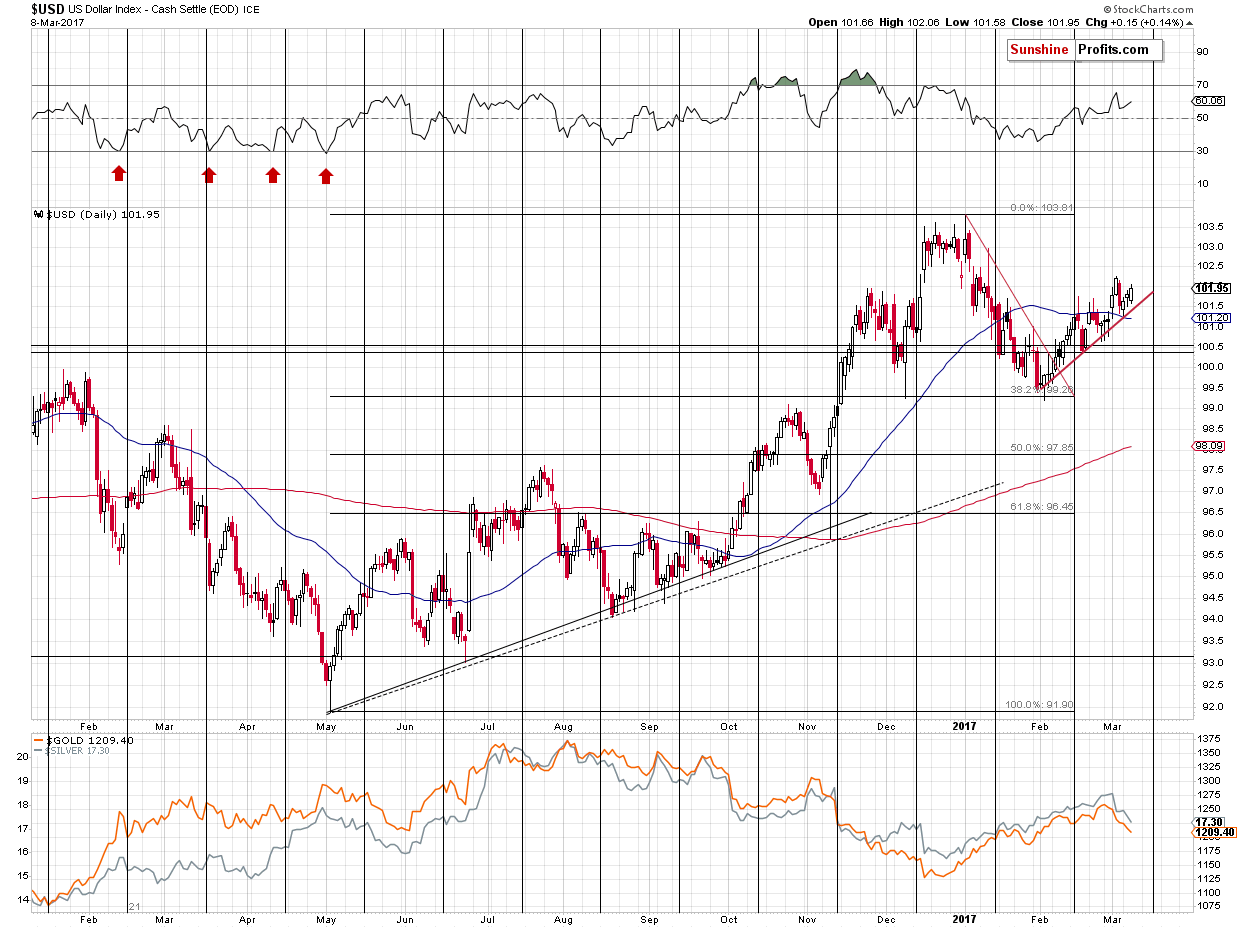
As is usually the case, the USD and metals are likely to correct at the same time, and at this time, the short-term uptrend in the USD Index remains in place.
The context is particularly important here.
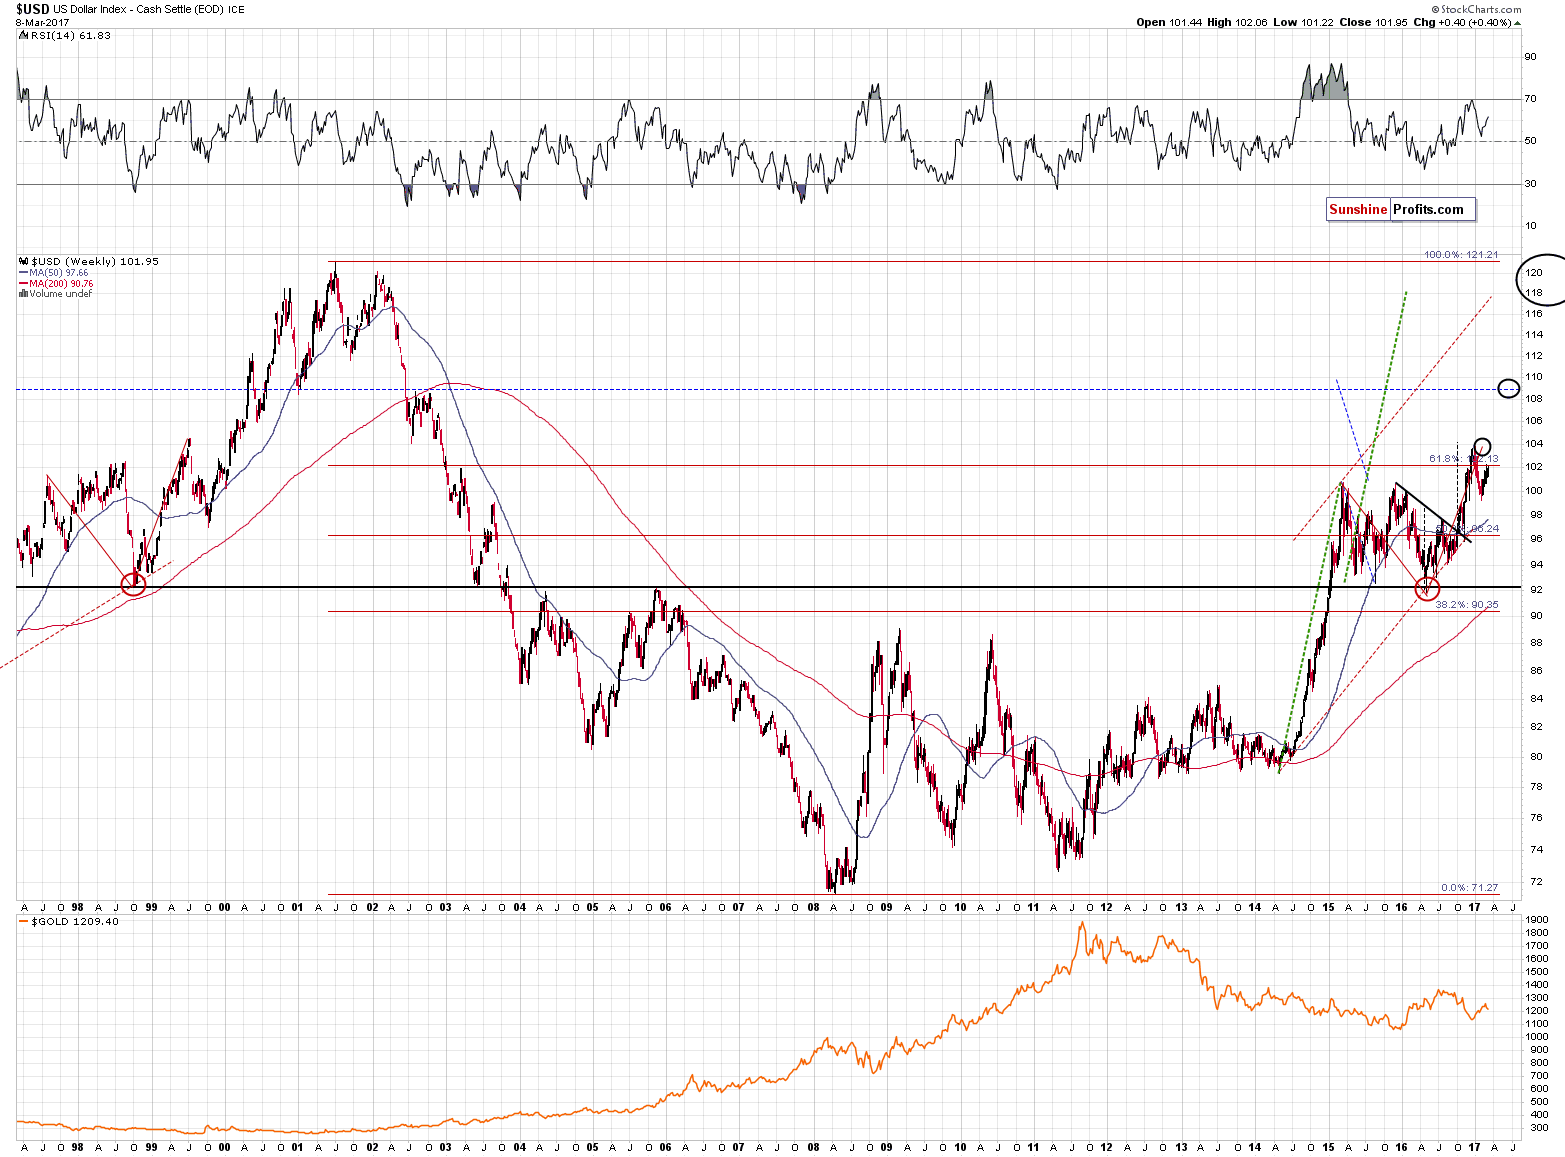
The current long-term upswing in the USD Index remains to be a reflection of the previous long-term downswing (the late-2009 bottom being the approximate center of the reflection). The USD Index is now reflecting the 2002 – 2003 decline. There was one big correction in 2003 and we are already after (!) a big correction this year. If the reflective nature of the pattern is to be upheld (which is likely), then we can expect the USD Index to soar without (or almost without) looking back (from the long-term perspective that is – there will still be corrections on a day-to-day basis). Therefore, it’s likely that we will see a big move higher in the USD and thus likely a big move lower in precious metals.
Consequently, the USD Index could correct after a few days, just like the precious metals sector, but the move is not likely to be significant in the case of the USD Index. Will it be significant for metals and miners? If they decline in a very sharp way, then it could be (but still, it will probably be temporary). Will we temporarily close the short position in light of the additional bullish confirmations? Probably yes, but we don’t want to commit before actually seeing the signals. For now, we have another day during which mining stocks refused to follow gold’s and silver’s lead, but not much more than that.
On a side note, something much more interesting happened in the crude oil market today – crude oil price broke sharply below the long-term rising support line and below the key $50 support level (yes, Oil Trading Alerts’ subscribers’ were shorting the market before the move and profited on it). The above is a very important development after weeks of little or no action at all, so if you’ve been considering trading this market, it might be a good idea to do so at this time.
Summing up, there will be corrections during the big decline, but whether they are worth adjusting the trading positions for them will depend on the signals that we get when the target levels are reached. For now, it appears a bit more likely than not that the following days will provide us with a good opportunity to temporarily (!) exit the current speculative short position and re-enter at higher prices.
As always, we will keep you – our subscribers – informed.
To summarize:
Trading capital (supplementary part of the portfolio; our opinion): Short positions (150% of the full position) in gold, silver and mining stocks are justified from the risk/reward perspective with the following stop-loss orders and initial target price levels / profit-take orders:
- Gold: exit-profit-take level: $1,063; stop-loss: $1,273; initial target price for the DGLD ETN: $81.88; stop-loss for the DGLD ETN $48.17
- Silver: initial target price: $13.12; stop-loss: $18.67; initial target price for the DSLV ETN: $46.18; stop-loss for the DSLV ETN $19.87
- Mining stocks (price levels for the GDX ETF): initial target price: $9.34; stop-loss: $26.34; initial target price for the DUST ETF: $143.56; stop-loss for the DUST ETF $21.37
In case one wants to bet on junior mining stocks' prices (we do not suggest doing so – we think senior mining stocks are more predictable in the case of short-term trades – if one wants to do it anyway, we provide the details), here are the stop-loss details and initial target prices:
- GDXJ ETF: initial target price: $14.13; stop-loss: $45.31
- JDST ETF: initial target price: $104.26; stop-loss: $10.78
Long-term capital (core part of the portfolio; our opinion): No positions (in other words: cash)
Insurance capital (core part of the portfolio; our opinion): Full position
Please note that the in the trading section we describe the situation for the day that the alert is posted. In other words, it we are writing about a speculative position, it means that it is up-to-date on the day it was posted. We are also featuring the initial target prices, so that you can decide whether keeping a position on a given day is something that is in tune with your approach (some moves are too small for medium-term traders and some might appear too big for day-traders).
Plus, you might want to read why our stop-loss orders are usually relatively far from the current price.
Please note that a full position doesn’t mean using all of the capital for a given trade. You will find details on our thoughts on gold portfolio structuring in the Key Insights section on our website.
As a reminder – “initial target price” means exactly that – an “initial” one, it’s not a price level at which we suggest closing positions. If this becomes the case (like it did in the previous trade) we will refer to these levels as levels of exit orders (exactly as we’ve done previously). Stop-loss levels, however, are naturally not “initial”, but something that, in our opinion, might be entered as an order.
Since it is impossible to synchronize target prices and stop-loss levels for all the ETFs and ETNs with the main markets that we provide these levels for (gold, silver and mining stocks – the GDX ETF), the stop-loss levels and target prices for other ETNs and ETF (among other: UGLD, DGLD, USLV, DSLV, NUGT, DUST, JNUG, JDST) are provided as supplementary, and not as “final”. This means that if a stop-loss or a target level is reached for any of the “additional instruments” (DGLD for instance), but not for the “main instrument” (gold in this case), we will view positions in both gold and DGLD as still open and the stop-loss for DGLD would have to be moved lower. On the other hand, if gold moves to a stop-loss level but DGLD doesn’t, then we will view both positions (in gold and DGLD) as closed. In other words, since it’s not possible to be 100% certain that each related instrument moves to a given level when the underlying instrument does, we can’t provide levels that would be binding. The levels that we do provide are our best estimate of the levels that will correspond to the levels in the underlying assets, but it will be the underlying assets that one will need to focus on regarding the signs pointing to closing a given position or keeping it open. We might adjust the levels in the “additional instruments” without adjusting the levels in the “main instruments”, which will simply mean that we have improved our estimation of these levels, not that we changed our outlook on the markets. We are already working on a tool that would update these levels on a daily basis for the most popular ETFs, ETNs and individual mining stocks.
Our preferred ways to invest in and to trade gold along with the reasoning can be found in the how to buy gold section. Additionally, our preferred ETFs and ETNs can be found in our Gold & Silver ETF Ranking.
As always, we'll keep you - our subscribers - updated should our views on the market change. We will continue to send out Gold & Silver Trading Alerts on each trading day and we will send additional Alerts whenever appropriate.
The trading position presented above is the netted version of positions based on subjective signals (opinion) from your Editor, and the Tools and Indicators.
As a reminder, Gold & Silver Trading Alerts are posted before or on each trading day (we usually post them before the opening bell, but we don't promise doing that each day). If there's anything urgent, we will send you an additional small alert before posting the main one.
=====
Latest Free Trading Alerts:
Gold and gold miners have been diverging recently. What does it mean for the gold market?
Divergence between Gold and Gold Miners
S&P 500 index slightly extended its short-term downtrend yesterday, as it lost 0.2%. Is this a new downtrend or just downward correction? Is holding short position still justified?
Stock Trading Alert: Stocks Extended Their Downtrend, But Will They Continue Lower?
=====
Hand-picked precious-metals-related links:
Gold Suffers Worst Run Since October as Slide Below $1,200 Looms
Perth Mint's gold, silver sales plunge in February
After terrible 2016, Indian gold demand will recover: WGC
Gold miners must invest in emerging markets for future -Randgold
=====
In other news:
No matador in sight as bull market in U.S. stocks turns eight
ECB to sit tight ahead of high-risk elections
ECB Inflation Outlook Set to Keep Bar High for Stimulus End
U.S. Crude Falls Below $50 After Supply Build
=====
Thank you.
Sincerely,
Przemyslaw Radomski, CFA
Founder, Editor-in-chief, Gold & Silver Fund Manager
Gold & Silver Trading Alerts
Forex Trading Alerts
Oil Investment Updates
Oil Trading Alerts

