

Briefly: In our opinion, full (150% of the regular full position) speculative short positions in gold, silver and mining stocks are justified from the risk/reward perspective. This position was originally featured on Jan. 12, 2017 at 3:49PM.
Gold, silver and mining stocks continue to decline this week and the yellow metal is down over $40 in the last 7 trading days. Since no market can move in a straight line, either up or down, it’s only a matter of time when the price reverses. Where could that take place and what action appears justified once the nearby downside targets are reached?
Starting with the latter part of the question, the preferred action depends on what kind of confirmations we get, for instance from volume, relative performance of miners vs. gold, action in the USD Index and the general stock market. The gold chart shows why waiting for such confirmations is so important right now. Let’s take a closer look (charts courtesy of http://stockcharts.com).
In yesterday’s alert, we wrote the following:
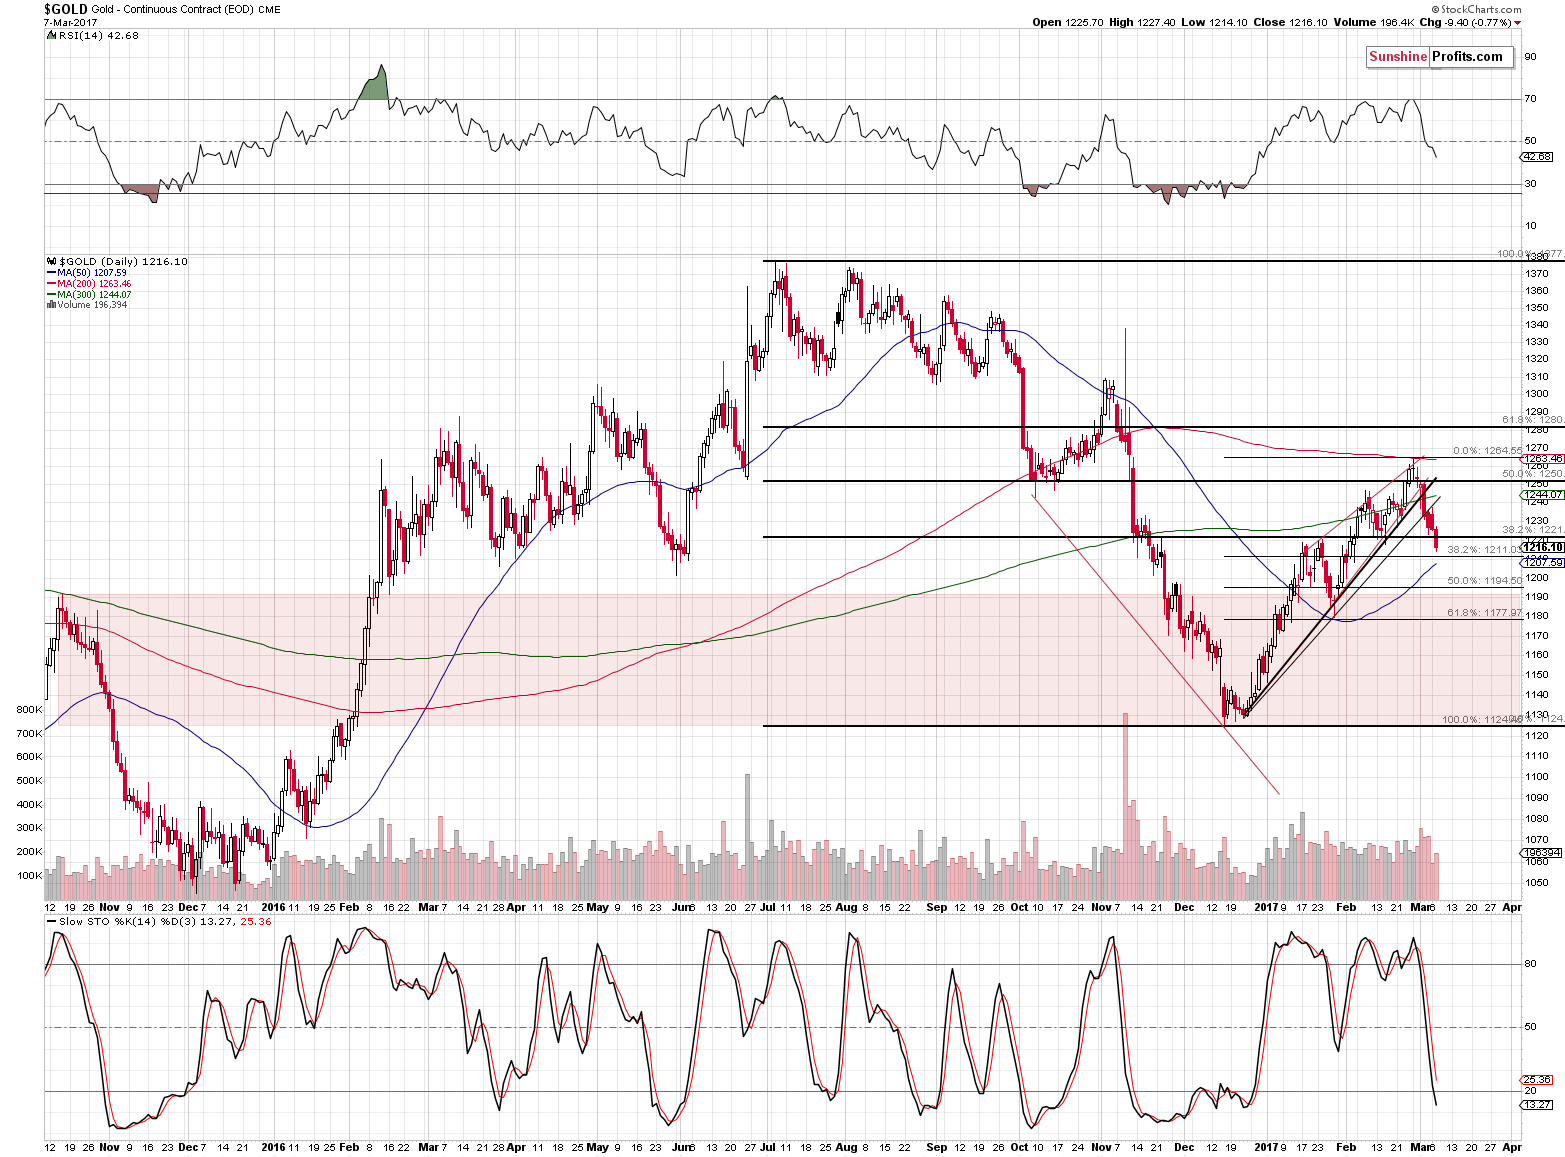
Gold also confirmed its breakdown below the rising support line based on the closing prices and is very close to confirming the breakdown below the line based on the intra-day lows. The implications are bearish – it appears that gold’s 2017 rally is already over.
Gold confirmed the second breakdown as well. The Fibonacci retracement levels are relatively close and each of them could generate a corrective upswing, but we would like to stress that since the medium-term trend remains down, it doesn’t seem that the corrective upswing would be significant (for instance, gold corrected after the initial slide in early November, but this move was too small for one to adjust their position for it). Out of the 3 Fibonacci retracements, the final one (61.8%) appears to be the strongest as it is reinforced by the late-January low.
The important thing on the above chart is the rather large area that we marked in red – it shows that since late 2015 gold has had practically no support or resistance between about $1,190 and $1,125. What does this mean? That if gold is able to break below $1,190 (and the mentioned 61.8% Fibonacci retracement), it could slide all the way down to the $1,125 level without looking back. If this move is accompanied by the USD breaking to new highs (which seems likely), both moves (in the USD and gold) could be quick.
Consequently, by exiting the short position at the 61.8% Fibonacci retracement, one takes on the risk of missing a relatively large part of the decline (as it could be quite sharp) in case of a quick breakdown. Therefore, even though we have 2 support levels (late-January bottom and the 61.8% Fibonacci retracement) that coincide at the same price, it’s not a sure bet that we will actually see a reversal when they are reached. Of course, there are no certainties in trading, but in this case, the important thing is what happens if we don’t see the reversal – and the reply is that it could be costly.
That’s why we are going to pay extra attention to confirmations that we see once gold moves close to this level – if we see bullish confirmations, it could imply that temporarily exiting the short position will be justified. However, if we see none or we even see additional bearish confirmations, then it doesn’t seem that adjusting the position would be a good idea.
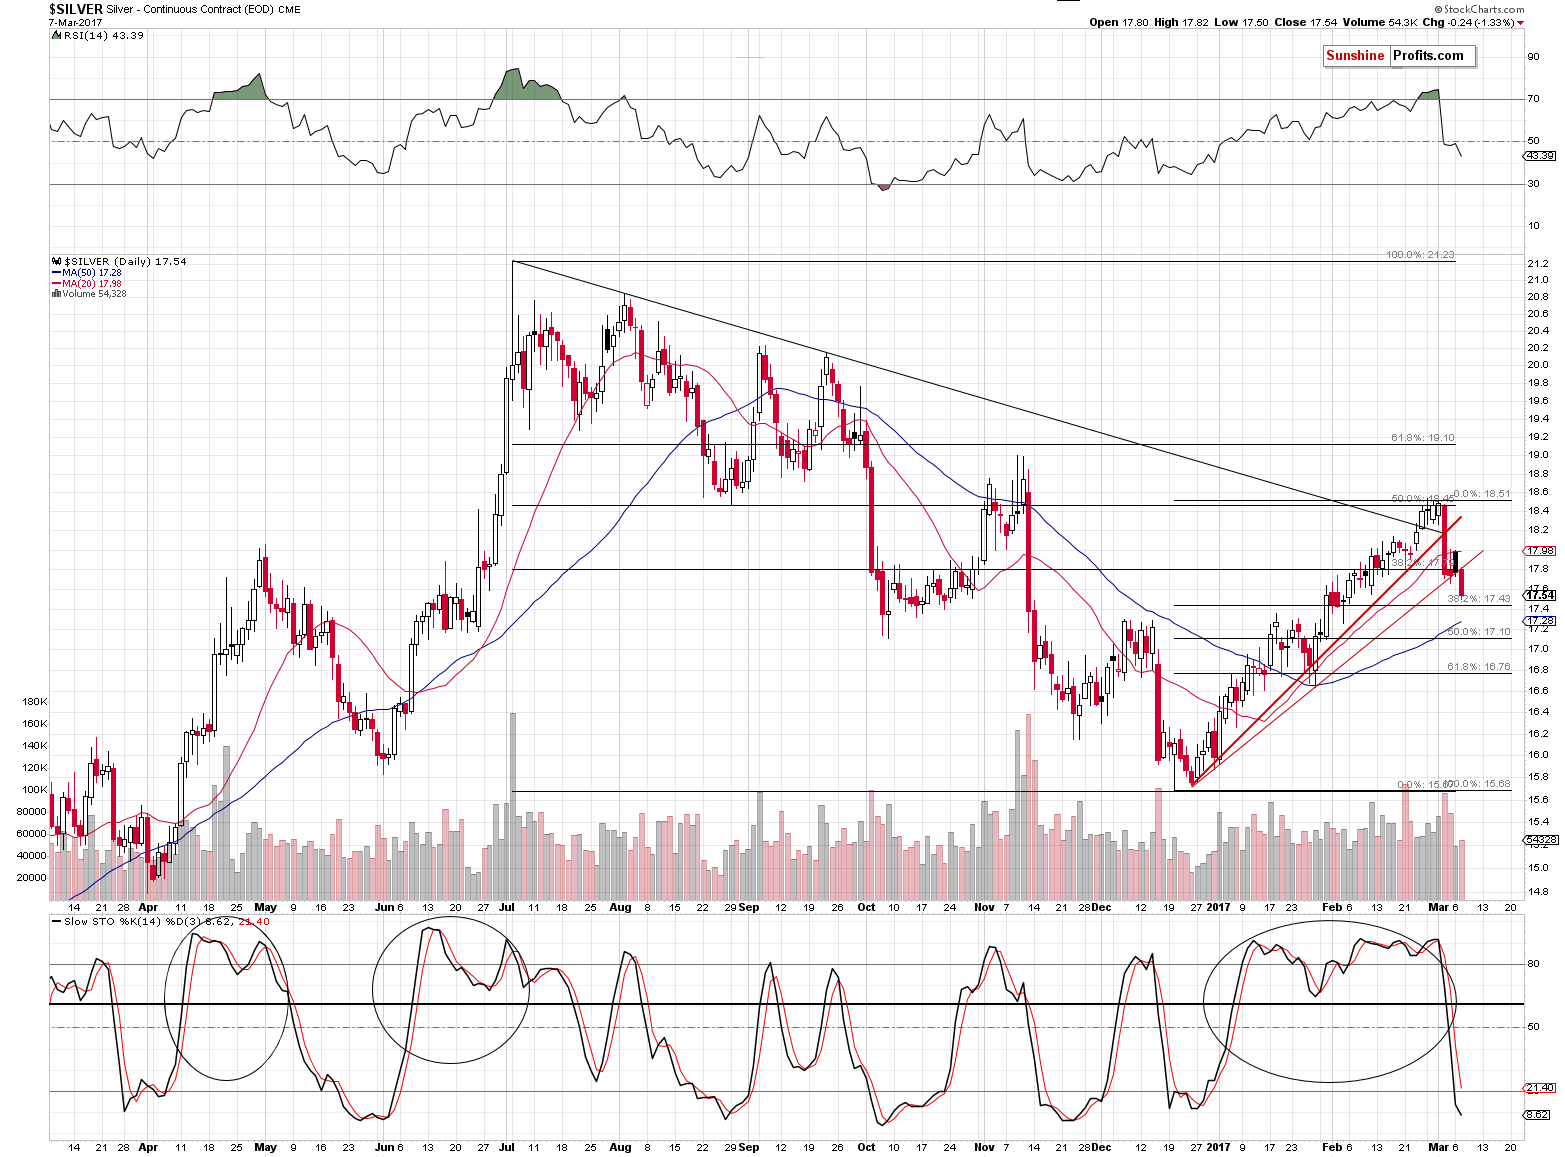
Interestingly, we have the same situation in silver – the January bottom coincides with the 61.8 Fibonacci retracement. This means that the analogous price area to the one discussed above is at about $16.70 - $16.80.
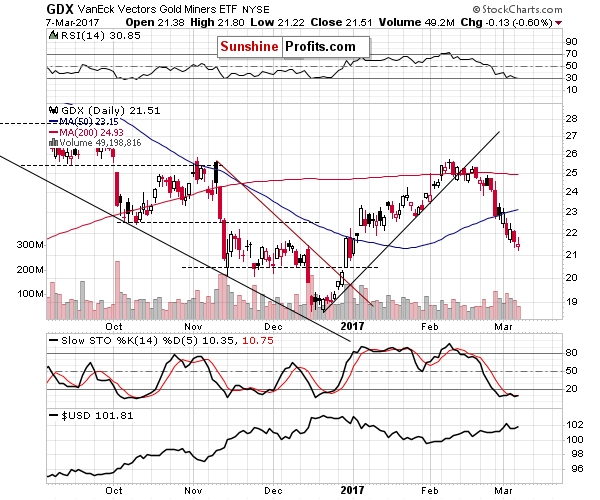
In case of mining stocks the situation is a bit different because, due to their significant underperformance, miners are not in an analogous position to gold or silver. Additionally, yesterday, miners actually declined relatively little compared to gold and silver, so it could be the case that mining stocks will now show relative strength until a corrective upswing takes place. Then again, that was only one session when miners didn’t underperform, so it not enough to really prove that the underperformance is over.
For now, let’s assume that the underperformance will stay in place. Consequently, in order to get to the mentioned target levels, gold and silver have to more or less double the size of their recent decline. If mining stocks doubled the size of their decline as well, they would more or less reach their 2016 bottom, which now serves as support. This may seem a lot (another $2 decline), but please note that mining stocks are already below the level that recently triggered a consolidation (between $22 and $23). Just like the rally from the December 2016 bottom to the $22 level was very quick, a slide back can be very quick as well.
Will reaching the December 2016 trigger a bigger upswing? Whether it is likely or not, will depend on the signals that we get when miners are close to this level.
Summing up, the breakdowns in metals and miners have bearish implications and the same goes for the current excessive optimism among gold traders. This, plus the other factors discussed in the previous alerts imply that the outlook for the precious metals market remains bearish. There will be corrections during the big decline, but whether they are worth adjusting the trading positions for them will depend on the signals that we get when the target levels are reached.
As always, we will keep you – our subscribers – informed.
To summarize:
Trading capital (supplementary part of the portfolio; our opinion): Short positions (150% of the full position) in gold, silver and mining stocks are justified from the risk/reward perspective with the following stop-loss orders and initial target price levels / profit-take orders:
- Gold: exit-profit-take level: $1,063; stop-loss: $1,273; initial target price for the DGLD ETN: $81.88; stop-loss for the DGLD ETN $48.17
- Silver: initial target price: $13.12; stop-loss: $18.67; initial target price for the DSLV ETN: $46.18; stop-loss for the DSLV ETN $19.87
- Mining stocks (price levels for the GDX ETF): initial target price: $9.34; stop-loss: $26.34; initial target price for the DUST ETF: $143.56; stop-loss for the DUST ETF $21.37
In case one wants to bet on junior mining stocks' prices (we do not suggest doing so – we think senior mining stocks are more predictable in the case of short-term trades – if one wants to do it anyway, we provide the details), here are the stop-loss details and initial target prices:
- GDXJ ETF: initial target price: $14.13; stop-loss: $45.31
- JDST ETF: initial target price: $104.26; stop-loss: $10.78
Long-term capital (core part of the portfolio; our opinion): No positions (in other words: cash)
Insurance capital (core part of the portfolio; our opinion): Full position
Please note that the in the trading section we describe the situation for the day that the alert is posted. In other words, it we are writing about a speculative position, it means that it is up-to-date on the day it was posted. We are also featuring the initial target prices, so that you can decide whether keeping a position on a given day is something that is in tune with your approach (some moves are too small for medium-term traders and some might appear too big for day-traders).
Plus, you might want to read why our stop-loss orders are usually relatively far from the current price.
Please note that a full position doesn’t mean using all of the capital for a given trade. You will find details on our thoughts on gold portfolio structuring in the Key Insights section on our website.
As a reminder – “initial target price” means exactly that – an “initial” one, it’s not a price level at which we suggest closing positions. If this becomes the case (like it did in the previous trade) we will refer to these levels as levels of exit orders (exactly as we’ve done previously). Stop-loss levels, however, are naturally not “initial”, but something that, in our opinion, might be entered as an order.
Since it is impossible to synchronize target prices and stop-loss levels for all the ETFs and ETNs with the main markets that we provide these levels for (gold, silver and mining stocks – the GDX ETF), the stop-loss levels and target prices for other ETNs and ETF (among other: UGLD, DGLD, USLV, DSLV, NUGT, DUST, JNUG, JDST) are provided as supplementary, and not as “final”. This means that if a stop-loss or a target level is reached for any of the “additional instruments” (DGLD for instance), but not for the “main instrument” (gold in this case), we will view positions in both gold and DGLD as still open and the stop-loss for DGLD would have to be moved lower. On the other hand, if gold moves to a stop-loss level but DGLD doesn’t, then we will view both positions (in gold and DGLD) as closed. In other words, since it’s not possible to be 100% certain that each related instrument moves to a given level when the underlying instrument does, we can’t provide levels that would be binding. The levels that we do provide are our best estimate of the levels that will correspond to the levels in the underlying assets, but it will be the underlying assets that one will need to focus on regarding the signs pointing to closing a given position or keeping it open. We might adjust the levels in the “additional instruments” without adjusting the levels in the “main instruments”, which will simply mean that we have improved our estimation of these levels, not that we changed our outlook on the markets. We are already working on a tool that would update these levels on a daily basis for the most popular ETFs, ETNs and individual mining stocks.
Our preferred ways to invest in and to trade gold along with the reasoning can be found in the how to buy gold section. Additionally, our preferred ETFs and ETNs can be found in our Gold & Silver ETF Ranking.
As always, we'll keep you - our subscribers - updated should our views on the market change. We will continue to send out Gold & Silver Trading Alerts on each trading day and we will send additional Alerts whenever appropriate.
The trading position presented above is the netted version of positions based on subjective signals (opinion) from your Editor, and the Tools and Indicators.
As a reminder, Gold & Silver Trading Alerts are posted before or on each trading day (we usually post them before the opening bell, but we don't promise doing that each day). If there's anything urgent, we will send you an additional small alert before posting the main one.
=====
Latest Free Trading Alerts:
In January, the Eurozone’s Target2 balances have reached the highest level since the crisis in 2012 when Greece was on the edge of leaving the common currency bloc. What does it mean for the Eurozone and the gold market?
Rising Target2 Balances and Gold
=====
Hand-picked precious-metals-related links:
Gold slips on strong dollar ahead of U.S. jobs data
Gold ends lower on interest-rate outlook, but geopolitical worries buoy
=====
In other news:
Ukraine eyes sanctions on subsidiary of Russia's Sberbank
Is the European Parliament’s call for visas the end of the American weekend in Paris?
=====
Thank you.
Sincerely,
Przemyslaw Radomski, CFA
Founder, Editor-in-chief, Gold & Silver Fund Manager
Gold & Silver Trading Alerts
Forex Trading Alerts
Oil Investment Updates
Oil Trading Alerts

