

Briefly: In our opinion, full (150% of the regular full position) speculative short positions in gold, silver and mining stocks are justified from the risk/reward perspective. This position was originally featured on Jan. 12, 2017 at 3:49PM.
When Yellen delivered a speech on Friday and reassured the markets that interest rate hikes were really on the table, the markets reacted in quite a specific way. The stock market didn’t do anything, the precious metals market moved higher and the USD Index declined substantially – was the decline in PMs only a matter of uncertainty and have we just seen a reversal?
In our view, the above would be a foregone conclusion. No market moves up or down in a straight line and precious metals as well as the USD Index are no exceptions. Both markets moved quite substantially last week and it’s only natural to expect some kind of correction to be seen eventually. It seems that’s what we saw on Friday.
Before we begin, we would like to stress that there was an inconsistency in the data – the above chart (and other charts featured in today’s alert) say that the closing prices for silver and gold were: $17.74 and $1,226.50, however, the data provided by kitco.com suggests that the closing prices were actually: $17.95 and $1,234.30. Fortunately, these differences don’t really change the outlook. Having said that, let’s take a look at the charts (charts courtesy of http://stockcharts.com).
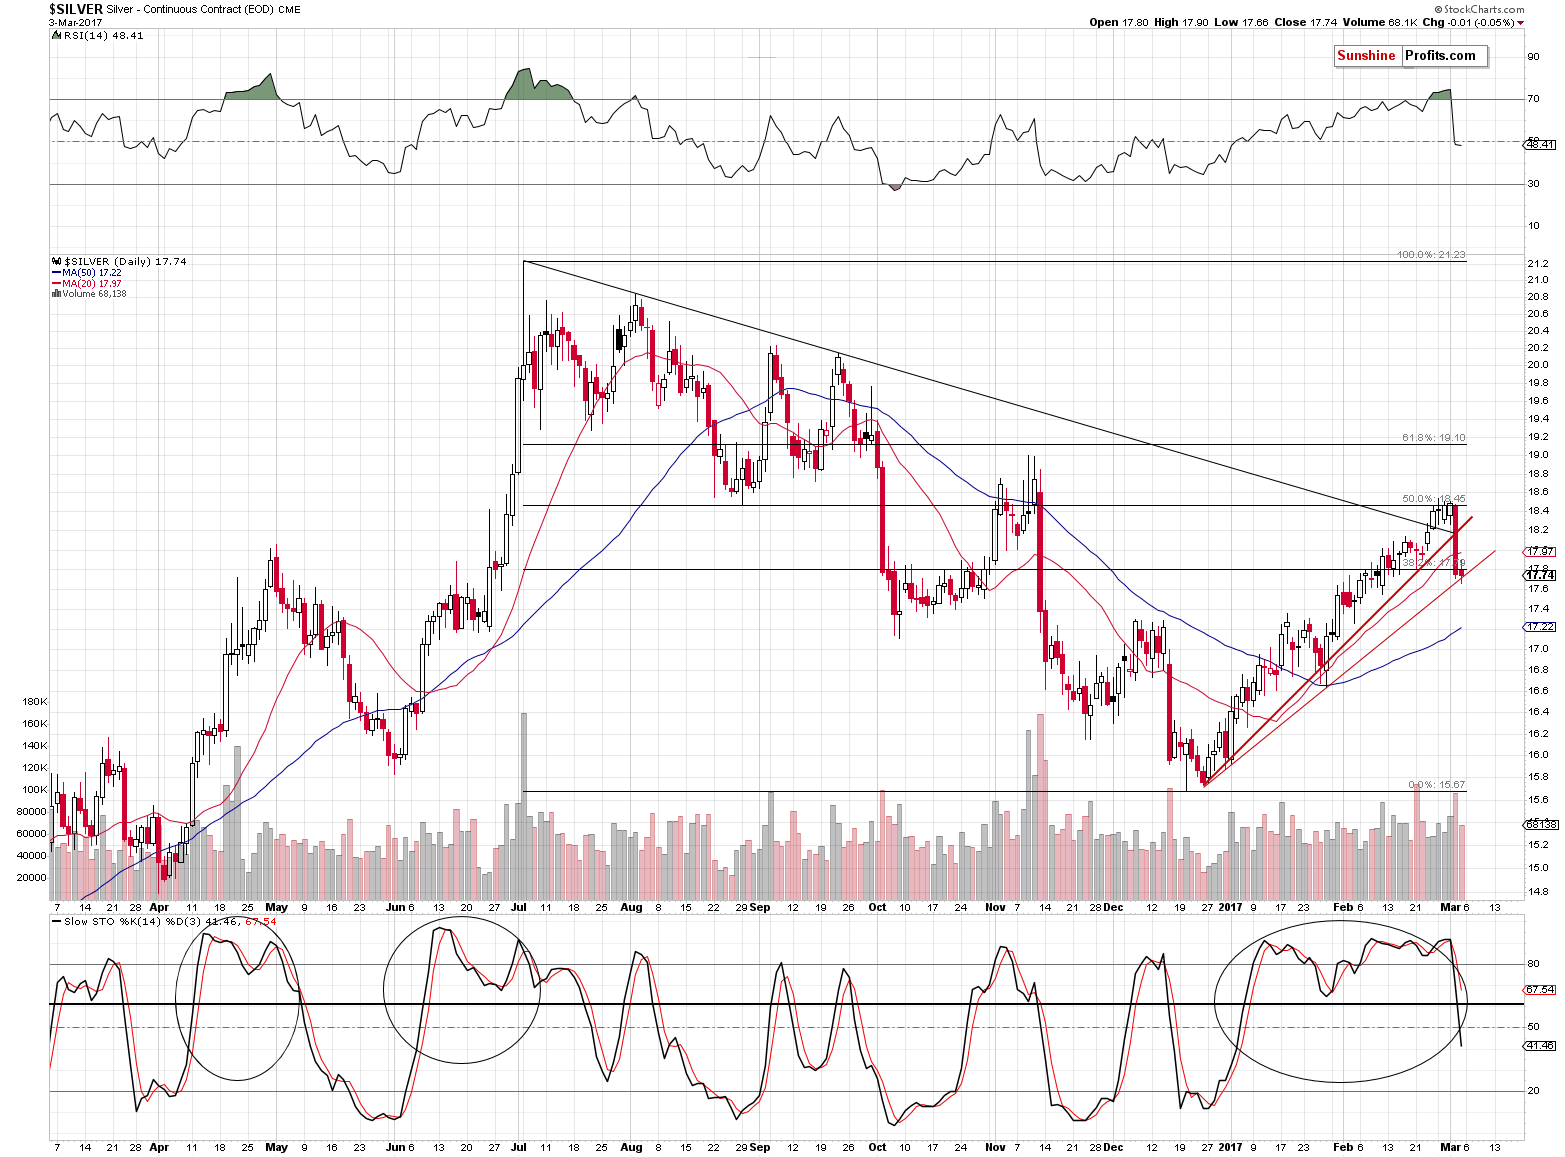
Regardless of which of the above closing prices we choose, we still have a situation in which silver didn’t manage to close back above the rising red support line based on the closing prices and none of them implies a breakdown below the line based on the intra-day lows. Consequently, the outlook didn’t change and it remains bearish as explained in the previous alert.
In Friday’s alert, we wrote the following:
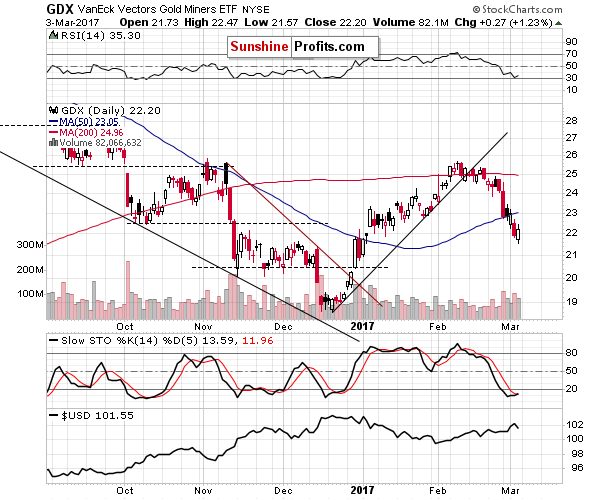
As far as mining stocks are concerned, they – unsurprisingly – declined visibly once again on strong volume, which is a classic bearish sign. Interestingly, yesterday’s close is the third lowest closing price of this year – only 17 cents above the lowest close (Jan. 3).
We didn’t see another daily slide, but the daily upswing was tiny and insignificant. The volume was not low in absolute terms, but it was low in relative terms (lower than Thursday’s high volume). Consequently, the bearish trend was not reversed on Friday – the 27-cent rally is not enough to do that.
In our previous alert, we wrote the following:
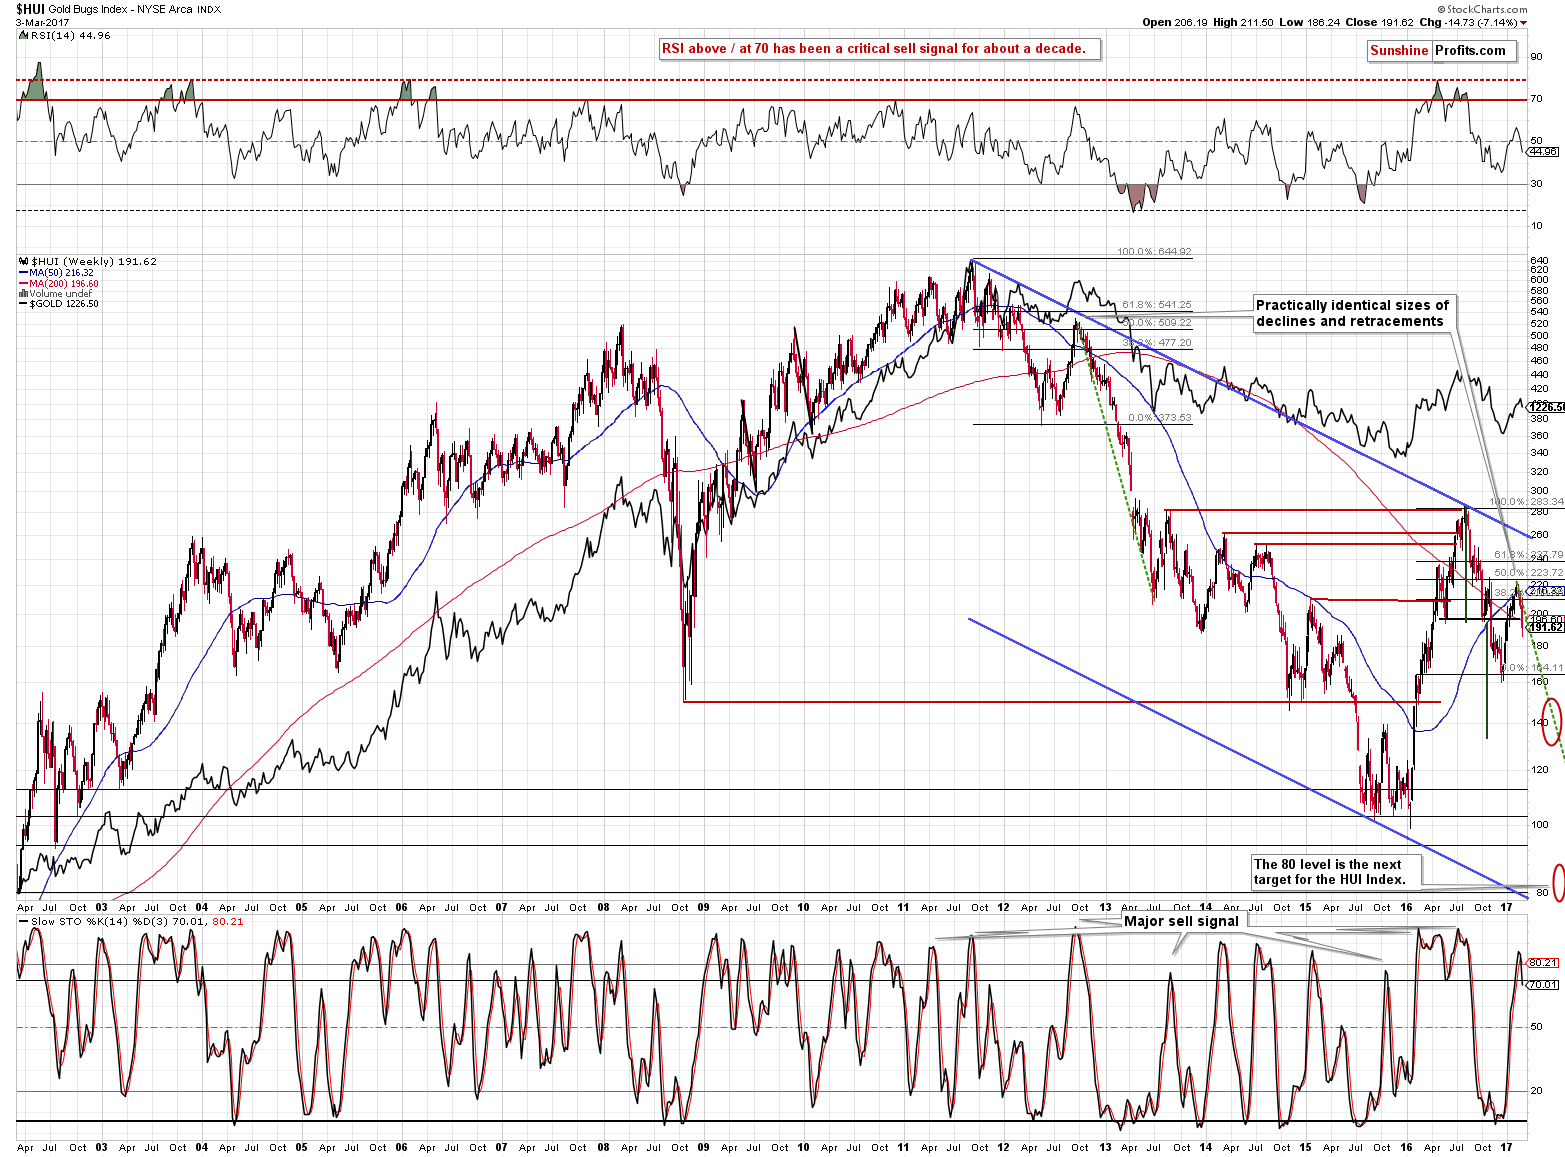
From the long-term perspective, we almost see a major sell signal. “Major”, because the sell signals from the Stochastic indicator based on weekly closing prices have been highly effective (they were not perfect – they didn’t work great in 2016, but still, comparing the number of excellent shorting opportunities that it indicated with the false signals suggests that these signals still remain very important) in the past several years. “Almost”, because the week is not over yet – however, the signal is so clear that it’s obvious that miners would need to reverse in a profound fashion today in order to invalidate it. That’s not likely to happen, i.a., due to what we have on the short-term GDX chart.
Please note that the HUI Index dropped about 100 index points from the 2016 top. It only has to drop 100 more in order to reach our downside target of 80. Sounds impossible? Well, how did the HUI at 200 sound when it was trading above 600 in 2011 and yet here we are with the HUI at 188.
Naturally, the major sell signal from the Stochastic indicator is in based on the final weekly closing prices – the implications are very bearish for the following weeks not only for gold stocks, but also for the rest of the precious metals market.
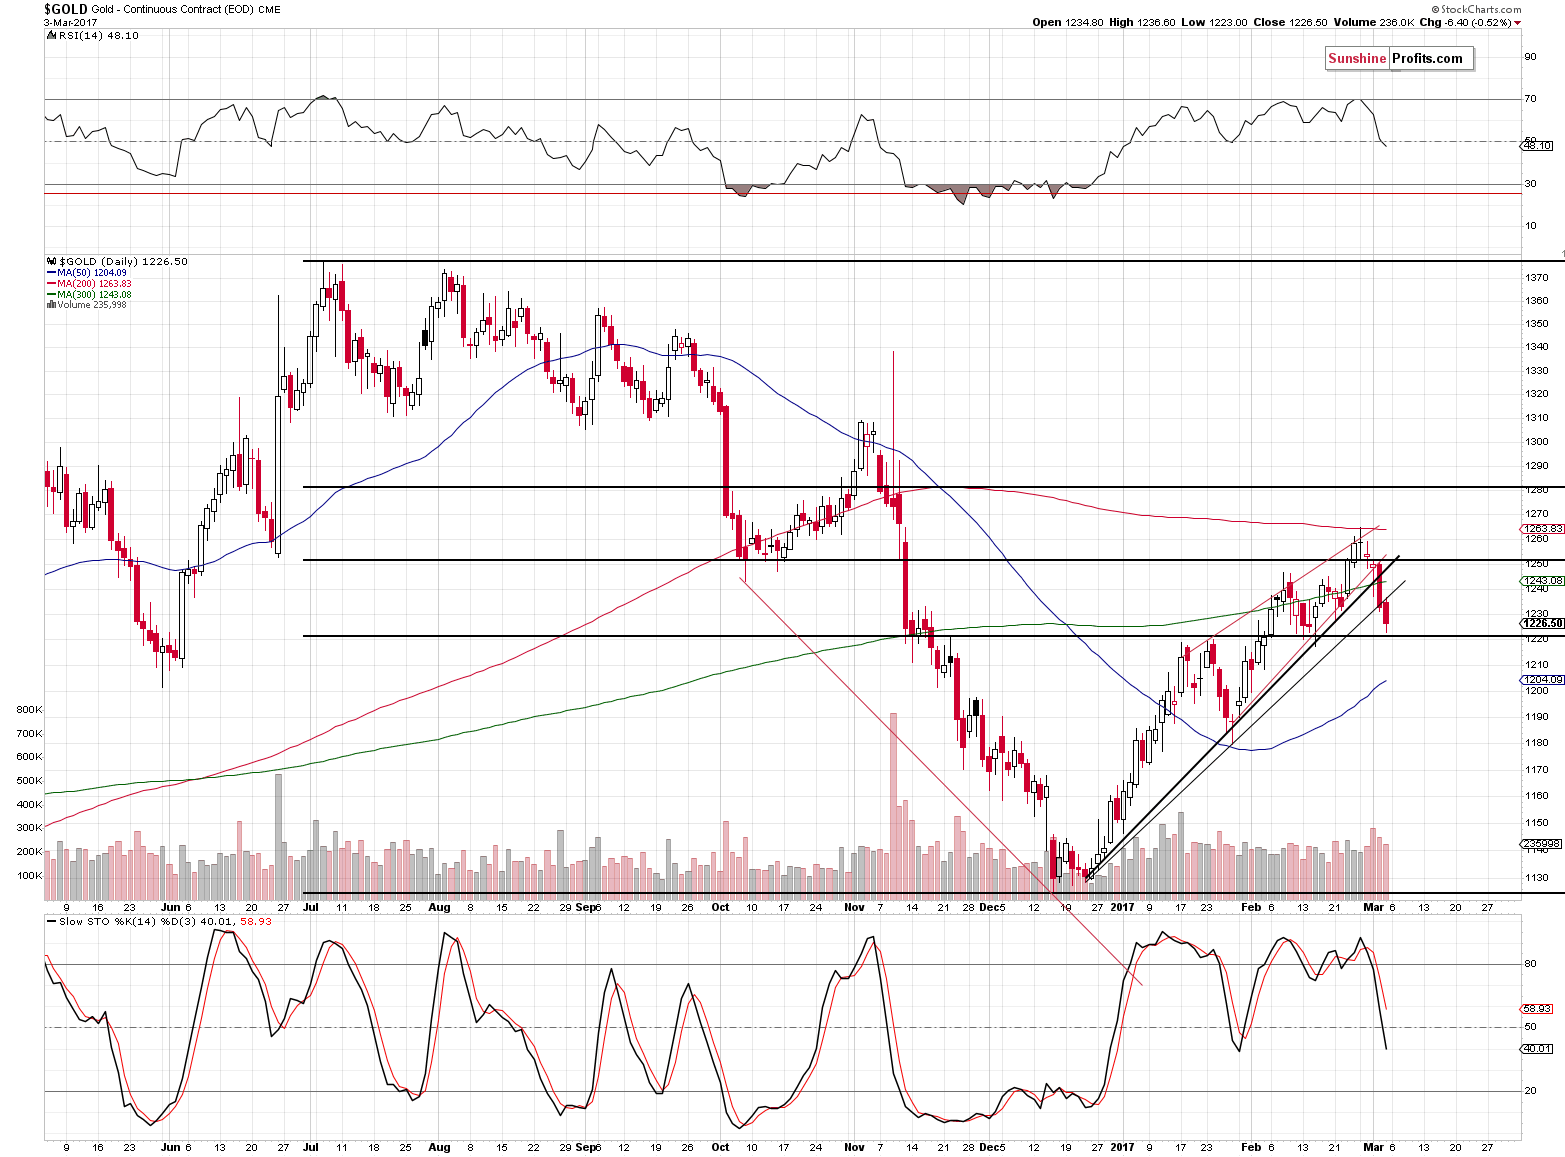
No matter which of the mentioned closing prices we use, we still get a picture in which gold moved lower and then moved back up but not back above the rising support line, which has now turned into resistance. The implications are simply bearish.
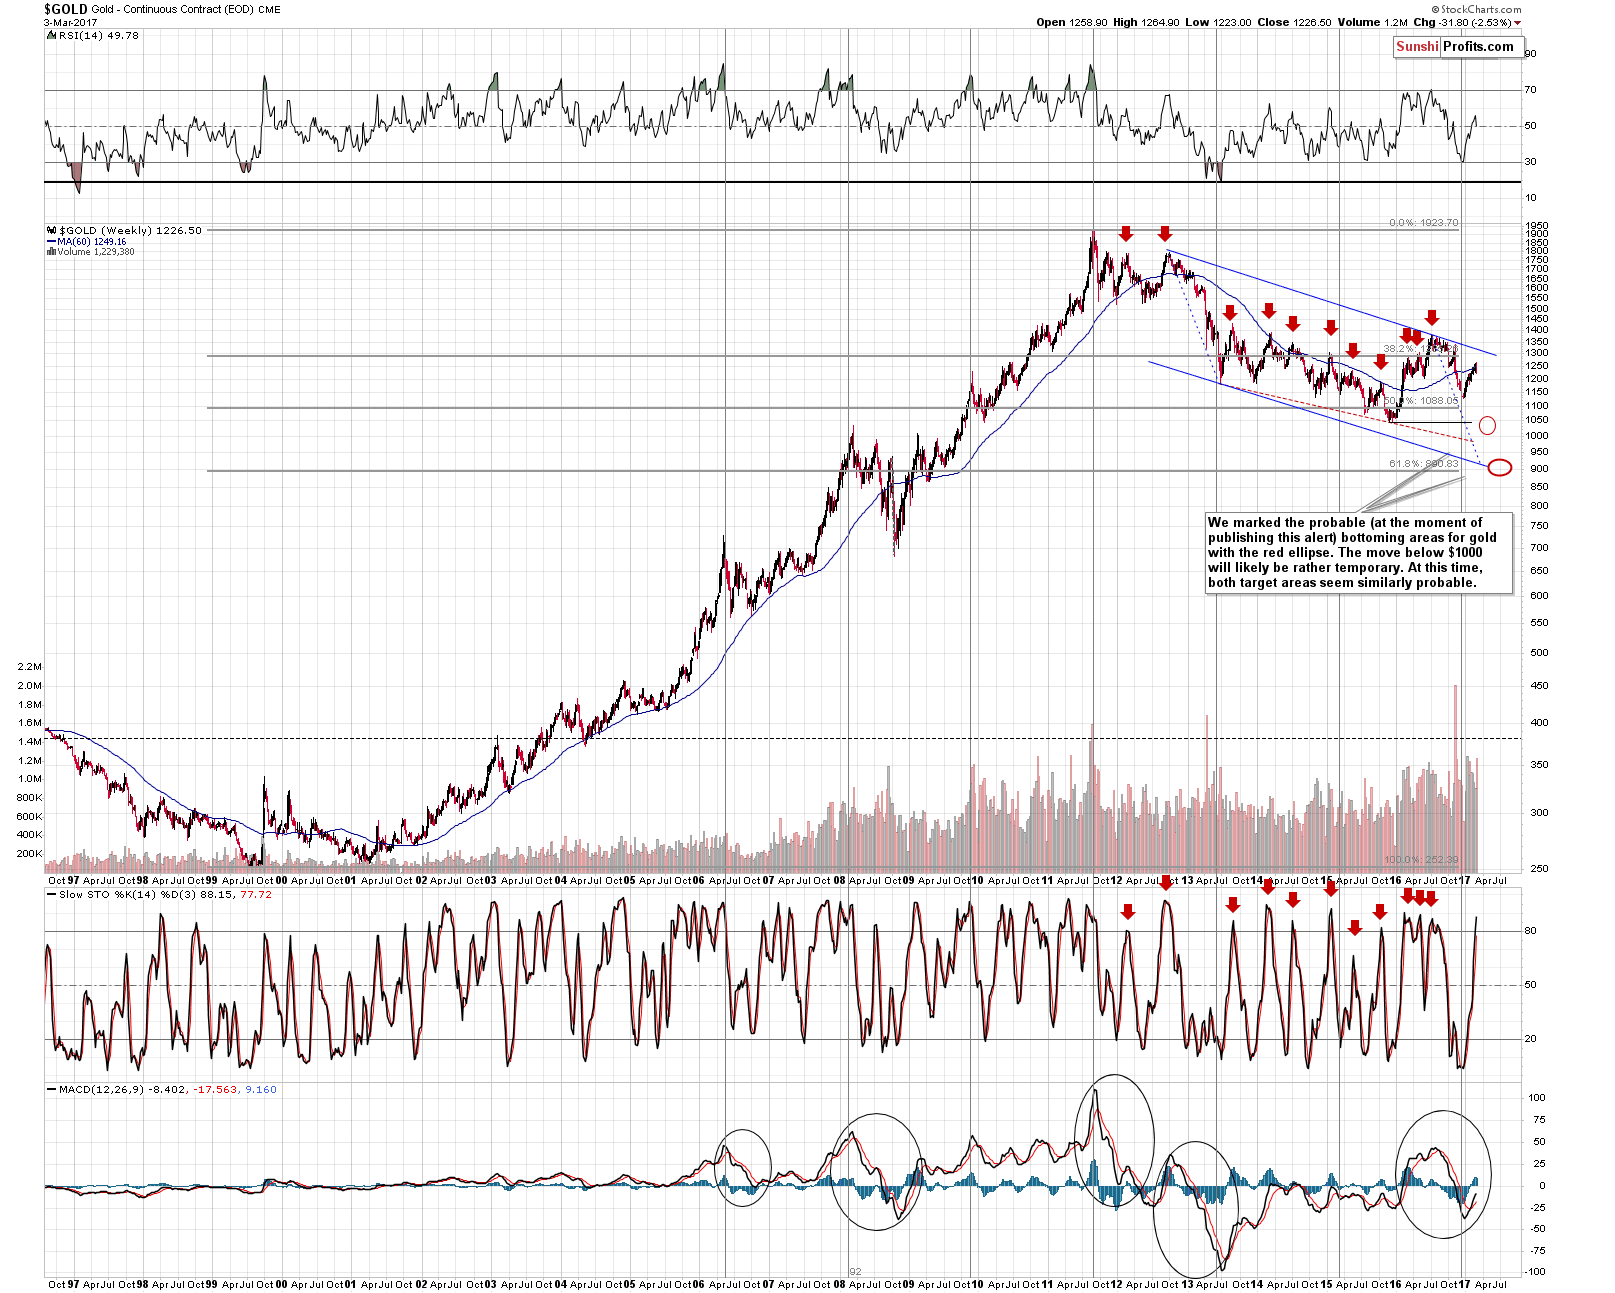
Gold has also visibly invalidated the previous small move above the 60-week moving average. We now have a confirmation from the weekly closing prices that there was no breakout and thus, the bearish implications of the late-2016 breakdown remain in place. It appears that the recent move higher was simply a verification of the breakdown (big, but still).
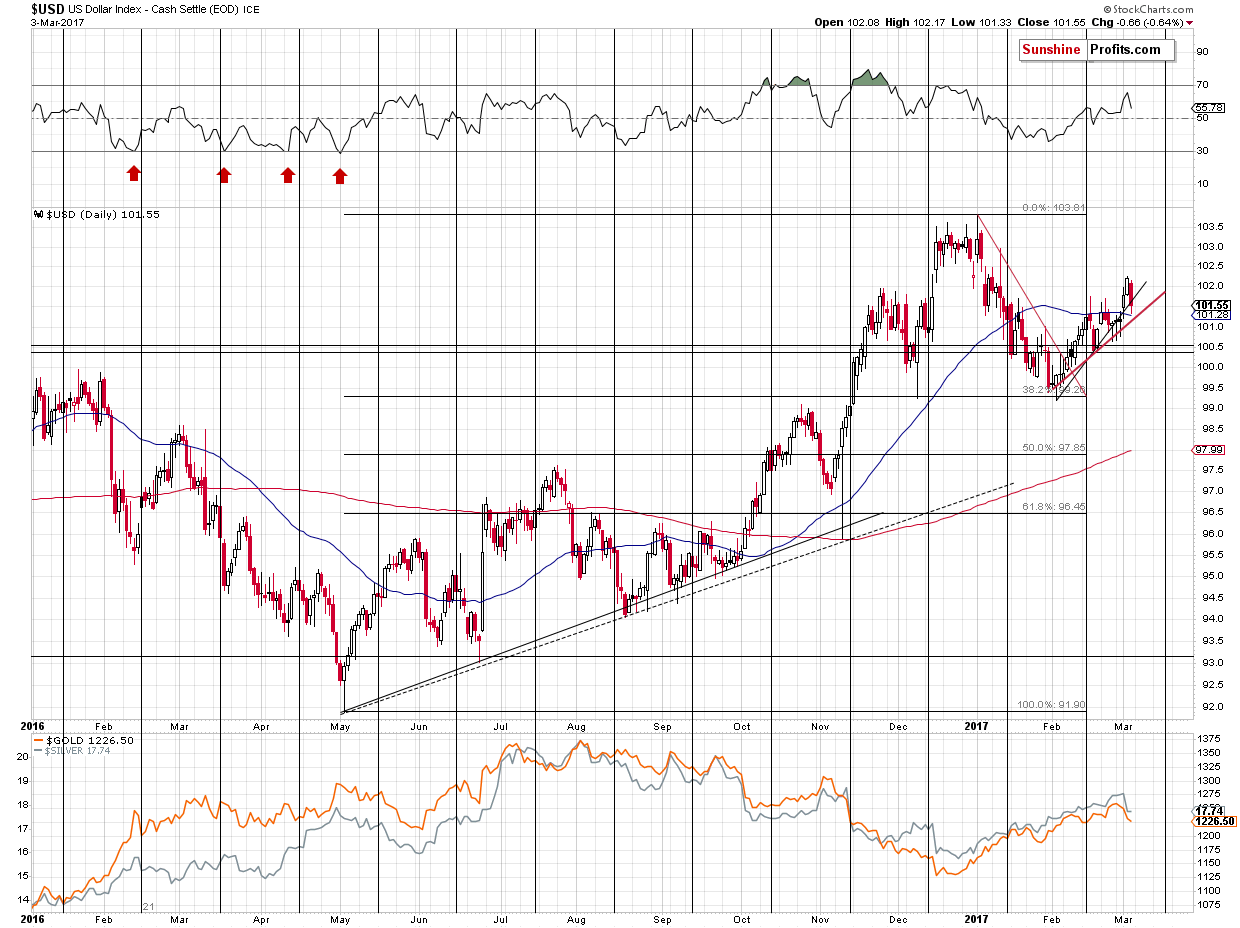
Most interestingly, though, the precious metals’ reaction (even assuming the higher of the reported closing prices) on Friday was very weak when one compares it to the move in the USD Index. The closing price on the above chart is 101.55, whereas the price reported by kitco.com is 101.34. No matter which set of prices one decides to take into account, the reactions of precious metals and mining stocks were still very weak compared with what we saw in the USD Index. This is a not-so-subtle sign that metals are not willing to move much higher anytime soon and even if the USD Index continues to decline, the former will not reply to the full extent.
Moreover, since the USD Index remains above the rising red support line (based on the closing prices), it seems that the potential decline in the U.S. currency will not be significant. Taking both factors into account suggests that the impact of the currency market on the precious metals market is currently (and is likely to be) negative in the coming days and weeks.
Summing up, we finally saw some decisive action in metals last week and it’s finally not only the mining stock sector that declines in a visible way. Silver’s slide was profound not only by itself, but also through its ratio to gold and the RSI indicator based on it. The latter flashed a major sell signal and we just saw another one from the HUI Index. This, plus the other factors discussed in the previous alerts imply that the outlook for the precious metals market remains bearish.
As always, we will keep you – our subscribers – informed.
To summarize:
Trading capital (supplementary part of the portfolio; our opinion): Short positions (150% of the full position) in gold, silver and mining stocks are justified from the risk/reward perspective with the following stop-loss orders and initial target price levels / profit-take orders:
- Gold: exit-profit-take level: $1,063; stop-loss: $1,273; initial target price for the DGLD ETN: $81.88; stop-loss for the DGLD ETN $48.17
- Silver: initial target price: $13.12; stop-loss: $18.67; initial target price for the DSLV ETN: $46.18; stop-loss for the DSLV ETN $19.87
- Mining stocks (price levels for the GDX ETF): initial target price: $9.34; stop-loss: $26.34; initial target price for the DUST ETF: $143.56; stop-loss for the DUST ETF $21.37
In case one wants to bet on junior mining stocks' prices (we do not suggest doing so – we think senior mining stocks are more predictable in the case of short-term trades – if one wants to do it anyway, we provide the details), here are the stop-loss details and initial target prices:
- GDXJ ETF: initial target price: $14.13; stop-loss: $45.31
- JDST ETF: initial target price: $104.26; stop-loss: $10.78
Long-term capital (core part of the portfolio; our opinion): No positions (in other words: cash)
Insurance capital (core part of the portfolio; our opinion): Full position
Please note that the in the trading section we describe the situation for the day that the alert is posted. In other words, it we are writing about a speculative position, it means that it is up-to-date on the day it was posted. We are also featuring the initial target prices, so that you can decide whether keeping a position on a given day is something that is in tune with your approach (some moves are too small for medium-term traders and some might appear too big for day-traders).
Plus, you might want to read why our stop-loss orders are usually relatively far from the current price.
Please note that a full position doesn’t mean using all of the capital for a given trade. You will find details on our thoughts on gold portfolio structuring in the Key Insights section on our website.
As a reminder – “initial target price” means exactly that – an “initial” one, it’s not a price level at which we suggest closing positions. If this becomes the case (like it did in the previous trade) we will refer to these levels as levels of exit orders (exactly as we’ve done previously). Stop-loss levels, however, are naturally not “initial”, but something that, in our opinion, might be entered as an order.
Since it is impossible to synchronize target prices and stop-loss levels for all the ETFs and ETNs with the main markets that we provide these levels for (gold, silver and mining stocks – the GDX ETF), the stop-loss levels and target prices for other ETNs and ETF (among other: UGLD, DGLD, USLV, DSLV, NUGT, DUST, JNUG, JDST) are provided as supplementary, and not as “final”. This means that if a stop-loss or a target level is reached for any of the “additional instruments” (DGLD for instance), but not for the “main instrument” (gold in this case), we will view positions in both gold and DGLD as still open and the stop-loss for DGLD would have to be moved lower. On the other hand, if gold moves to a stop-loss level but DGLD doesn’t, then we will view both positions (in gold and DGLD) as closed. In other words, since it’s not possible to be 100% certain that each related instrument moves to a given level when the underlying instrument does, we can’t provide levels that would be binding. The levels that we do provide are our best estimate of the levels that will correspond to the levels in the underlying assets, but it will be the underlying assets that one will need to focus on regarding the signs pointing to closing a given position or keeping it open. We might adjust the levels in the “additional instruments” without adjusting the levels in the “main instruments”, which will simply mean that we have improved our estimation of these levels, not that we changed our outlook on the markets. We are already working on a tool that would update these levels on a daily basis for the most popular ETFs, ETNs and individual mining stocks.
Our preferred ways to invest in and to trade gold along with the reasoning can be found in the how to buy gold section. Additionally, our preferred ETFs and ETNs can be found in our Gold & Silver ETF Ranking.
As always, we'll keep you - our subscribers - updated should our views on the market change. We will continue to send out Gold & Silver Trading Alerts on each trading day and we will send additional Alerts whenever appropriate.
The trading position presented above is the netted version of positions based on subjective signals (opinion) from your Editor, and the Tools and Indicators.
As a reminder, Gold & Silver Trading Alerts are posted before or on each trading day (we usually post them before the opening bell, but we don't promise doing that each day). If there's anything urgent, we will send you an additional small alert before posting the main one.
=====
Latest Free Trading Alerts:
Last week, there was a massive U.S. economic data dump. What does the release of several reports imply for the gold market?
January Consumer Spending and Gold
S&P 500 index gained 0.05% on Friday, as investors remained uncertain following Thursday's move down. Is this a new downtrend or just quick profit-taking action before another leg up?
Stock Trading Alert: Uncertainty Following Recent Run-Up, Will Uptrend Continue?
=====
Hand-picked precious-metals-related links:
Arizona Challenges the Fed's Money Monopoly
Gold is a poor inflation hedge
CME, Thomson Reuters step down from providing London silver benchmark
A short history: How bitcoin reached parity with gold
=====
In other news:
Geopolitics, Deutsche Bank drag global stocks lower
Investors bet Trump-fueled tech rally far from over
Snap's stock price hard to justify: Barron's
Stop! This is NOT like the dot-com bubble... it’s much worse, according to this chart
=====
Thank you.
Sincerely,
Przemyslaw Radomski, CFA
Founder, Editor-in-chief, Gold & Silver Fund Manager
Gold & Silver Trading Alerts
Forex Trading Alerts
Oil Investment Updates
Oil Trading Alerts

