

Briefly: In our opinion, full (150% of the regular full position) speculative short positions in gold, silver and mining stocks are justified from the risk/reward perspective. This position was originally featured on Jan. 12, 2017 at 3:49PM.
In yesterday’s alert, we discussed the stock market rally and its impact on the precious metals market through, i.a., the silver market. We wrote that if silver declined, it would flash an important signal – and that’s exactly what happened. Let’s take a look at the charts and discuss the implications (charts courtesy of http://stockcharts.com).
In yesterday’s alert, we wrote the following:
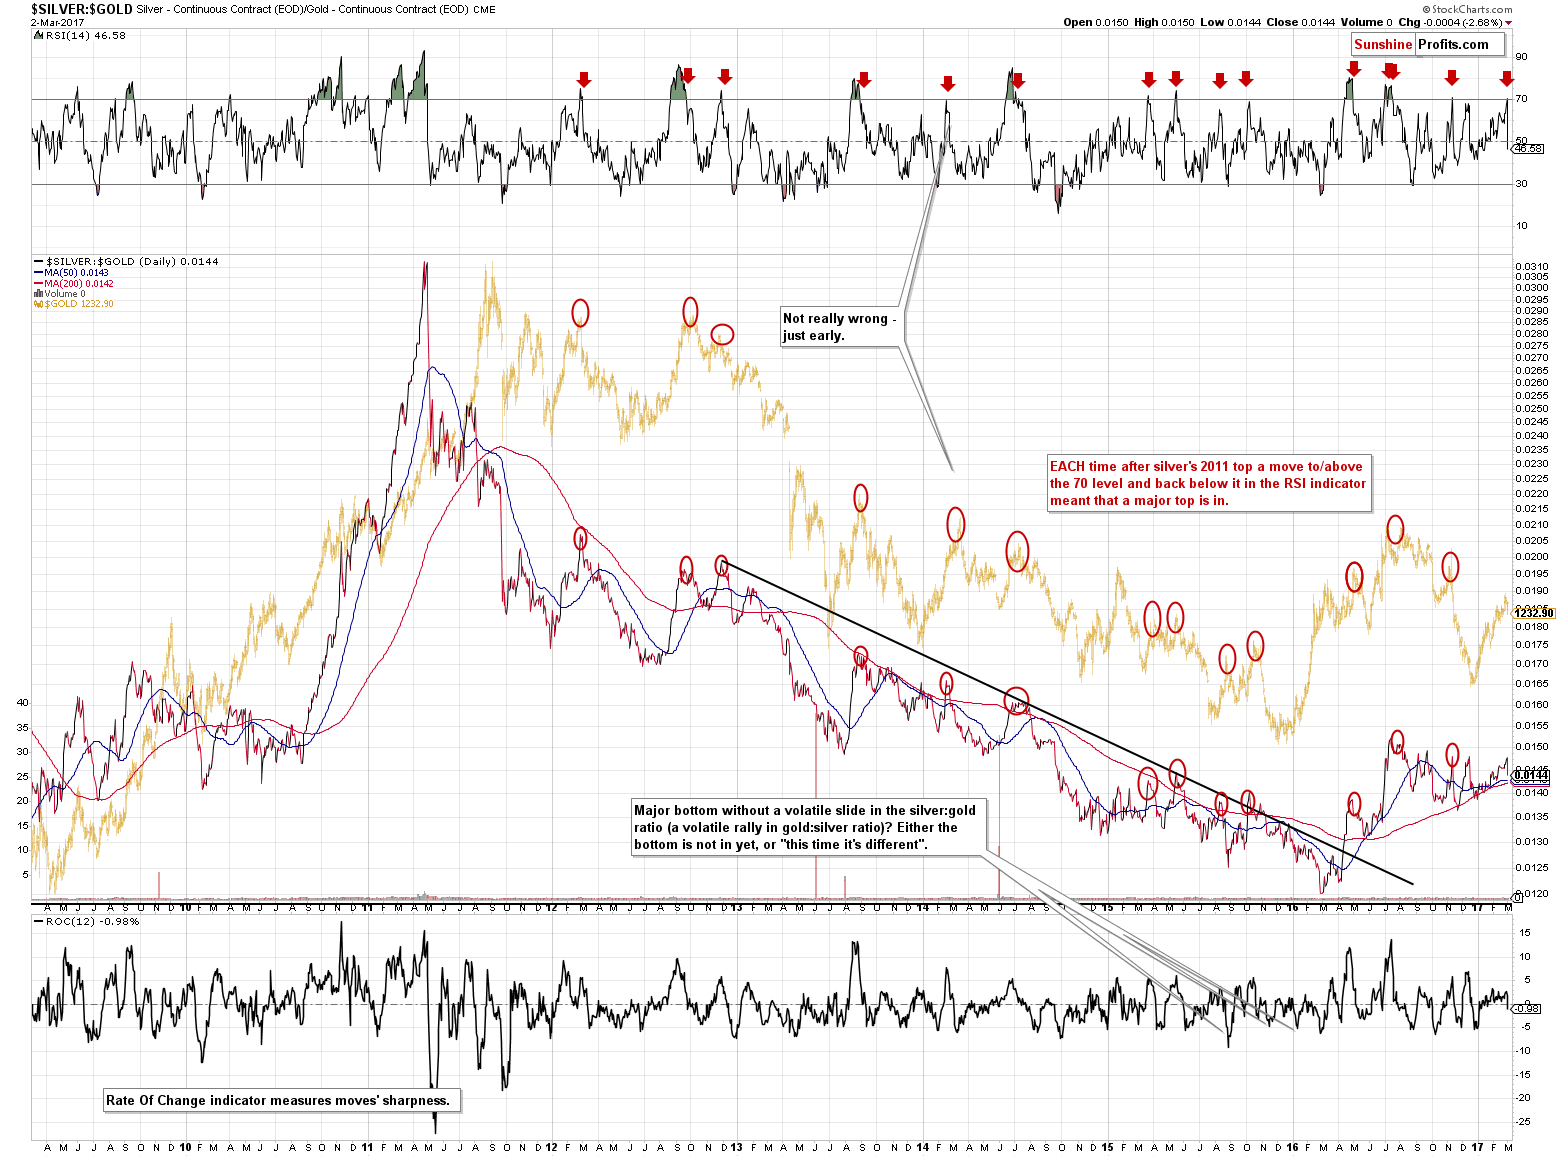
It is not the ratio itself that features a substantial change – it’s the RSI indicator based on it. The point is that whenever this indicator moves above 70, it suggests that the precious metals’ rally is ending. In particular, each time after silver’s 2011 top, a move to/above the 70 level and back below it meant that a major top is in.
Now, we haven’t seen a move back below the RSI yet, but it’s obvious that it can’t move back below 70 if it doesn’t rally above it first. Since the RSI just moved a bit above 70, it means that even a relatively small weakness (or at least average performance) of silver against gold can generate a substantial sell signal for the entire precious metals sector.
We didn’t have to wait long for the RSI to slide back below 70 – the move is big and clear and the implications are clearly bearish – just as discussed above. Compared to all cases that we marked on the above chart with red ellipses, the decline that we’ve seen recently is, so far, the smallest of them. If fact, it’s so small that it’s not even comparable to these other cases. What does it tell us? That silver, gold and the rest of the precious metals market have most likely much further to drop.
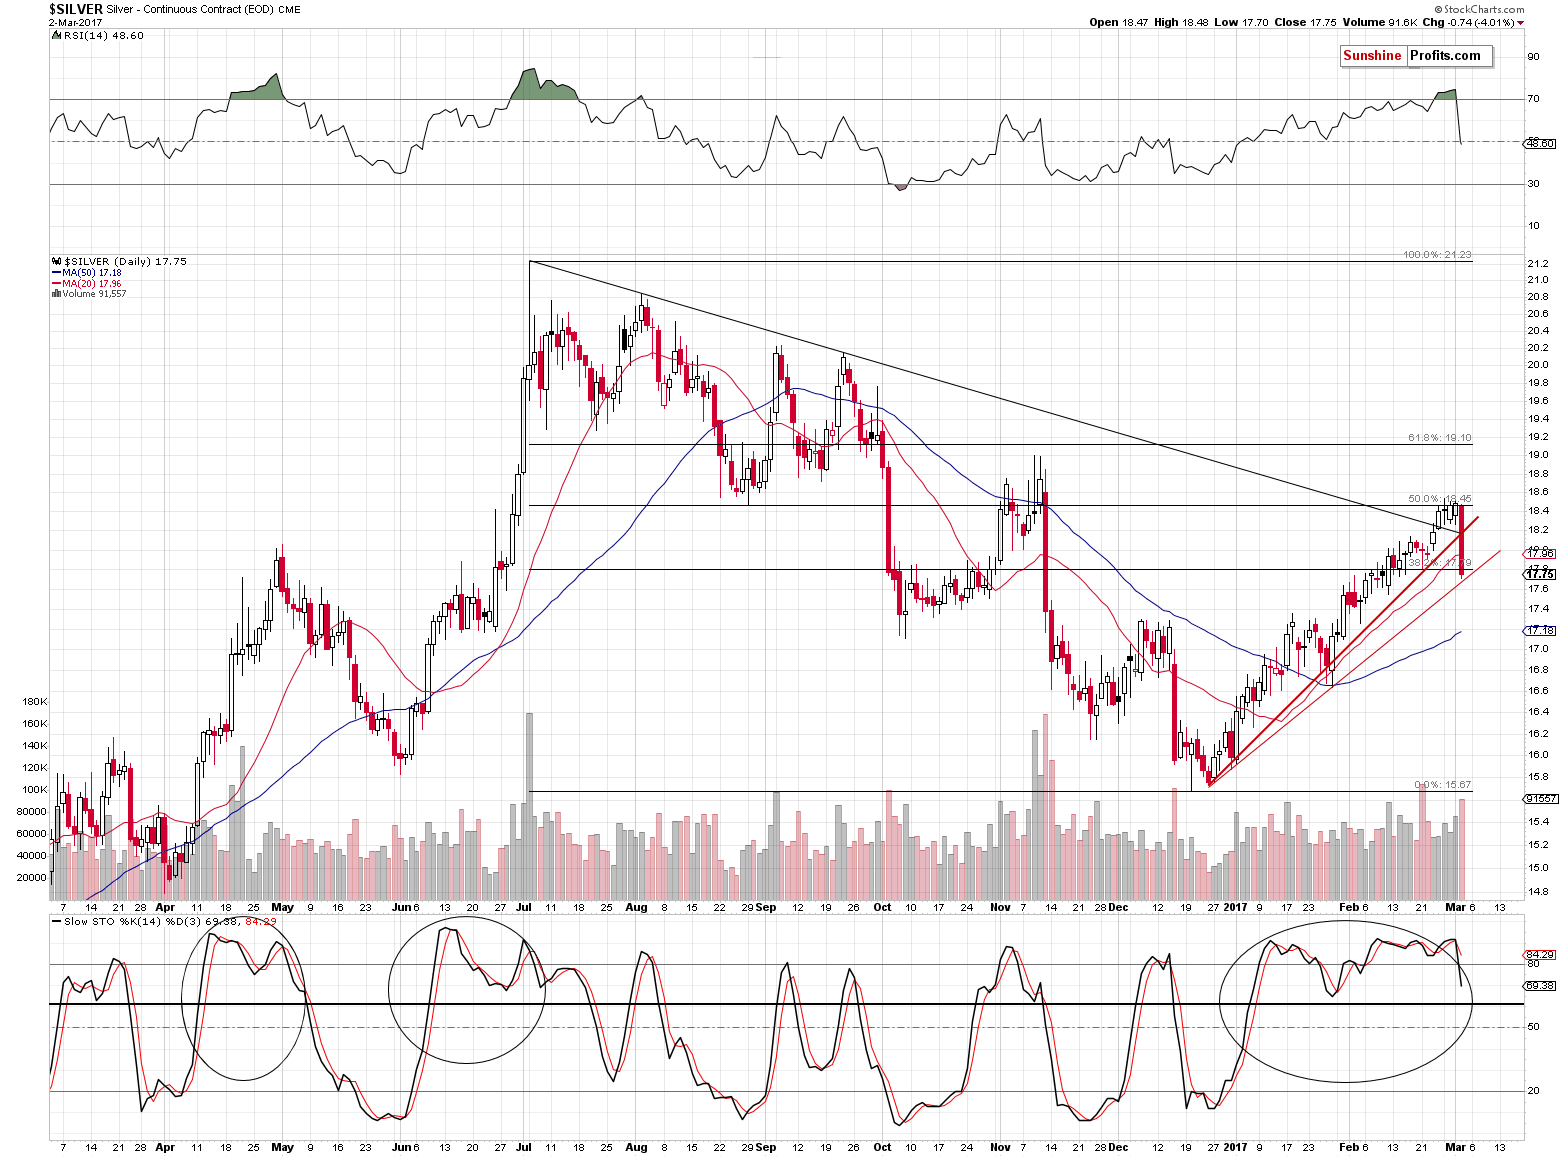
Silver has not only invalidated the tiny breakout above the 50% Fibonacci retracement based on the 2016 decline, but it also invalidated the breakout above the 38.2% retracement and the same goes for the rising support line (thick red line based on the closing prices). Silver didn’t decline below the analogous line based on the intra-day lows, but since the closing prices are generally more important, the implications are strongly bearish anyway, especially that the volume that accompanied yesterday’s slide was significant.
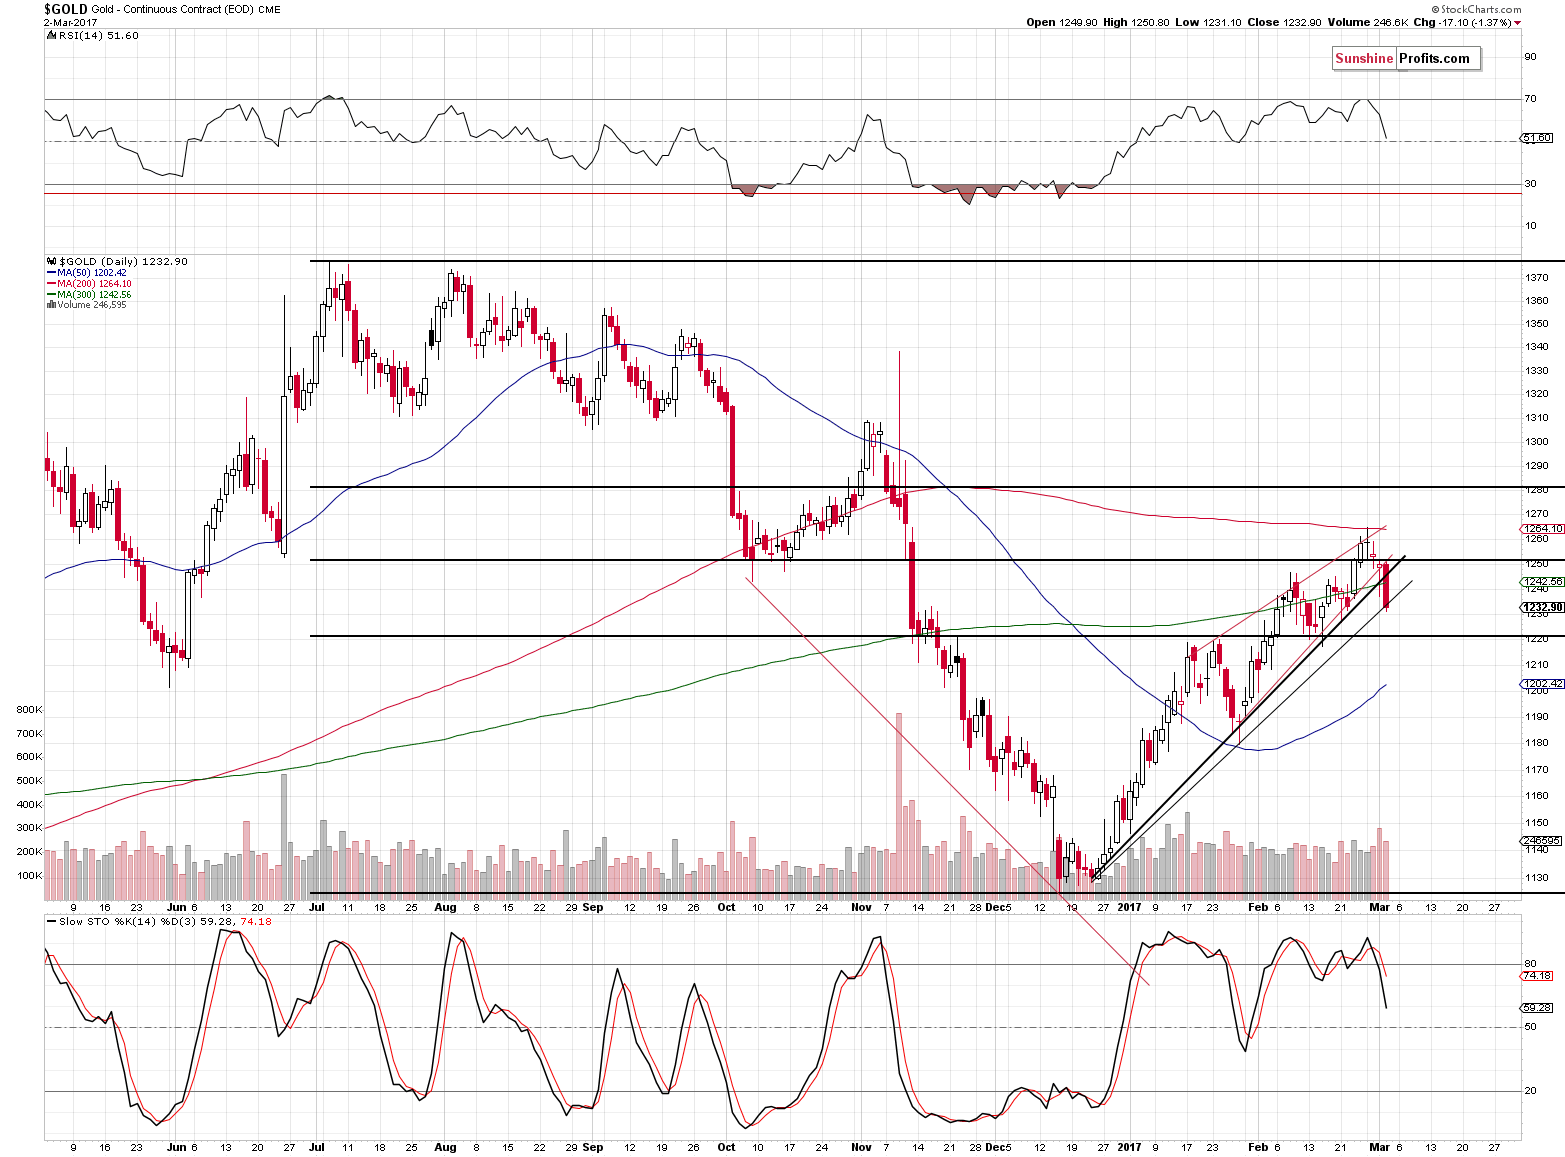
Gold didn’t move back below the 38.2% Fibonacci retracement, but the rest of the comments that we made above about silver still applies – gold closed below the rising support line based on the closing prices, which is more significant than the lack of breakdown below the support line based on the intra-day lows.
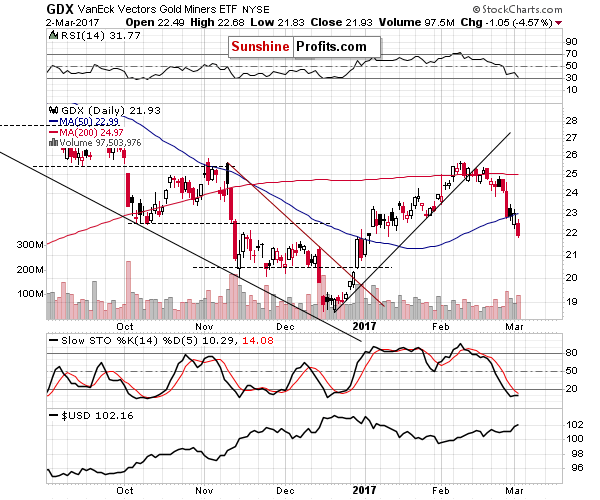
As far as mining stocks are concerned, they – unsurprisingly – declined visibly once again on strong volume, which is a classic bearish sign. Interestingly, yesterday’s close is the third lowest closing price of this year – only 17 cents above the lowest close (Jan. 3).
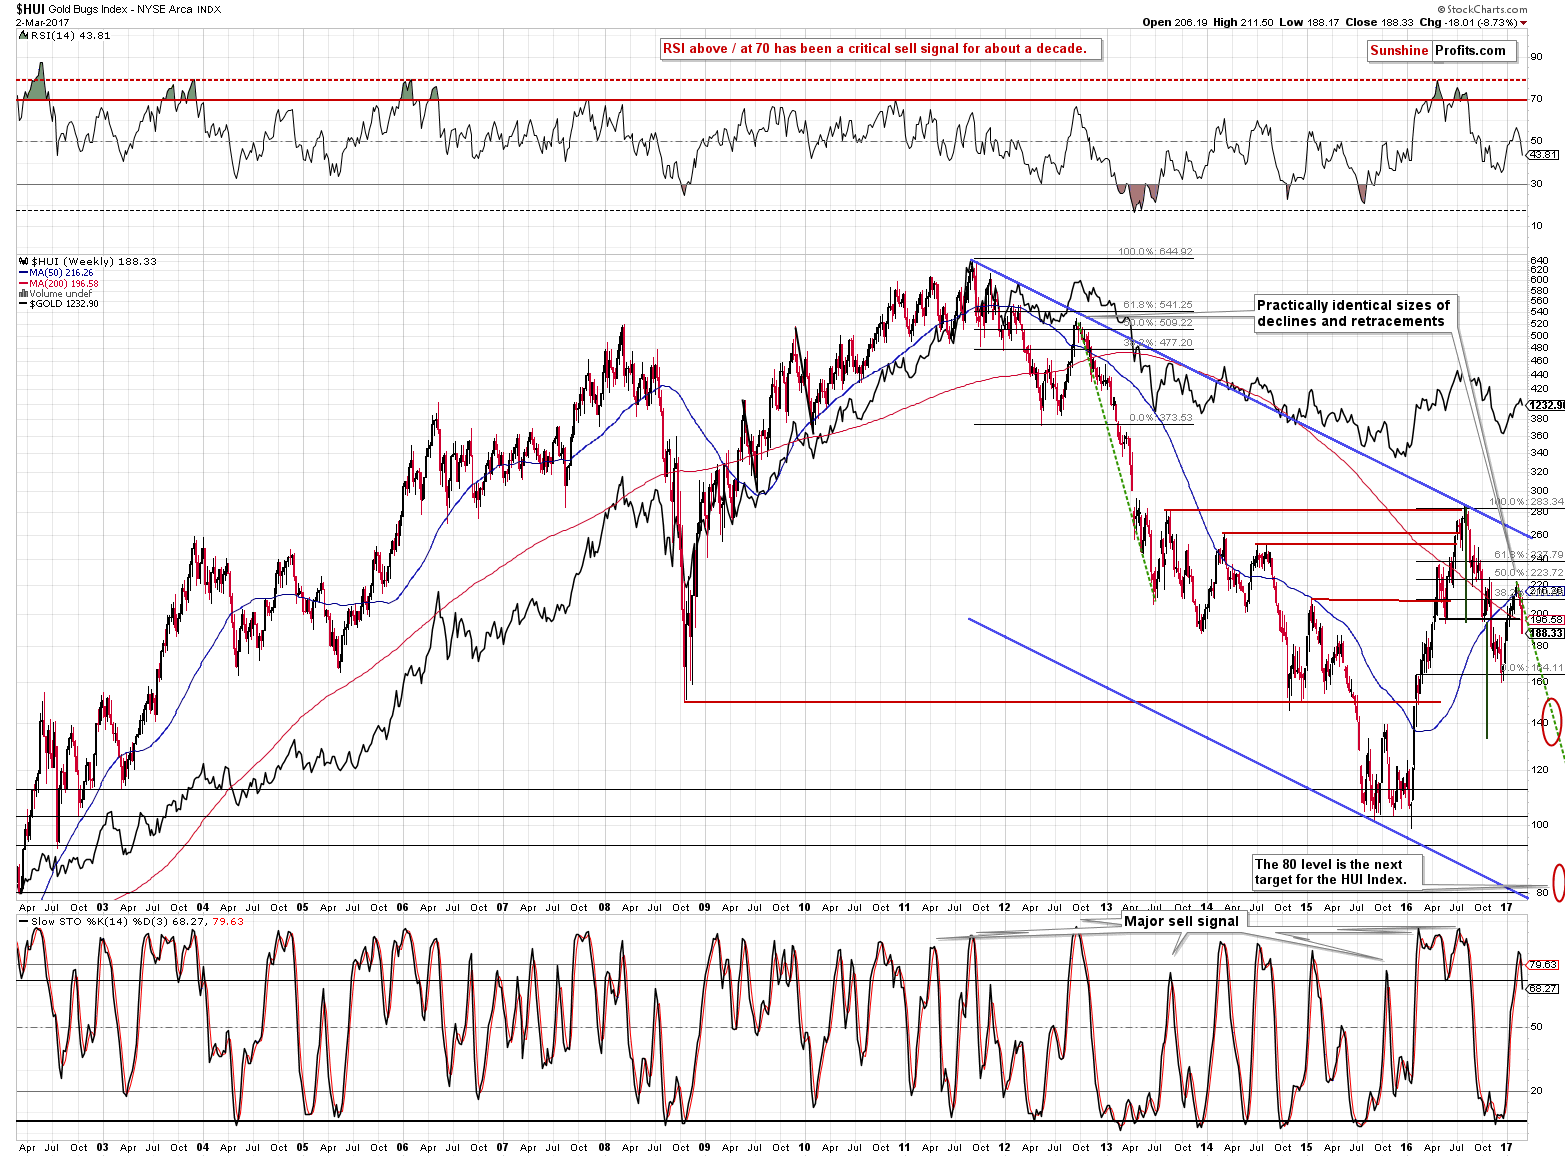
From the long-term perspective, we almost see a major sell signal. “Major”, because the sell signals from the Stochastic indicator based on weekly closing prices have been highly effective (they were not perfect – they didn’t work great in 2016, but still, comparing the number of excellent shorting opportunities that it indicated with the false signals suggests that these signals still remain very important) in the past several years. “Almost”, because the week is not over yet – however, the signal is so clear that it’s obvious that miners would need to reverse in a profound fashion today in order to invalidate it. That’s not likely to happen, i.a., due to what we have on the short-term GDX chart.
Please note that the HUI Index dropped about 100 index points from the 2016 top. It only has to drop 100 more in order to reach our downside target of 80. Sounds impossible? Well, how did the HUI at 200 sound when it was trading above 600 in 2011 and yet here we are with the HUI at 188.
Summing up, we finally saw some decisive action in the metals yesterday and it’s finally not only the mining stock sector that declines in a visible way. Silver’s slide was profound not only by itself, but also through its ratio to gold and the RSI indicator based on it. The latter flashed a major sell signal and we are very likely about to see another one from the HUI Index. This, plus the other factors discussed in the previous alerts imply that the outlook for the precious metals market remains bearish.
As always, we will keep you – our subscribers – informed.
To summarize:
Trading capital (supplementary part of the portfolio; our opinion): Short positions (150% of the full position) in gold, silver and mining stocks are justified from the risk/reward perspective with the following stop-loss orders and initial target price levels / profit-take orders:
- Gold: exit-profit-take level: $1,063; stop-loss: $1,273; initial target price for the DGLD ETN: $81.88; stop-loss for the DGLD ETN $48.17
- Silver: initial target price: $13.12; stop-loss: $18.67; initial target price for the DSLV ETN: $46.18; stop-loss for the DSLV ETN $19.87
- Mining stocks (price levels for the GDX ETF): initial target price: $9.34; stop-loss: $26.34; initial target price for the DUST ETF: $143.56; stop-loss for the DUST ETF $21.37
In case one wants to bet on junior mining stocks' prices (we do not suggest doing so – we think senior mining stocks are more predictable in the case of short-term trades – if one wants to do it anyway, we provide the details), here are the stop-loss details and initial target prices:
- GDXJ ETF: initial target price: $14.13; stop-loss: $45.31
- JDST ETF: initial target price: $104.26; stop-loss: $10.78
Long-term capital (core part of the portfolio; our opinion): No positions (in other words: cash)
Insurance capital (core part of the portfolio; our opinion): Full position
Please note that the in the trading section we describe the situation for the day that the alert is posted. In other words, it we are writing about a speculative position, it means that it is up-to-date on the day it was posted. We are also featuring the initial target prices, so that you can decide whether keeping a position on a given day is something that is in tune with your approach (some moves are too small for medium-term traders and some might appear too big for day-traders).
Plus, you might want to read why our stop-loss orders are usually relatively far from the current price.
Please note that a full position doesn’t mean using all of the capital for a given trade. You will find details on our thoughts on gold portfolio structuring in the Key Insights section on our website.
As a reminder – “initial target price” means exactly that – an “initial” one, it’s not a price level at which we suggest closing positions. If this becomes the case (like it did in the previous trade) we will refer to these levels as levels of exit orders (exactly as we’ve done previously). Stop-loss levels, however, are naturally not “initial”, but something that, in our opinion, might be entered as an order.
Since it is impossible to synchronize target prices and stop-loss levels for all the ETFs and ETNs with the main markets that we provide these levels for (gold, silver and mining stocks – the GDX ETF), the stop-loss levels and target prices for other ETNs and ETF (among other: UGLD, DGLD, USLV, DSLV, NUGT, DUST, JNUG, JDST) are provided as supplementary, and not as “final”. This means that if a stop-loss or a target level is reached for any of the “additional instruments” (DGLD for instance), but not for the “main instrument” (gold in this case), we will view positions in both gold and DGLD as still open and the stop-loss for DGLD would have to be moved lower. On the other hand, if gold moves to a stop-loss level but DGLD doesn’t, then we will view both positions (in gold and DGLD) as closed. In other words, since it’s not possible to be 100% certain that each related instrument moves to a given level when the underlying instrument does, we can’t provide levels that would be binding. The levels that we do provide are our best estimate of the levels that will correspond to the levels in the underlying assets, but it will be the underlying assets that one will need to focus on regarding the signs pointing to closing a given position or keeping it open. We might adjust the levels in the “additional instruments” without adjusting the levels in the “main instruments”, which will simply mean that we have improved our estimation of these levels, not that we changed our outlook on the markets. We are already working on a tool that would update these levels on a daily basis for the most popular ETFs, ETNs and individual mining stocks.
Our preferred ways to invest in and to trade gold along with the reasoning can be found in the how to buy gold section. Additionally, our preferred ETFs and ETNs can be found in our Gold & Silver ETF Ranking.
As always, we'll keep you - our subscribers - updated should our views on the market change. We will continue to send out Gold & Silver Trading Alerts on each trading day and we will send additional Alerts whenever appropriate.
The trading position presented above is the netted version of positions based on subjective signals (opinion) from your Editor, and the Tools and Indicators.
As a reminder, Gold & Silver Trading Alerts are posted before or on each trading day (we usually post them before the opening bell, but we don't promise doing that each day). If there's anything urgent, we will send you an additional small alert before posting the main one.
=====
Latest Free Trading Alerts:
The Greek crisis has not ended and we could hear about it again this year. What does it mean for the gold market?
Gold seems to be at crossroads right now and there are both bullish and bearish arguments for its prospects. Will gold shine as a safe-haven asset thanks to political uncertainty about Trump’s actions, and the downward risks in Europe (such as elections in France and Germany)? Or will we see acceleration in global growth led by the United States and see Fed tightening which will send gold prices south? We invite you to read our today’s article about the interplay of different factors on the gold market and find out which driver is likely to prevail.
Macroeconomic Outlook and Gold
=====
Hand-picked precious-metals-related links:
Gold price correction sinks mining stocks
PRECIOUS-Gold heading for worst week since Nov on rate hike worries
US auto sales drive Palladium prices in February
=====
In other news:
Three reasons the Fed wants to hike rates in March
UK will trigger article 50 by end of March: Brexit minister
Euro zone January retail sales unexpectedly drop for third straight month
=====
Thank you.
Sincerely,
Przemyslaw Radomski, CFA
Founder, Editor-in-chief, Gold & Silver Fund Manager
Gold & Silver Trading Alerts
Forex Trading Alerts
Oil Investment Updates
Oil Trading Alerts

