

Briefly: In our opinion speculative short positions (full) in gold, silver and mining stocks are currently justified from the risk/reward point of view.
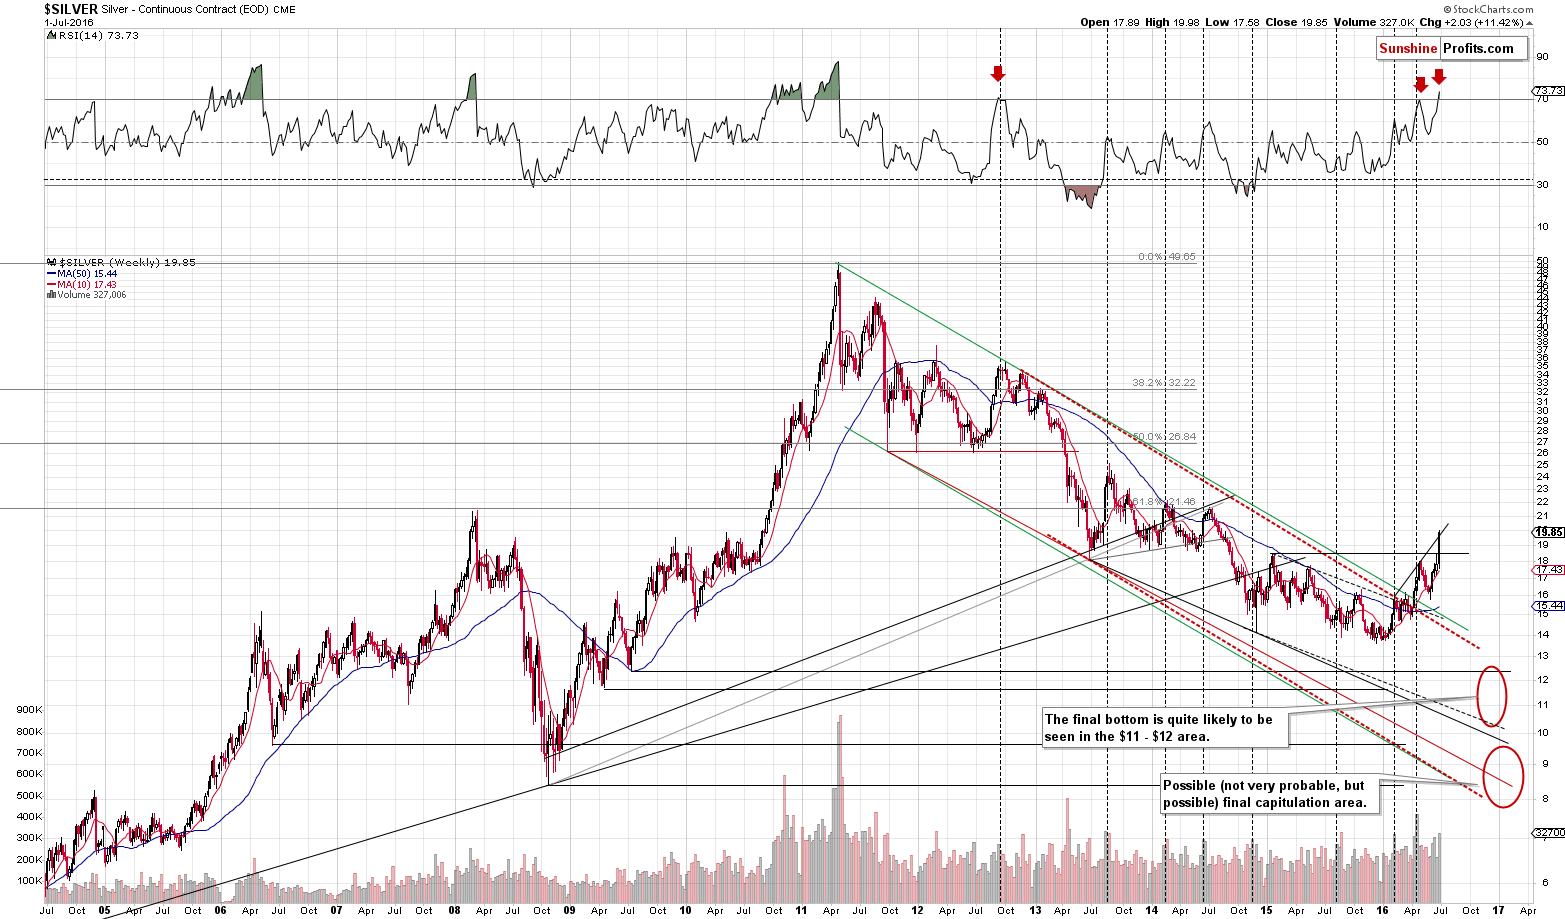
While gold didn’t move above the Brexit-anxiety-caused high, silver soared last week, almost moving to the $20 level and silver’s close on Friday was the highest weekly close of the year. Silver futures moved to about $21 in yesterday’s trading - the rally was extremely sharp. What can we infer from this rally and the level that silver reached?
In short, this rally is less significant than it appears. The move was sizable and volatile, but since it is usually the case that final parts of an upswing are accompanied by silver’s outperformance, it could be the case that silver’s rally is a bearish confirmation instead of being a bullish sign.
Let’s take a closer look at silver’s long-term chart (charts courtesy of http://stockcharts.com).
Generally, our Friday’s comments on the above chart remain up-to-date:
(…) Silver broke a little above the previous 2015 high, but since silver is known for fake breakouts, we don’t think that’s particularly important.
Please note that the RSI indicator recently flashed a medium-term sell signal, just like it was the case in the second half of 2012. In 2012, after that signal, silver declined and moved higher once again before continuing the decline. The same would have most likely happened also this time if it wasn’t for the Brexit voting and its result. What did Brexit change in this case? We saw an additional daily rally. Where would be silver if it wasn’t for this particular rally? It would most likely be below the previous 2015 low, thus repeating the 2012 pattern.
Silver was already very overbought on a medium-term basis and it was about to decline, but Brexit gave it an additional boost. However, a single boost is not something that changes the situation on the market. Given that RSI moved to 70, silver is still likely to decline, but the difference between 2012 and now is that this time the second local top before the decline is higher – the bearish implications of the overbought situation as indicated previously by the RSI indicator remain in place.
What happened since we published the above? Silver moved even higher, but it doesn’t invalidate the above. The area around the $19 level is rich in resistance levels – important lows of 2013 and 2014. Consequently, the reply to the question from the opening paragraph is that $20 level is most likely too high for silver right now. Our positions in silver were closed well below the current price and due to silver’s volatile nature we are not automatically re-opening them at this time (silver could move even higher very temporarily), but we we will likely do so shortly.
Please note that the RSI indicator was almost at the 70 level yesterday and based on today’s pre-market move it is most likely already at or a bit above 70, which is a sign that the rally is already over or very close to being over.
On Friday, silver rallied and indeed almost moved to the mentioned $20 level. It sold off a bit later during the session, closing more or less at the rising support line based on this year’s local highs.
The RSI indicator shows extremely overbought levels, suggesting that a turnaround is just around the corner.
What happened on Monday and what’s happening today? At the same time, a lot and nothing. Nothing, because at the moment of writing these words, silver is trading at $19.81, which is more or less where it closed on Friday. A lot, because Monday’s session was a major intra-day reversal that most likely marked the end of the rally. The session was not included on the chart by the chart provider, but silver moved to $21 temporarily and closed at about $20.30, which formed a massive shooting star candlestick, which is a clear reversal sign.
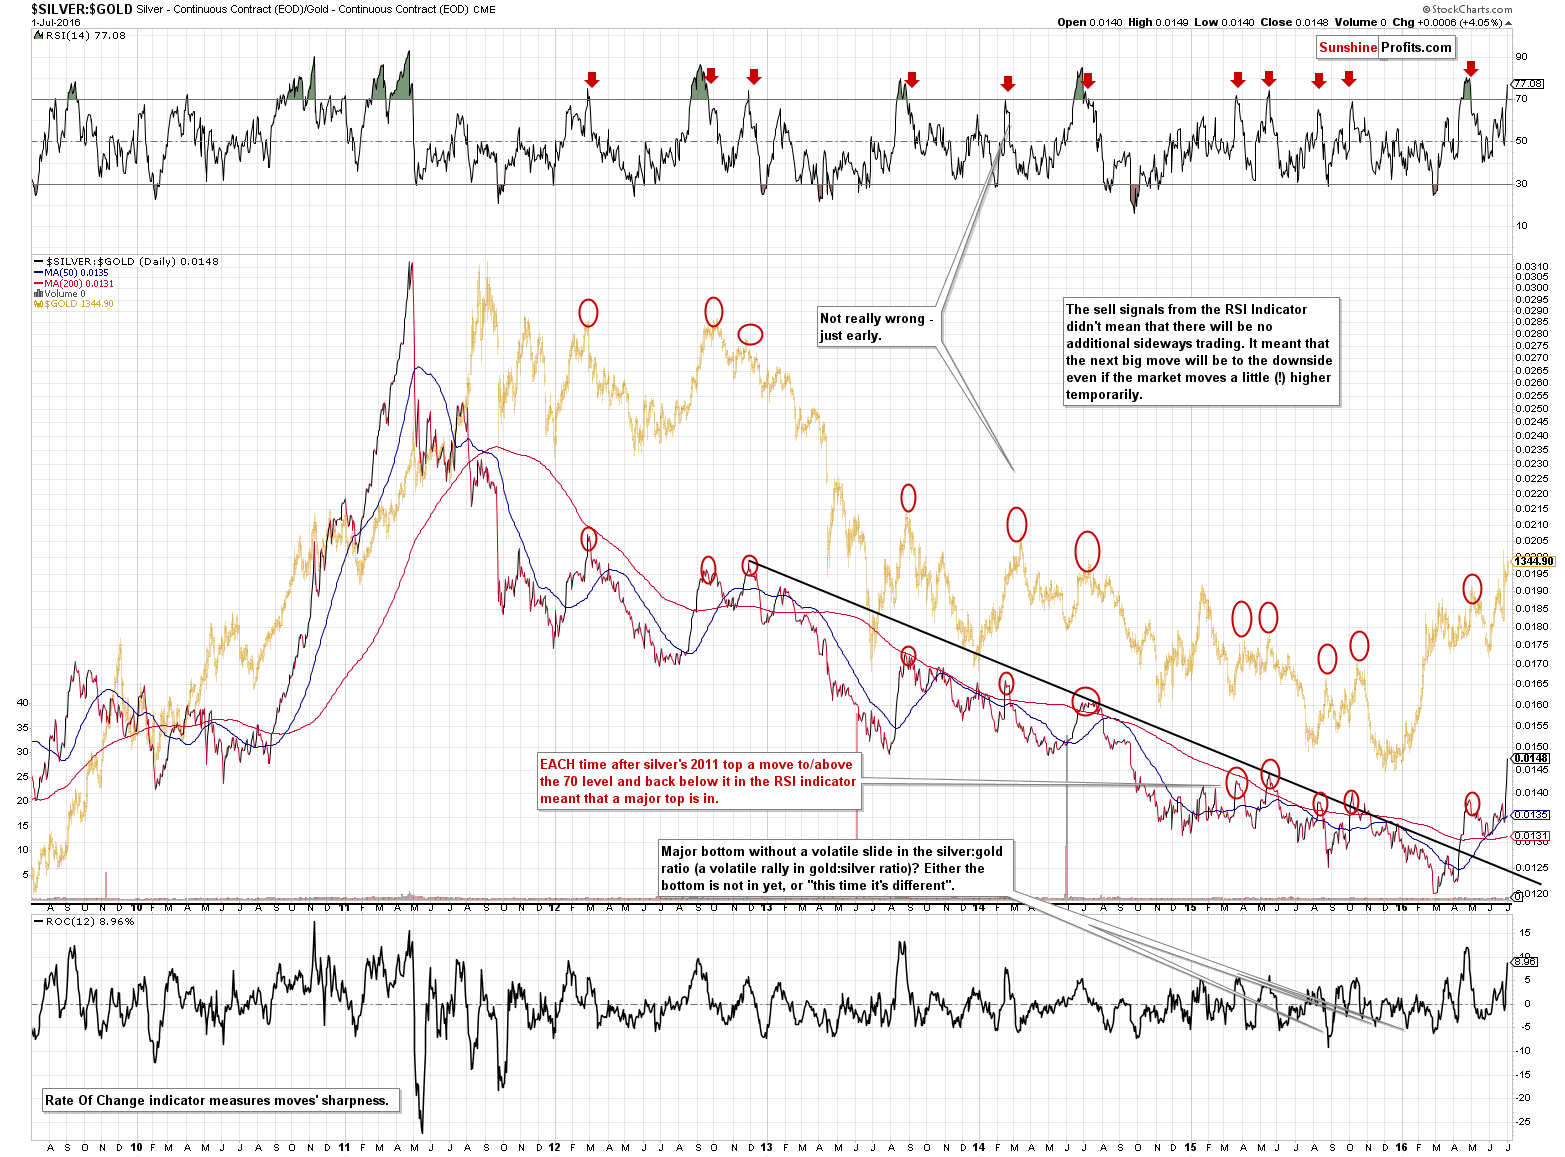
Moving back to the RSI indicator - we can say exactly the same about the RSI based on the silver to gold ratio – it also moved almost to the 70 level last week. The moves in the RSI back below 70 are strong sell signals with very good accuracy. Moves back below 70 served as a confirmation of the bearish signal – we have yet to see this signal, but given the resistance reached on Friday in silver ($20) and in the ratio itself (approximately the 2013 low). Given Monday’s rally, the RSI indicator based on the ratio would likely move above the 80 level or so, which is an even more extreme level and an even clearer sell sign.
As far as similarity to late 2012 is concerned, please note that back then we saw a rally in both the silver to gold ratio and the RSI indicator based on it, just as we are seeing now.
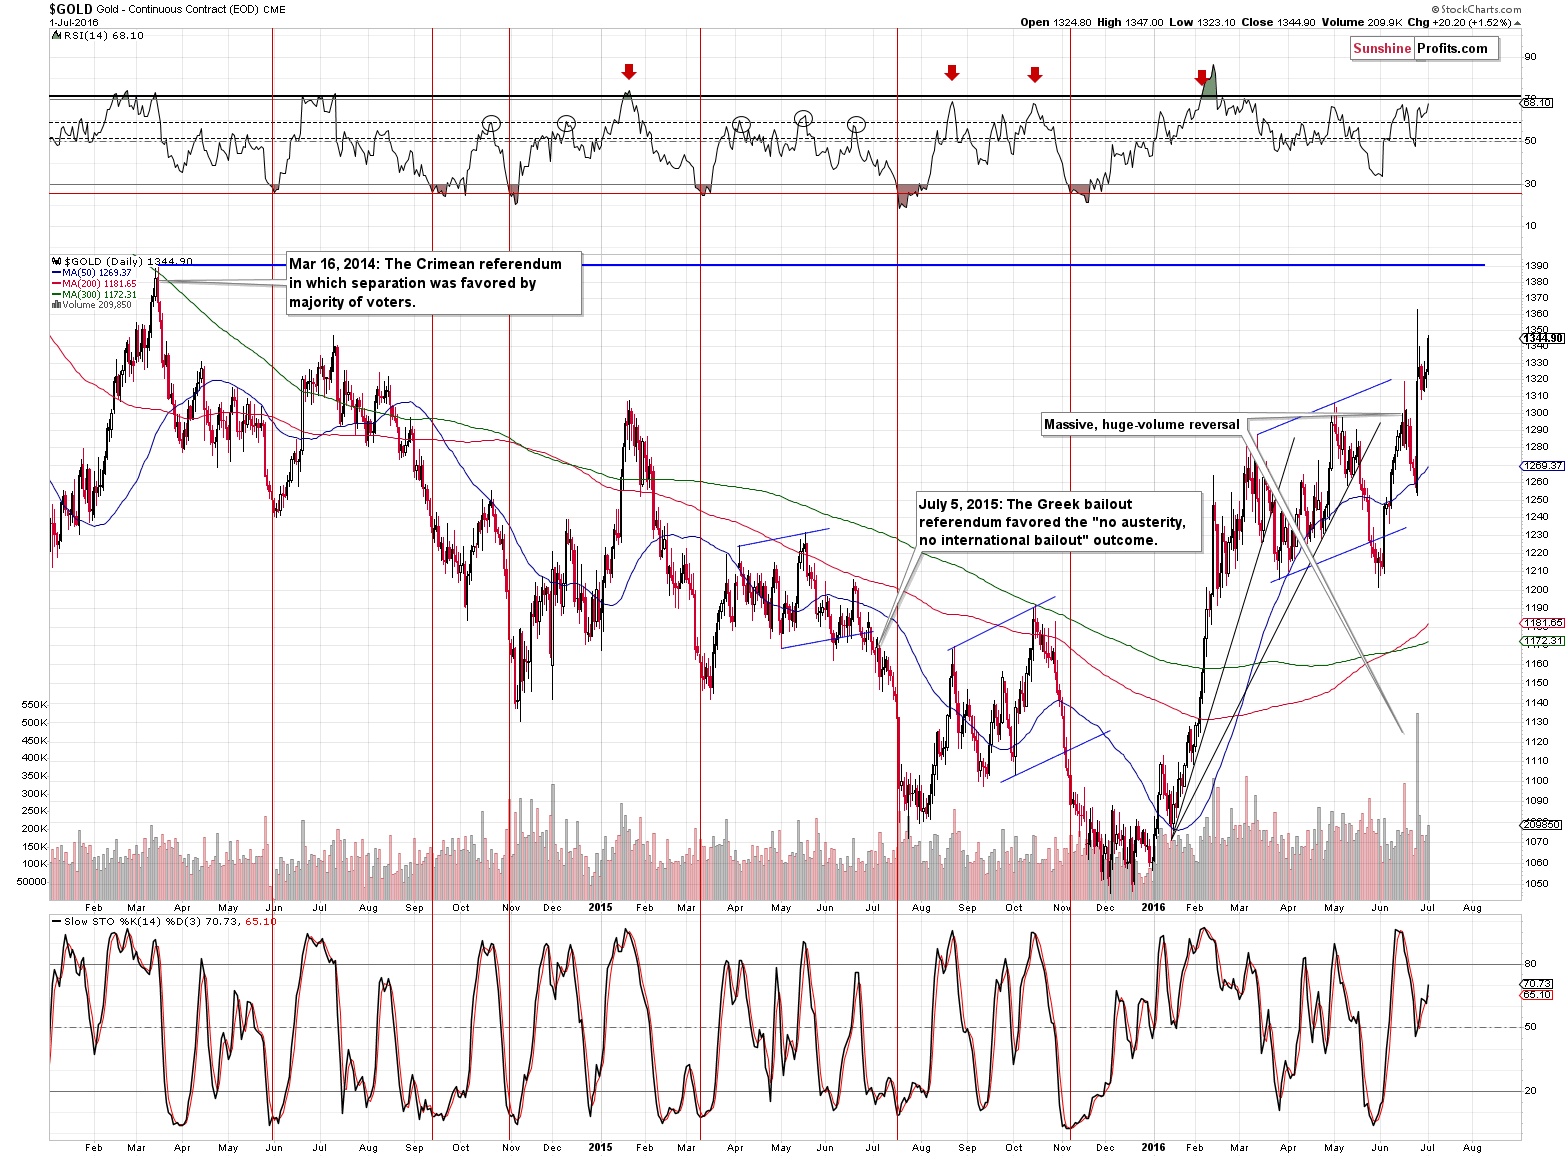
Gold moved higher on Friday – the move was nowhere close to the big rally in silver, but it was a close above the previous highest close of the year. It wasn’t a move above last Friday’s intra-day high, though, so there was no true breakout. The volume that accompanied the move higher is nothing to call home about either. It still appears that the rally is more or less another post-top-anxiety upswing preceding the decline.
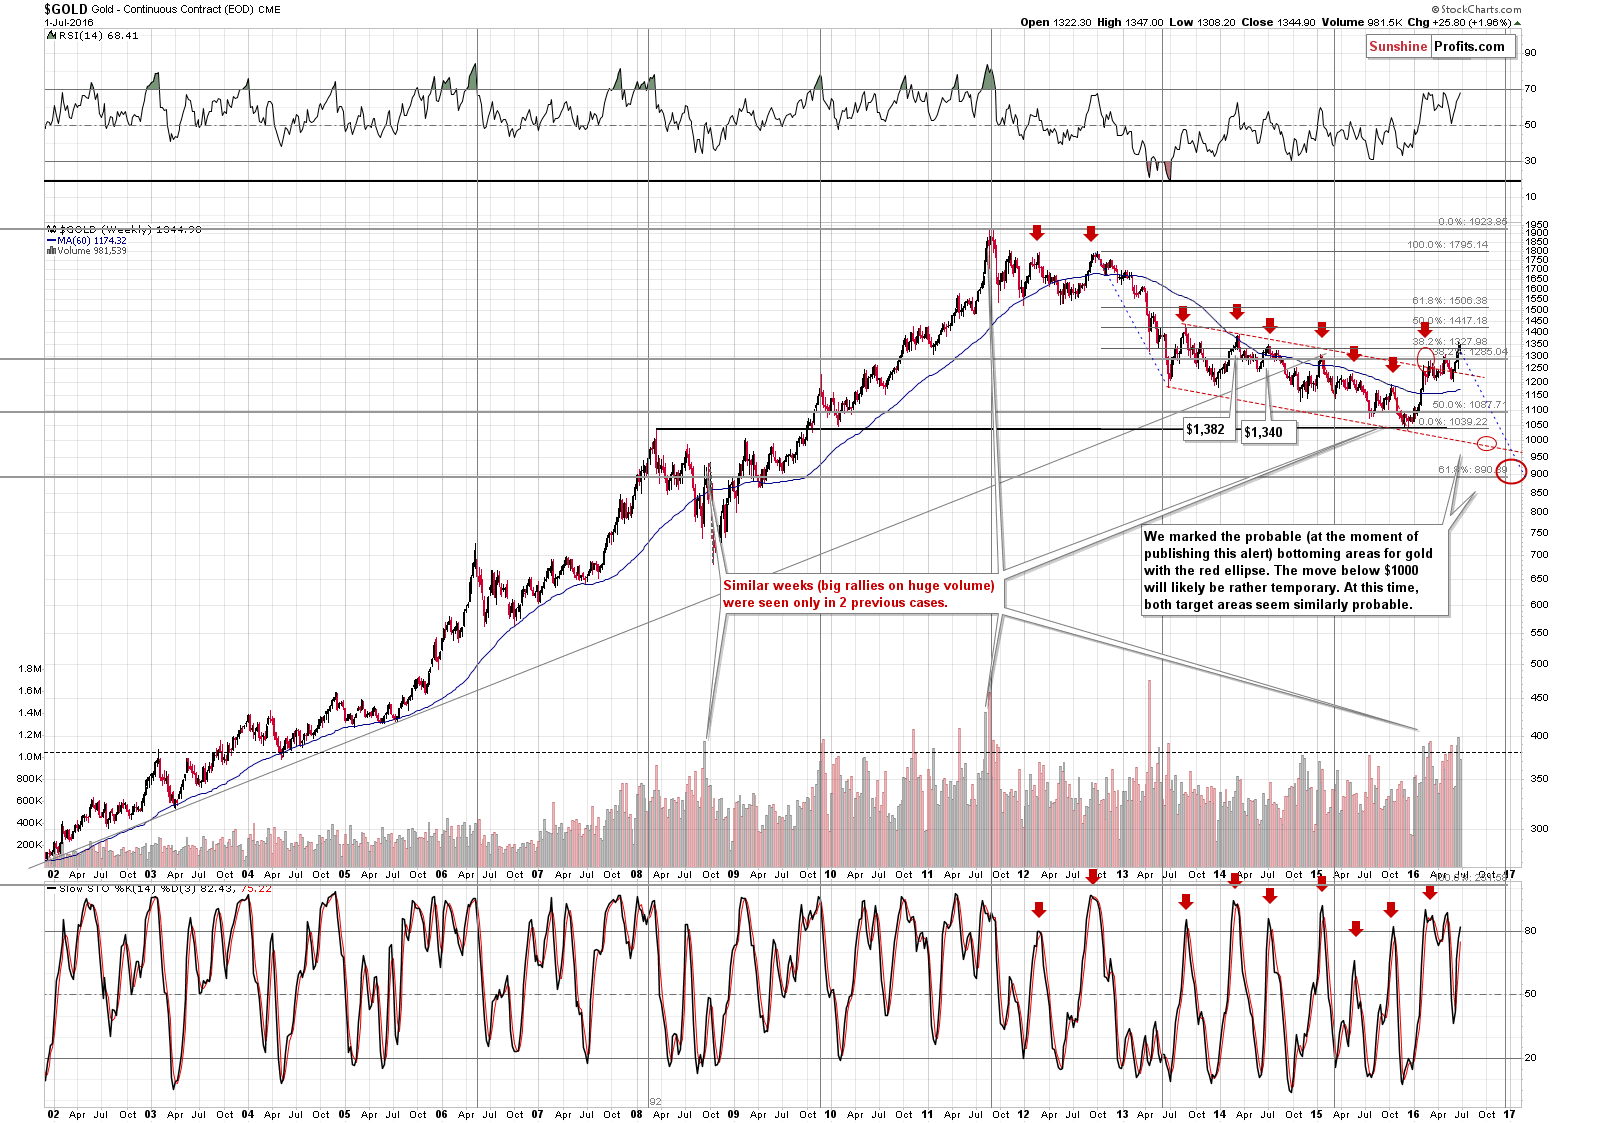
From the long-term point of view it appears that nothing changed on the above chart as the breakout above the 38.2% Fibonacci retracement was not confirmed (only 1 daily close above this level). The Stochastic indicator moved above the 80 level suggesting that a local top was just around the corner.
However, there is something else regarding the above chart that should get more attention that it does. Before providing you with the next chart, let us re-emphasize that gold tends to repeat its price moves. At times it does it to the letter, but in most cases it is the shape of the move that matters the most. This self-similarity pattern phenomenon can provide a roadmap of the following events – if we detect that we have one that is (Fractalyzer does that automatically, but some things can be also detected manually). Now, with the above in mind, let’s take an additional look at the above chart with an additional chart plotted on it (courtesy of http://chartsrus.com).
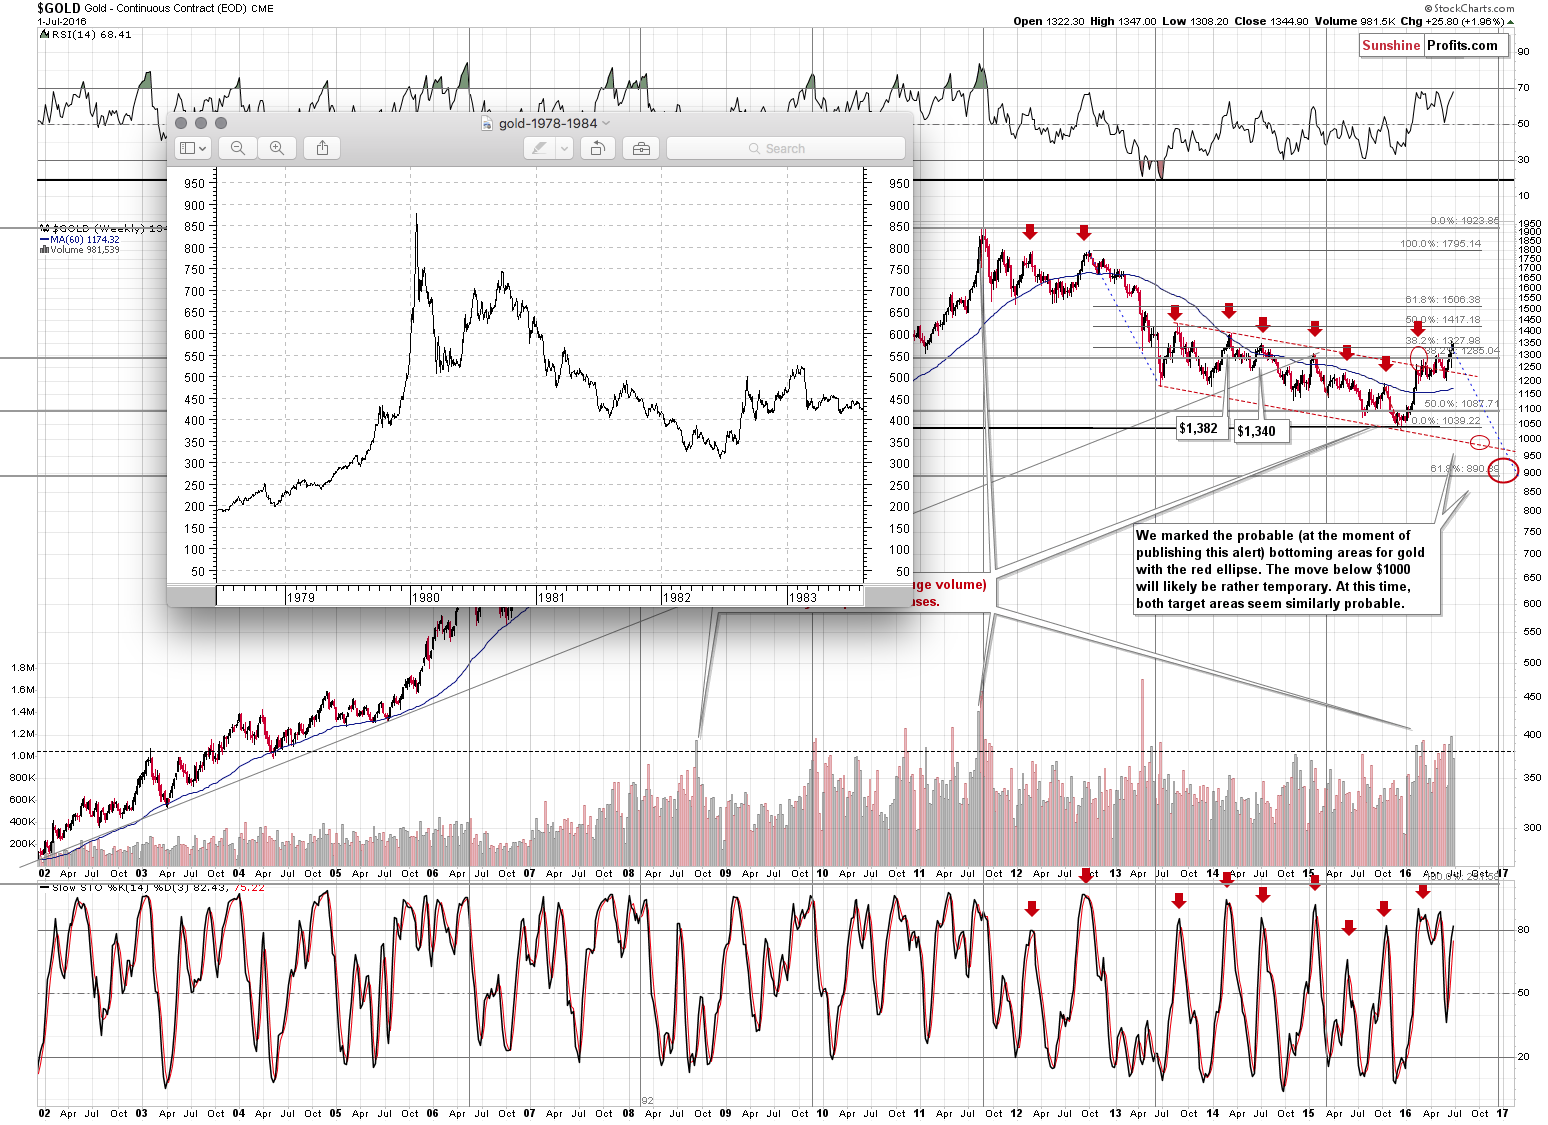
…and now let’s take another look with a linear scale on the main chart instead of a logarithmic one (the plotted chart is in linear scale).
There are multiple similarities in the pattern: the parabolic upswing, the 2 tops that followed it, the initial big decline after a breakdown below the initial low, followed by a less steep decline. In both cases after the “final” bottom, the initial rally was very sharp, then we saw some sideways movement and then an additional rally a bit above the previous high.
The above makes the 2 cases very similar already, but that’s not all there is to it. Both post-bottom rallies took a little move than 6 months before the decline resumed. How high did gold rally initially in both cases? More or less to the first visible local high.
The pattern is from the end of the previous bull market (1980 top) and what followed it and while we don’t think the bull market is completely over this time, the emotions that accompanied investors in 1980 are similar to those at the 2011 top. Consequently, there are good reasons to think that the price patterns after these tops can be similar.
What does the similarity mean? That the price pattern is likely to continue, so the follow-up action in the price pattern from the past can tell us a lot about what’s likely to follow.
What is likely to happen next? The same thing – or something very similar to it – that happened in the past after this pattern. In the past, gold rallied only a little above the previous high (the one that formed after the initial sharp rally) and then it topped. After that gold moved to new lows.
We already wrote that back then the rally was in place for a bit above 6 months and the same is the case right now. Consequently, the time may be up for the rally. To be clear, since the entire pattern is very similar but not identical, it could be the case that gold doesn’t decline for another month or so and it would not invalidate the pattern or make the subsequent decline less likely based on it. Overall, the time requirement for the top to be in, is fulfilled.
What about the price? In the past gold moved more or less to the 38.2% Fibonacci retracement level based on the decline and gold is very close to this level also this time. Besides, the second and final top took form above the lowest of the previous local tops, but below the highest local top. That’s where gold is right now as well. Moreover, even if gold rallies a bit more from here, it will still remain within the above pattern.
So, what are the implications of the above? The clear implication is that gold is likely to decline (if not right away, then still rather soon) and the decline is quite likely to take gold to new lows.
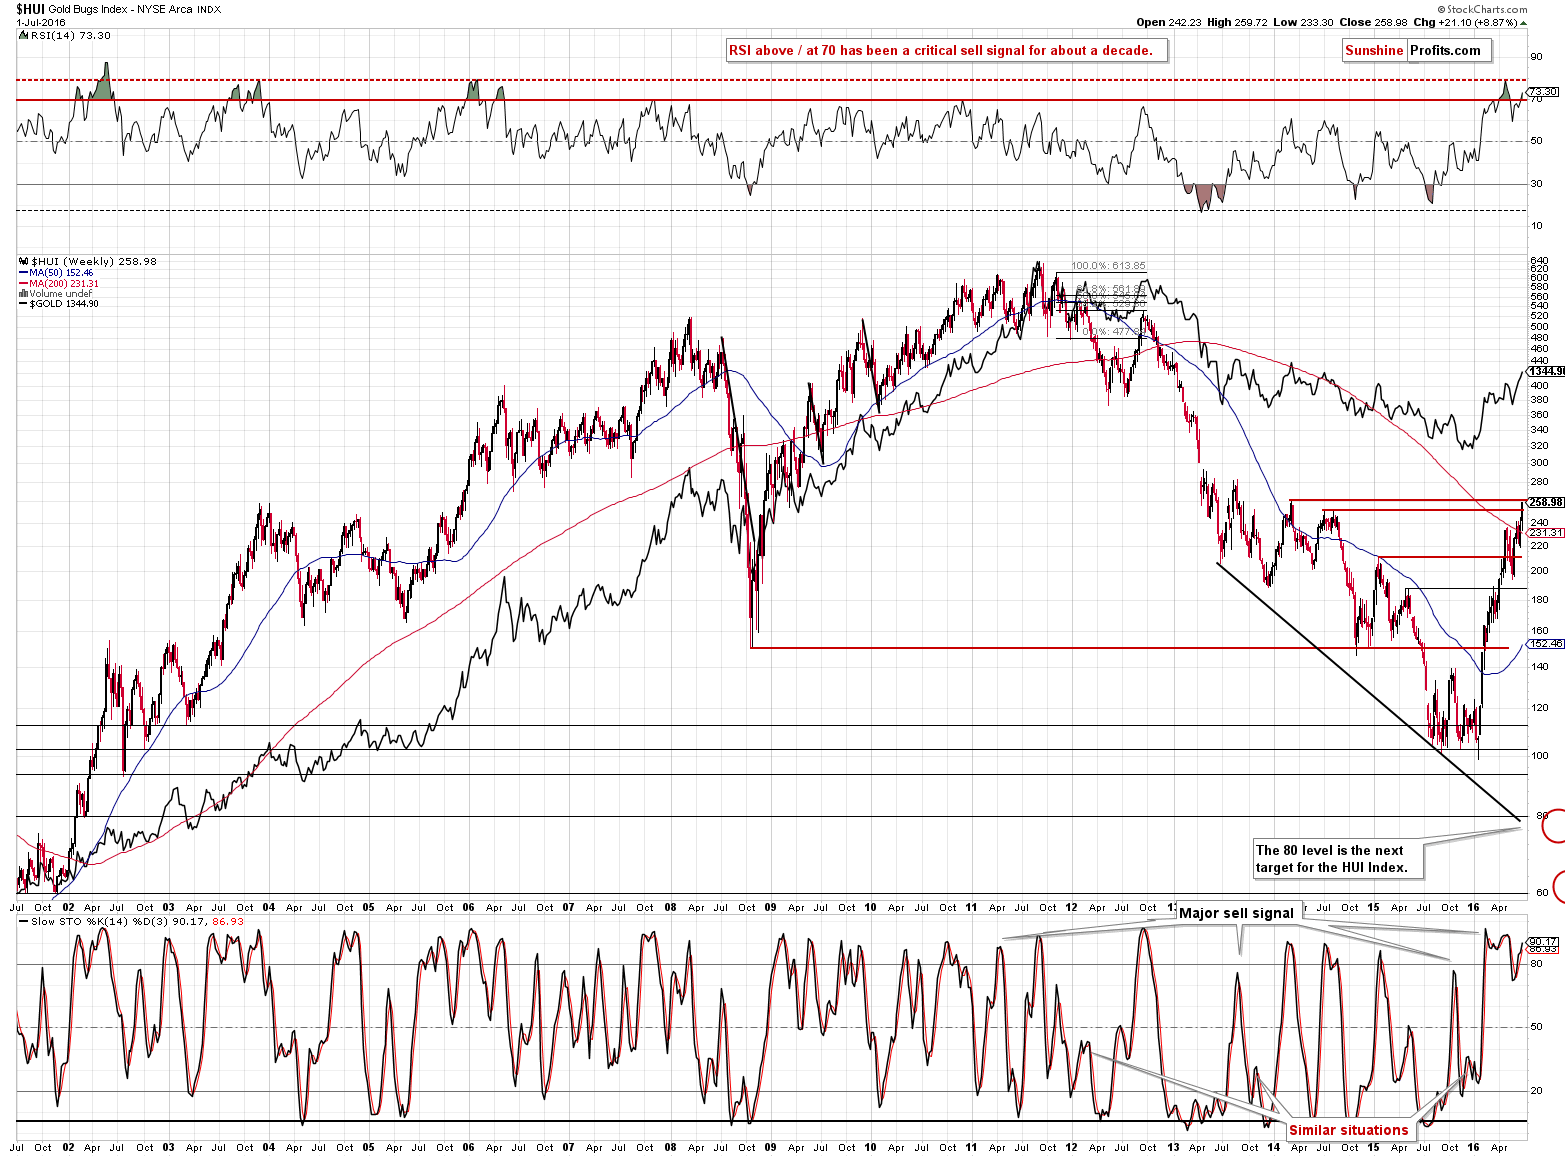
What about gold stocks? Since silver soared and gold moved higher, miners almost “had to” move higher as well. However, their rally was stopped by another high – the 2014 high. Consequently, it doesn’t seem that mining stocks are really breaking out just yet even though they moved above the previous 2016 high. In other words, the mining stocks’ action doesn’t invalidate the points made earlier today.
Summing up, silver’s recent performance looks exactly like what one would expect to see at a major top not only in silver, but in the entire precious metals market and the similarity between the current situation and the very similar price pattern from 1982 confirms this scenario.
The trading positions in silver might have been closed on Monday (or not, depending on the instrument used) and if it was the case, we think that re-opening the position is justified from the risk to reward point of view.
As always, we will keep you – our subscribers – updated.
To summarize:
Trading capital (our opinion): Short positions (full position) in gold, silver, and mining stocks are justified from the risk/reward perspective with the following entry prices, stop-loss orders and initial target price levels:
- Gold: initial target price: $1,006; stop-loss: $1,423, initial target price for the DGLD ETN: $86.30; stop-loss for the DGLD ETN $44.35
- Silver: initial target price: $12.13; stop-loss: $20.32; initial target price for the DSLV ETN: $65.88; stop-loss for the DSLV ETN $20.27
- Mining stocks (price levels for the GDX ETF): initial target price: $9.34; stop-loss: $30.77, initial target price for the DUST ETF: $47.90; stop-loss for the DUST ETF $3.62
In case one wants to bet on junior mining stocks' prices (we do not suggest doing so – we think senior mining stocks are more predictable in the case of short-term trades – if one wants to do it anyway, we provide the details), here are the stop-loss details and initial target prices:
- GDXJ ETF: initial target price: $14.13; stop-loss: $50.70
- JDST ETF: initial target price: $61.74; stop-loss: $1.97
Long-term capital (our opinion): No positions
Insurance capital (our opinion): Full position
Plus, you might want to read why our stop-loss orders are usually relatively far from the current price.
Please note that a full position doesn’t mean using all of the capital for a given trade. You will find details on our thoughts on gold portfolio structuring in the Key Insights section on our website.
As a reminder – “initial target price” means exactly that – an “initial” one, it’s not a price level at which we suggest closing positions. If this becomes the case (like it did in the previous trade) we will refer to these levels as levels of exit orders (exactly as we’ve done previously). Stop-loss levels, however, are naturally not “initial”, but something that, in our opinion, might be entered as an order.
Since it is impossible to synchronize target prices and stop-loss levels for all the ETFs and ETNs with the main markets that we provide these levels for (gold, silver and mining stocks – the GDX ETF), the stop-loss levels and target prices for other ETNs and ETF (among other: UGLD, DGLD, USLV, DSLV, NUGT, DUST, JNUG, JDST) are provided as supplementary, and not as “final”. This means that if a stop-loss or a target level is reached for any of the “additional instruments” (DGLD for instance), but not for the “main instrument” (gold in this case), we will view positions in both gold and DGLD as still open and the stop-loss for DGLD would have to be moved lower. On the other hand, if gold moves to a stop-loss level but DGLD doesn’t, then we will view both positions (in gold and DGLD) as closed. In other words, since it’s not possible to be 100% certain that each related instrument moves to a given level when the underlying instrument does, we can’t provide levels that would be binding. The levels that we do provide are our best estimate of the levels that will correspond to the levels in the underlying assets, but it will be the underlying assets that one will need to focus on regarding the sings pointing to closing a given position or keeping it open. We might adjust the levels in the “additional instruments” without adjusting the levels in the “main instruments”, which will simply mean that we have improved our estimation of these levels, not that we changed our outlook on the markets. We are already working on a tool that would update these levels on a daily basis for the most popular ETFs, ETNs and individual mining stocks.
Our preferred ways to invest in and to trade gold along with the reasoning can be found in the how to buy gold section. Additionally, our preferred ETFs and ETNs can be found in our Gold & Silver ETF Ranking.
As always, we'll keep you - our subscribers - updated should our views on the market change. We will continue to send out Gold & Silver Trading Alerts on each trading day and we will send additional Alerts whenever appropriate.
The trading position presented above is the netted version of positions based on subjective signals (opinion) from your Editor, and the Tools and Indicators.
As a reminder, Gold & Silver Trading Alerts are posted before or on each trading day (we usually post them before the opening bell, but we don't promise doing that each day). If there's anything urgent, we will send you an additional small alert before posting the main one.
=====
Latest Free Trading Alerts:
The Brexit vote sent more bond yields into negative territory. What does it mean for the gold market?
Brexit, Negative Yields and Gold
S&P 500 index continued its week-long rally on Friday, as investors shrugged off "Brexit" news. Will it continue higher? Or is this some medium-term topping pattern before downward reversal?
Stock Trading Alert: S&P 500 Index Back At 2,100 Mark, Will It Continue Higher?
=====
Hand-picked precious-metals-related links:
Silver Slumps After Best Two-Day Jump Since ’11 as Gold Slides
HSBC raises 2016, 2017 gold price forecasts
Shocking Breakdown Of China's Foreign Reserves Is Bullish For Gold
Net long gold positions on COMEX edge 4% higher to fresh record high: CFTC
=====
In other news:
Treasury 30-Year Yield Falls to Record as Payrolls Test Looms
A Prime Minister, a Referendum and Italy’s Turn to Get Worried
Reserve Bank of Australia stays pat, as expected, after tight election
Exclusive: Banks saw unprecedented step up in market supervision around UK vote
ECB asks Italy's Monte dei Paschi to slash bad loans
Europe's Asset-Backed Bond Market Is Growing More Mysterious
Black Swans and Game Theory: A Post-Brexit Guide to Bond Trading
Brexit Accelerates the British Pound’s 100 Years of Debasement
Brexit Crisis Seen Forcing Sweden to Keep Negative Rates Longer
Venezuela Refuses to Default. Few People Seem to Understand Why.
Forget Brexit, China's currency is falling again
Rally or Bear Trap? How to Spot the Hidden Dangers Ahead
=====
Thank you.
Sincerely,
Przemyslaw Radomski, CFA
Founder, Editor-in-chief, Gold & Silver Fund Manager
Gold & Silver Trading Alerts
Forex Trading Alerts
Oil Investment Updates
Oil Trading Alerts

