

Briefly: In our opinion speculative short positions (full) are currently justified from the risk/reward point of view.
The unlikely outcome of the Brexit vote turned out to be true and it was the key event that impacted precious metals price moves last week. Before the vote, gold and silver were declining, but Brexit seems to have changed everything – or did it?
In short, the “Brexit” result does not directly imply UK’s exit from the EU and you can read details in today’s Gold News Monitor, so a lot of Friday’s price action was likely an overreaction and even if it wasn’t the case, the odds still are that the maximum uncertainty was reached when the votes were being counted. Consequently, the odds are that the top is in – just like it was the case with previous important European votes. We’d like to quote our Friday’s alert as it remains up-to-date:
In order to better understand the implications of any event its best to see if something similar has already been done in the past. Of course, no 2 days, years or events are exactly the same, but they can be similar enough to draw some conclusions. For instance, despite many years that passed between Napoleon’s charge for Russia and the subsequent failure due to cold, this was repeated during World War 2 and the result was also repeated due to the same reason.
There was no Brexit vote in the recent history except the current one, so it may seem that gold’s rally is an unprecedented event. But it isn’t. There were 2 similar events in Europe in the last few years.
The first vote took place on March 16, 2014 and it was about the separation of the Crimea from Ukraine and its annexation by Russia. The majority voted for separation. This was supposed to be an event that triggers military conflicts, escalates tensions etc. – overall it was supposed to make gold soar in the upcoming months.
The second vote took place in Greece on July 5, 2015 and Greeks voted against austerity measures and the international bailout. This was supposed to tear the European Union apart – Greece was supposedly forced to leave and other indebted countries were to follow. Gold was supposed to rally substantially based on that.
Now, what really happened? The Crimean Peninsula was annexed and nothing major happened on a global basis. Greece finally adopted the austerity measures after all and the EU remained intact.
More importantly, what happened to the gold price (charts courtesy of http://stockcharts.com).
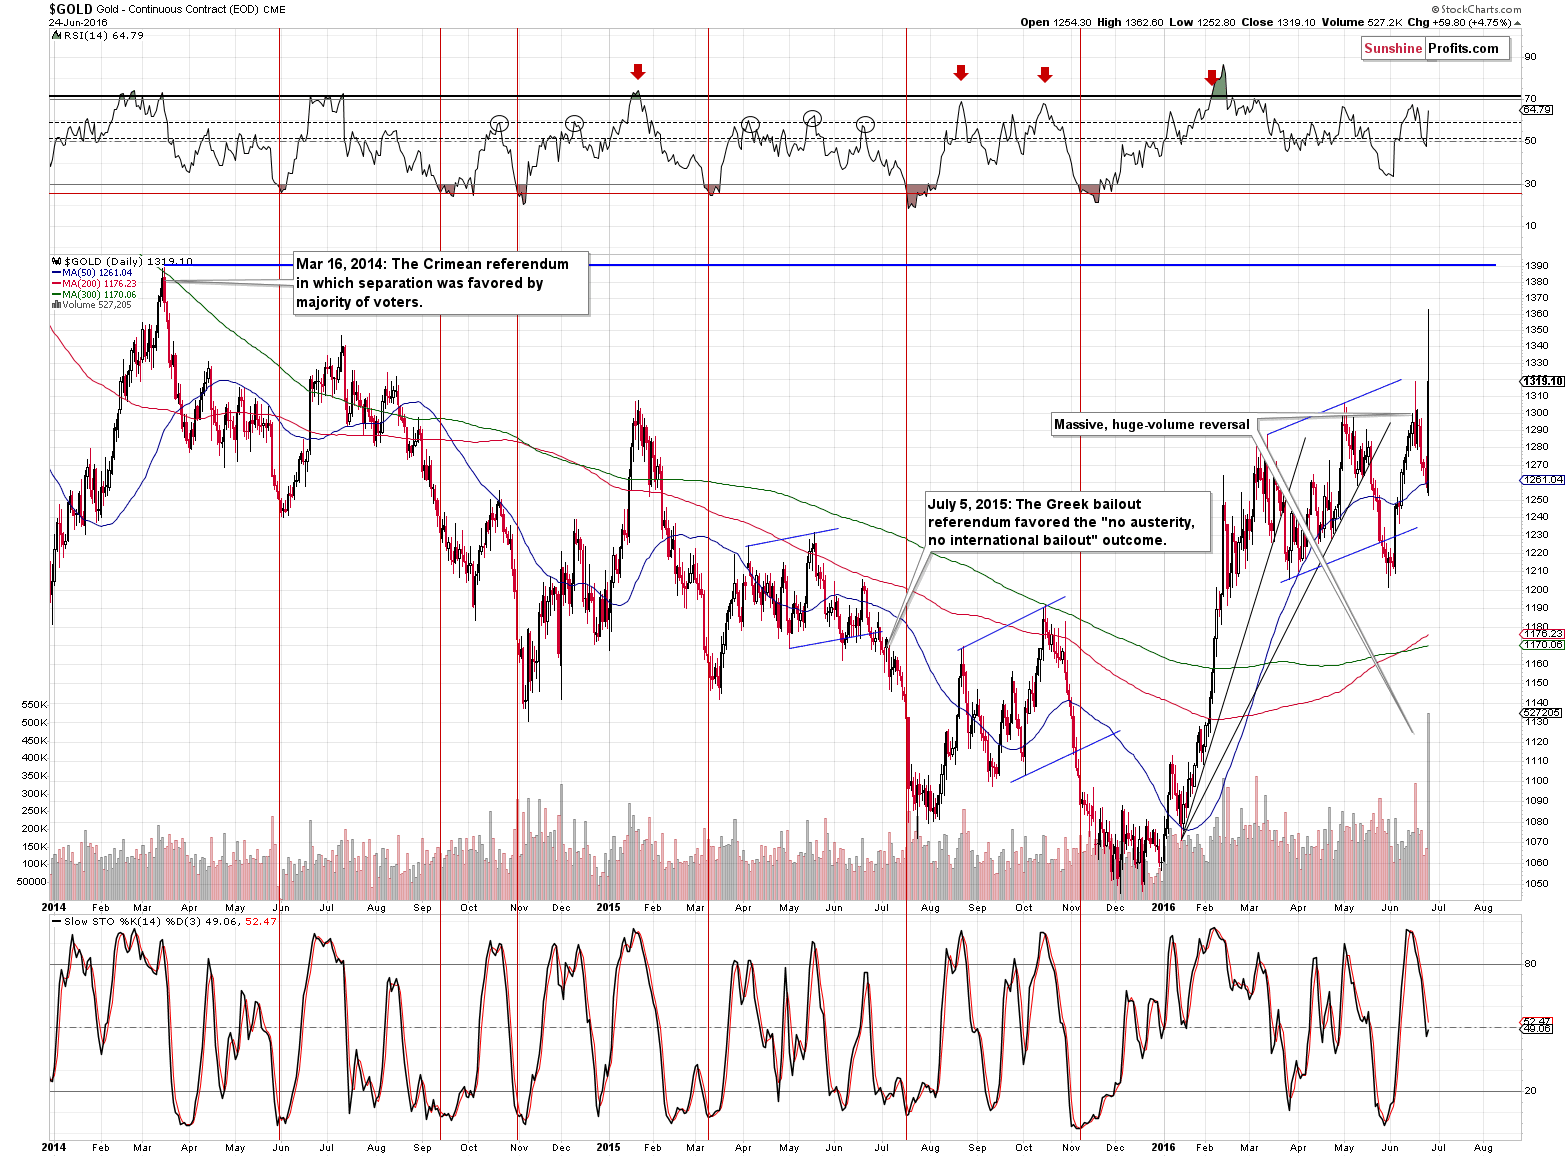
In both cases gold rallied initially during the day when the results were released. More importantly, gold declined substantially in the weeks that followed. The declines started either later during the first day after the vote or on the second day after the vote.
Why was this the case? Gold demand was driven by anxiety and uncertainty. Whatever the outcome of a vote is, it generally decreases uncertainty. Regarding the current vote, maximum uncertainty and anxiety could have been reached right after the vote, but it could be the case that it will be reached today once the entire world has a chance to take action based on the outcome.
Consequently, using history as a guide, we can expect that the top will be formed today or that it was already formed in overnight trading.
But wait, didn’t a lot change? After all people voted for leaving the EU. Yes, they did vote for leaving the EU yesterday. However, that’s not something that can be carried out in one day. It will take a long time before the UK really leaves the EU and a lot can happen in the meantime.
Leaving the EU is not a financially beneficial decision for the UK (despite direct savings) and there is a lot political pressure for the EU to stay intact. Now, if the vast majority of people voted for leaving, not much could be done with it (except some extreme measures that unite people – such as the threat of war), but since the outcome of the Brexit vote was close to being a tie, the UK authorities can simply wait for a better moment (when due to some reasons more people want the UK to stay in the EU) and announce another vote. We’re not saying that this is very likely, but something like that shouldn’t be ruled out and at this time it appears that the market is certain that Brexit is final.
Gold soared on Friday, but ultimately closed only about $20 above the June high (in terms of daily closing prices). Was that really a very significant move and breakout? Let’s keep in mind that at the same time the EU seemed to start breaking apart and the odds for rate hikes in the U.S. diminished substantially. So, no, not only was that not a very significant move – it was actually a relatively (!) small move given the circumstances.
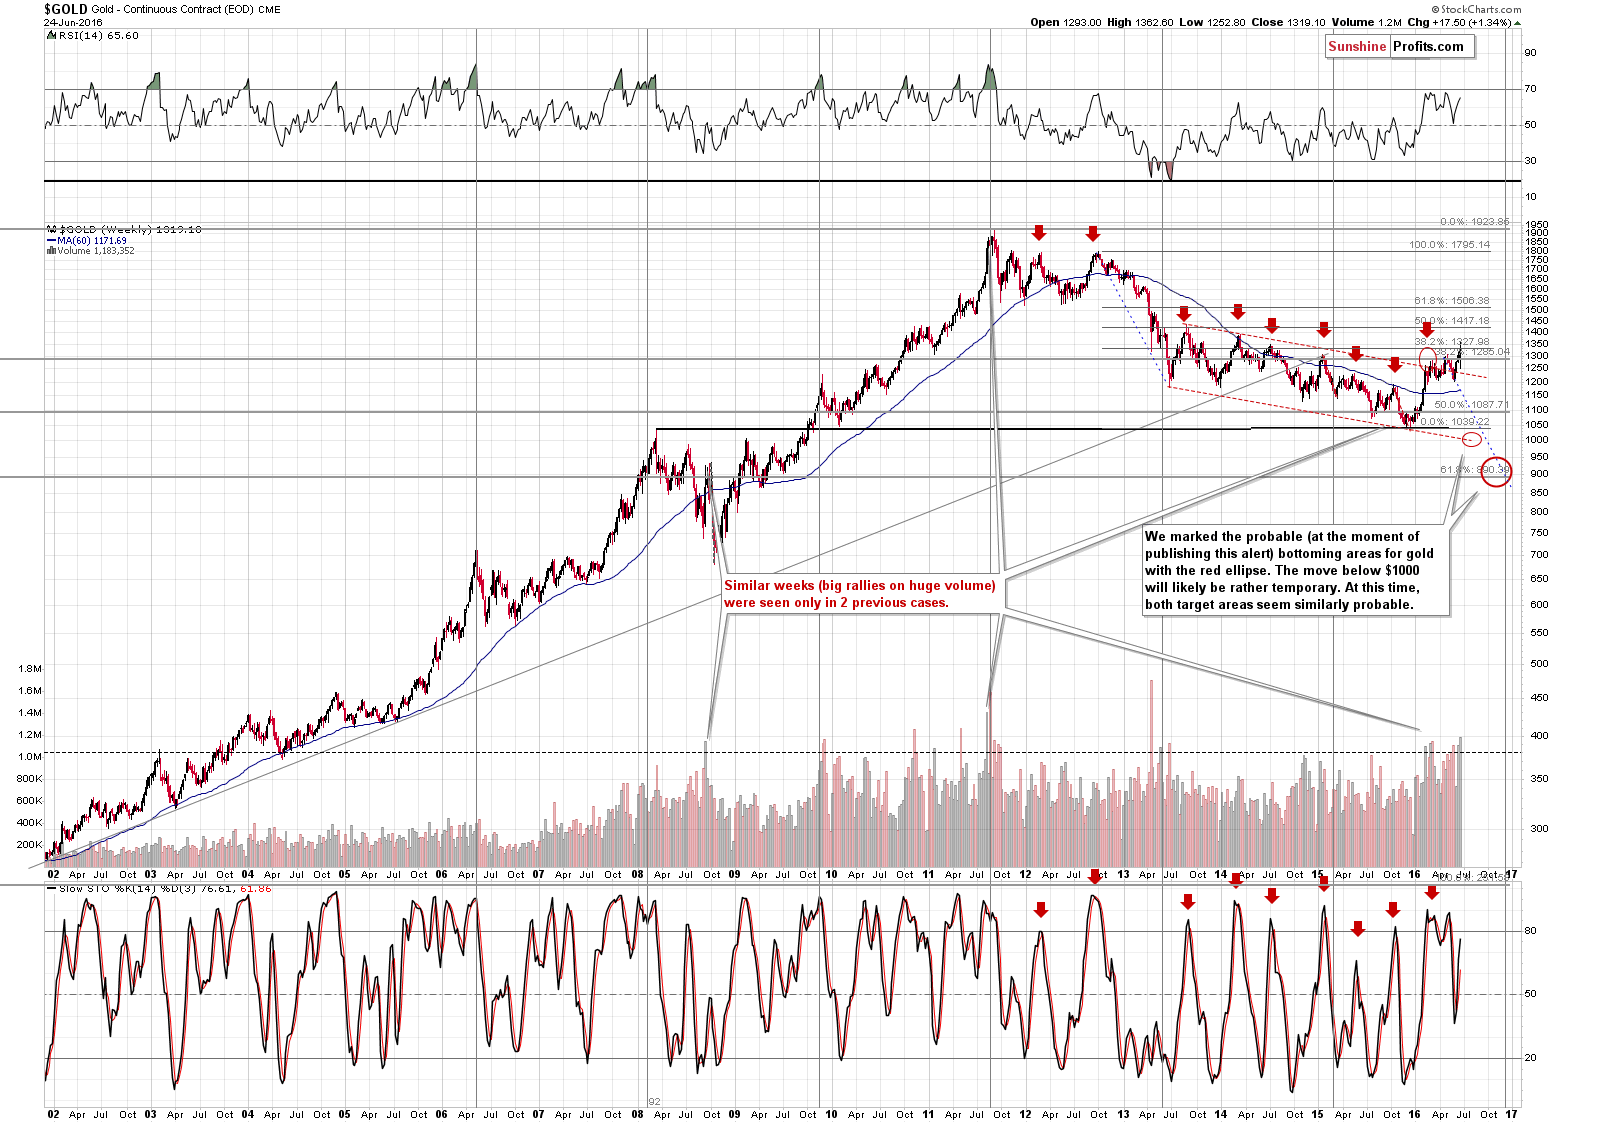
From the long-term point of view gold moved very temporarily above the 38.2% Fibonacci retracement based on the 2012 – 2015 slide and then immediately invalidated this breakout. Gold closed below it, so technically, there was no critical change on the long-term chart. Gold moved above the 2015 high, but that’s more or less it and since this breakout was not even confirmed (only one daily close above this level), there are no important bullish implications here.
With no major change on the charts, the important analogy to previous votes and lack of bullish confirmations from other markets, the outlook remains bearish.
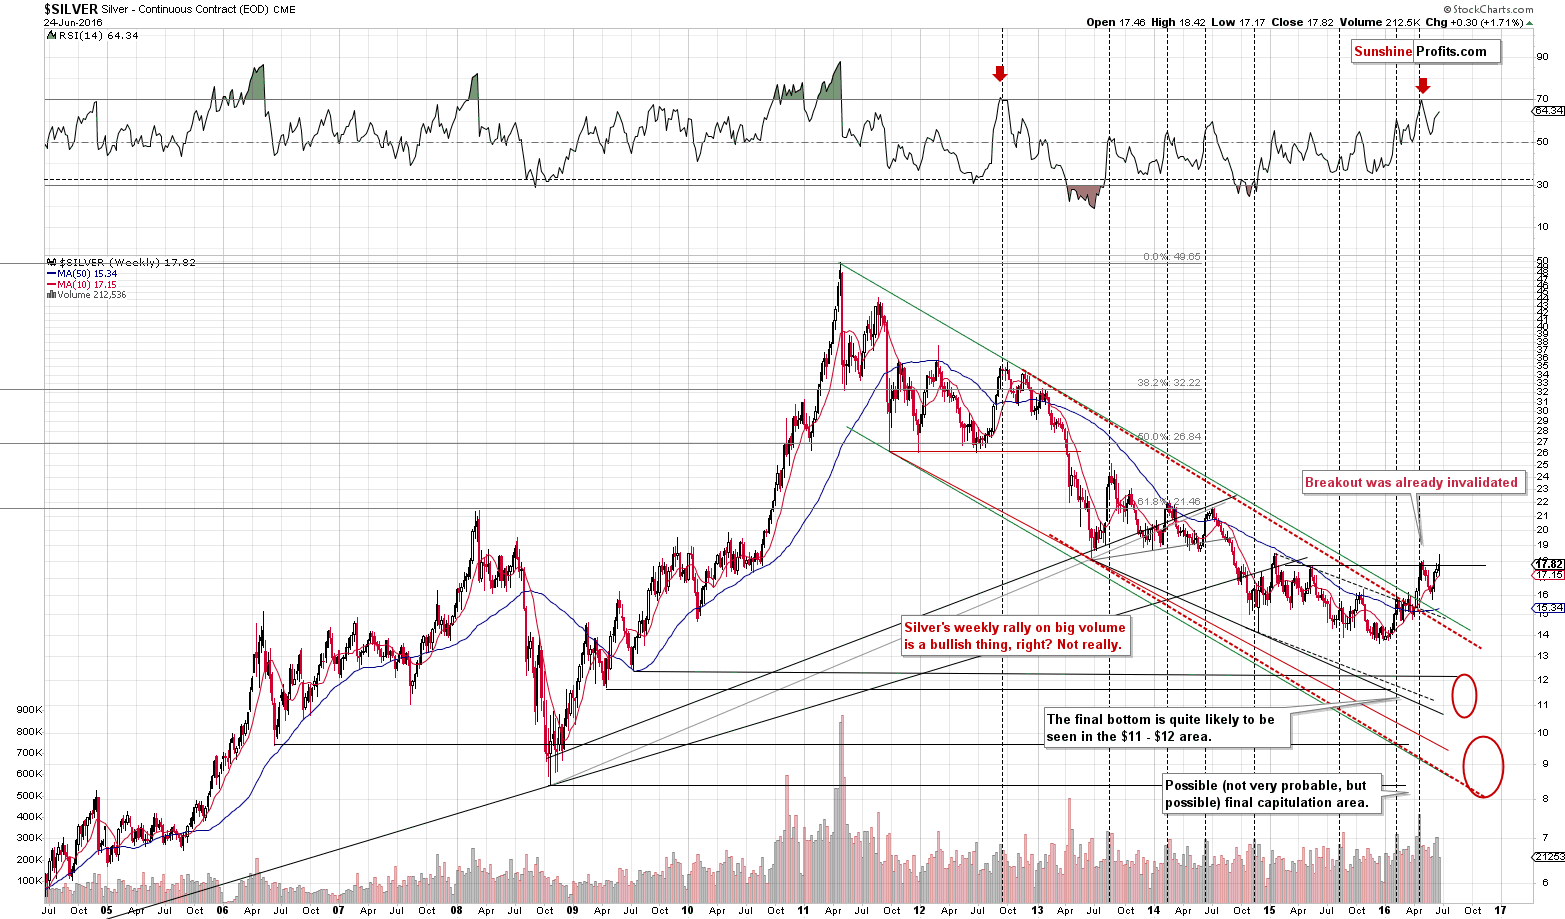
There was no new weekly high (in terms of weekly closing prices) in silver. Instead we saw an intra-day attempt to break above the previous high, which was followed by a decline and an immediate invalidation of the breakout.
Another thing is that silver’s temporary breakout was not accompanied by huge volume – the overall weekly volume was relatively low and silver gained only $0.30. Given the Brexit vote and change in the odds of an interest rate hike, the above is very weak performance.
There’s another important factor regarding silver – its cyclical turning point. Silver rallied right on the day of the turning point, so the odds are that we’ll see a reversal shortly.
What about the performance of the mining stocks?
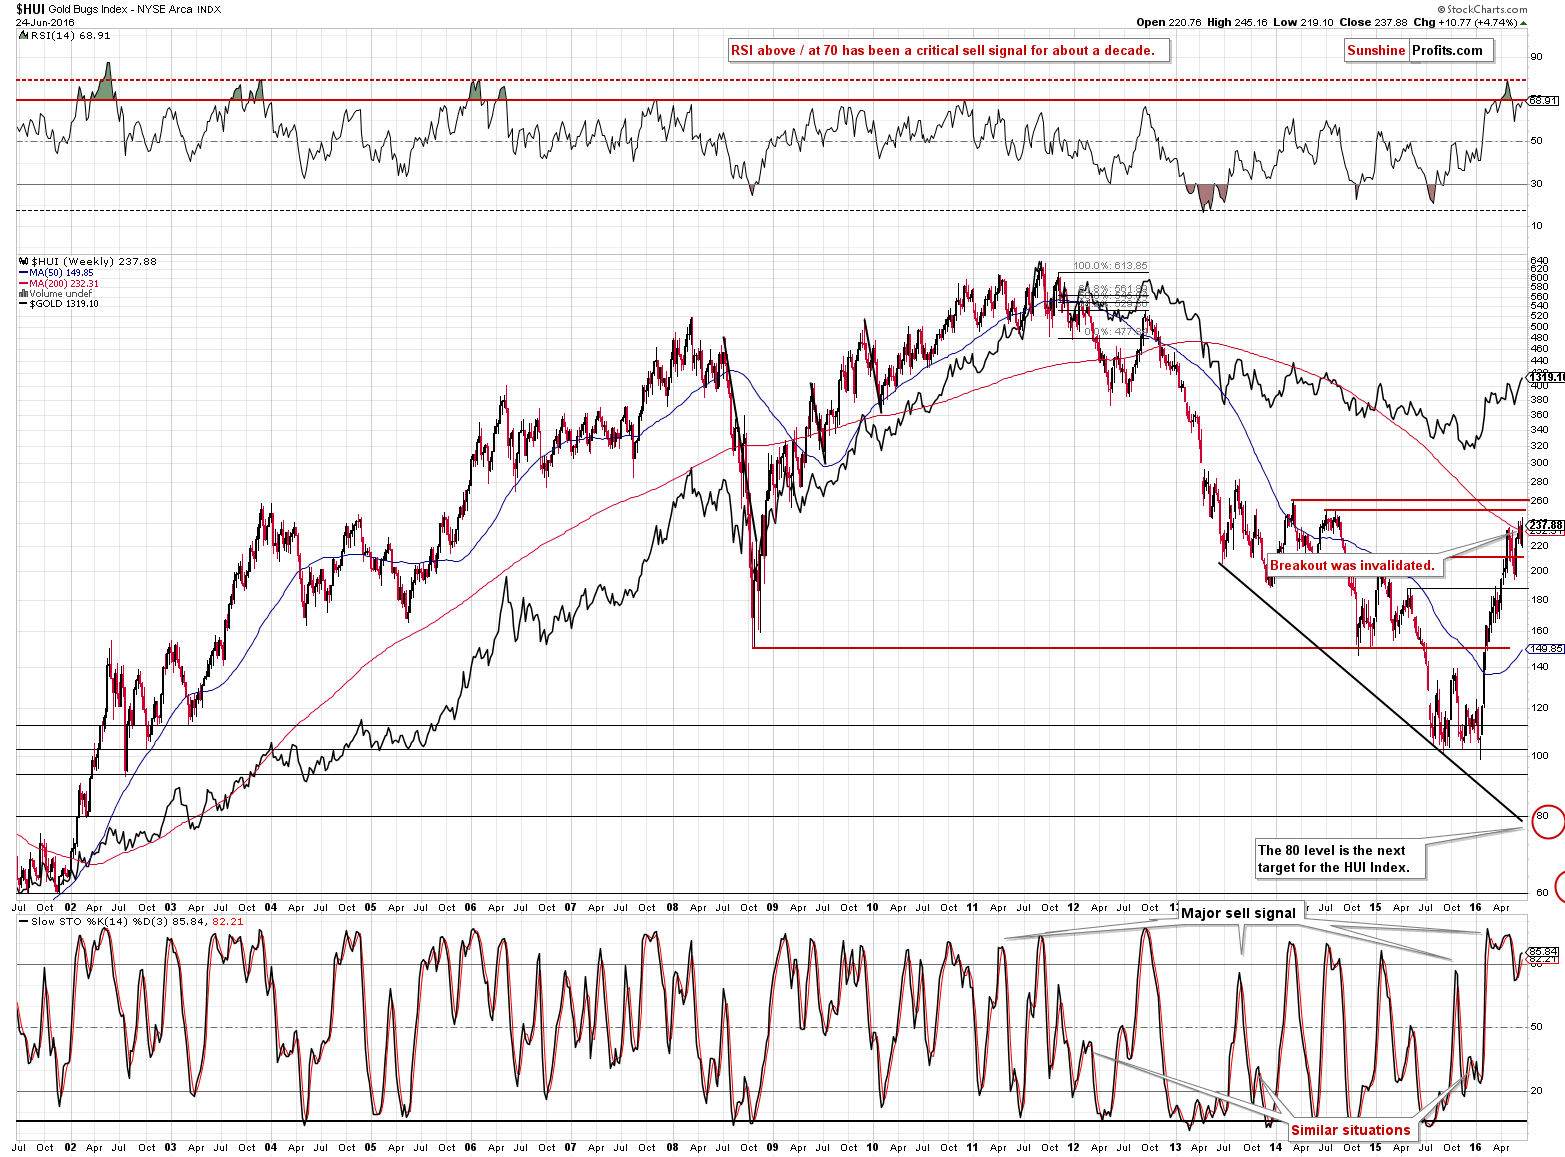
Gold stocks didn’t rally substantially above the previous highs – the move is barely visible from the long-term perspective, and it seems that it will be invalidated shortly.
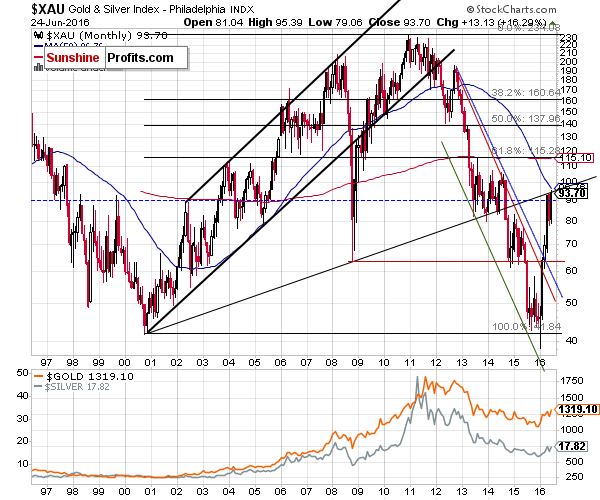
Another proxy for the mining stocks sector, the XAU Index also has bearish implications – miners moved to the rising long-term resistance line based on the key 2000 and 2008 bottoms, but there was no breakout. Without a confirmed breakout, the prices are likely to reverse and move lower.
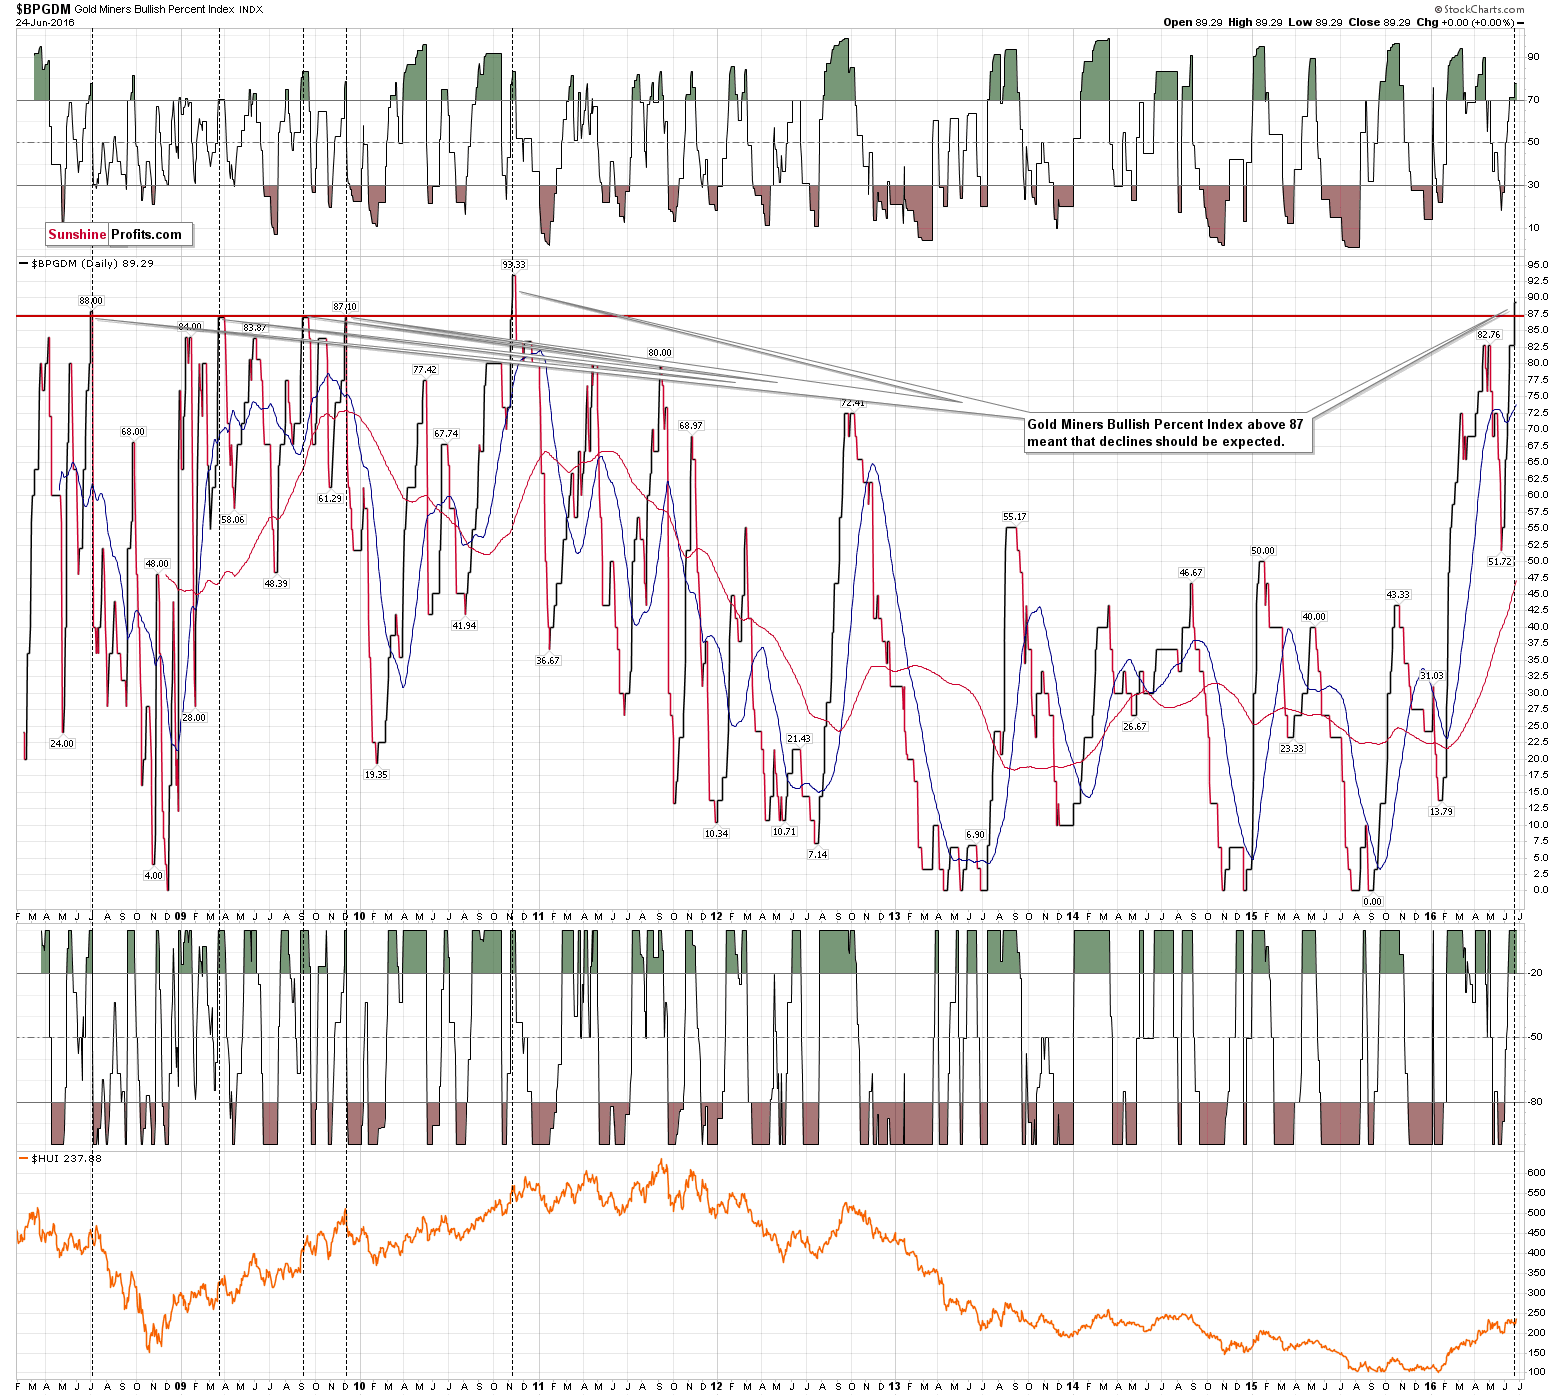
This is especially the case given that the Gold Miners Bullish Percent Index suggests much lower values of precious metals in the coming weeks. On Thursday, we wrote the following:
It is a breadth indicator based on the number of stocks with Point & Figure buy signals (a Point & Figure chart emphasizes strong moves while ignoring small ones) within this index. The Gold Miners Bullish Percent Index's range varies between 0 and 100. Generally, a reading below 30 indicates oversold conditions in the gold mining stocks sector, and a reading above 70 indicates overbought conditions.
However, when the index moves above the 87 level we have a very overbought situation and a signal that a sizable move lower is likely. It happened only a few times in the previous years and each time a decline followed. With this kind of performance, the implications are very bearish.
The additional thing that we would like to discuss is the only time when the index was as high (actually a bit higher) than its current value – in November 2010. The intraday high of the HUI Index was 588. The final high in September 2011 was about 639, which was only 8.7% higher than the Nov 2010 high.
If the HUI Index was to exceed its recent high of 241 by 8.7%, it would mean an increase to only 262 (the March 2014 high). This may seem significant on a day-to-day basis, but from the long-term point of view, it’s a small upswing. So, if a move to the extreme value corresponding to the final top of 2011 means just a relatively small increase from the recent high, then the outlook is clearly bearish as if such extreme levels were reached, a big decline would extremely likely follow anyway.
Summing up, the reaction to the Brexit vote and its result was profound on a day-to-day basis, but when viewed from a bigger perspective, it didn’t change much as far as outlook for the precious metals market is concerned and it remains bearish (especially in light of the lack of bullish confirmations from silver and mining stocks). Moreover, the analogy to the results of the previous important European votes suggests lower prices of precious metals in the coming weeks as tensions ease.
As always, we will keep you – our subscribers – updated.
To summarize:
Trading capital (our opinion): Short positions (full position) in gold, silver, and mining stocks are justified from the risk/reward perspective with the following entry prices, stop-loss orders and initial target price levels:
- Gold: initial target price: $1,006; stop-loss: $1,423, initial target price for the DGLD ETN: $86.30; stop-loss for the DGLD ETN $44.35
- Silver: initial target price: $12.13; stop-loss: $18.67, initial target price for the DSLV ETN: $65.88; stop-loss for the DSLV ETN $24.16
- Mining stocks (price levels for the GDX ETF): initial target price: $9.34; stop-loss: $30.77, initial target price for the DUST ETF: $47.90; stop-loss for the DUST ETF $3.62
In case one wants to bet on junior mining stocks' prices (we do not suggest doing so – we think senior mining stocks are more predictable in the case of short-term trades – if one wants to do it anyway, we provide the details), here are the stop-loss details and initial target prices:
- GDXJ ETF: initial target price: $14.13; stop-loss: $50.70
- JDST ETF: initial target price: $61.74; stop-loss: $1.97
Long-term capital (our opinion): No positions
Insurance capital (our opinion): Full position
Plus, you might want to read why our stop-loss orders are usually relatively far from the current price.
Please note that a full position doesn’t mean using all of the capital for a given trade. You will find details on our thoughts on gold portfolio structuring in the Key Insights section on our website.
As a reminder – “initial target price” means exactly that – an “initial” one, it’s not a price level at which we suggest closing positions. If this becomes the case (like it did in the previous trade) we will refer to these levels as levels of exit orders (exactly as we’ve done previously). Stop-loss levels, however, are naturally not “initial”, but something that, in our opinion, might be entered as an order.
Since it is impossible to synchronize target prices and stop-loss levels for all the ETFs and ETNs with the main markets that we provide these levels for (gold, silver and mining stocks – the GDX ETF), the stop-loss levels and target prices for other ETNs and ETF (among other: UGLD, DGLD, USLV, DSLV, NUGT, DUST, JNUG, JDST) are provided as supplementary, and not as “final”. This means that if a stop-loss or a target level is reached for any of the “additional instruments” (DGLD for instance), but not for the “main instrument” (gold in this case), we will view positions in both gold and DGLD as still open and the stop-loss for DGLD would have to be moved lower. On the other hand, if gold moves to a stop-loss level but DGLD doesn’t, then we will view both positions (in gold and DGLD) as closed. In other words, since it’s not possible to be 100% certain that each related instrument moves to a given level when the underlying instrument does, we can’t provide levels that would be binding. The levels that we do provide are our best estimate of the levels that will correspond to the levels in the underlying assets, but it will be the underlying assets that one will need to focus on regarding the sings pointing to closing a given position or keeping it open. We might adjust the levels in the “additional instruments” without adjusting the levels in the “main instruments”, which will simply mean that we have improved our estimation of these levels, not that we changed our outlook on the markets. We are already working on a tool that would update these levels on a daily basis for the most popular ETFs, ETNs and individual mining stocks.
Our preferred ways to invest in and to trade gold along with the reasoning can be found in the how to buy gold section. Additionally, our preferred ETFs and ETNs can be found in our Gold & Silver ETF Ranking.
As always, we'll keep you - our subscribers - updated should our views on the market change. We will continue to send out Gold & Silver Trading Alerts on each trading day and we will send additional Alerts whenever appropriate.
The trading position presented above is the netted version of positions based on subjective signals (opinion) from your Editor, and the Tools and Indicators.
As a reminder, Gold & Silver Trading Alerts are posted before or on each trading day (we usually post them before the opening bell, but we don't promise doing that each day). If there's anything urgent, we will send you an additional small alert before posting the main one.
=====
Latest Free Trading Alerts:
The British referendum on the United Kingdom’s membership in the European Union is behind us. Britons decided to leave the European Union. What can we expect now for the gold market, after an initial spike?
S&P 500 index bounced off medium-term resistance level at 2,100 on Friday, before breaking below 2,050 mark. Is this a new downtrend or still just consolidation following February - April rally?
Stock Trading Alert: Stocks Sold Off After "Brexit" - Will They Continue Lower?
=====
Hand-picked precious-metals-related links:
Jim Rogers Picks Dollar Over Gold as Haven in Brexit Tumult
HSBC Looks For Gold To Rally Toward $1,400/Oz In Aftermath Of U.K. Referendum
London-based gold seller says 'phones are ringing off the hook'
=====
In other news:
The British are frantically Googling what the E.U. is, hours after voting to leave it
U.K. Chaos Infecting Markets as Pound Extends Its Record Loss
Fed's Yellen pulls out of ECB gathering in Portugal
Brexit Hijacks Draghi Retreat as ECB Faces Crisis Yet Again
Sterling slides to 31-year low as Brexit shock deepens
=====
Thank you.
Sincerely,
Przemyslaw Radomski, CFA
Founder, Editor-in-chief, Gold & Silver Fund Manager
Gold & Silver Trading Alerts
Forex Trading Alerts
Oil Investment Updates
Oil Trading Alerts

