

Briefly: In our opinion, a speculative short position (half) in gold, silver and mining stocks is justified from the risk/reward point of view.
Gold soared once again yesterday and it took silver and mining stocks with it. Will this rally continue for much longer?
Not likely. Mining stocks didn’t move above their March high and their underperformance has bearish implications. Moreover, the USD Index seems to be on a verge of starting another rally, which will likely translate into lower precious metals prices. Let’s take a closer look (charts courtesy of http://stockcharts.com).
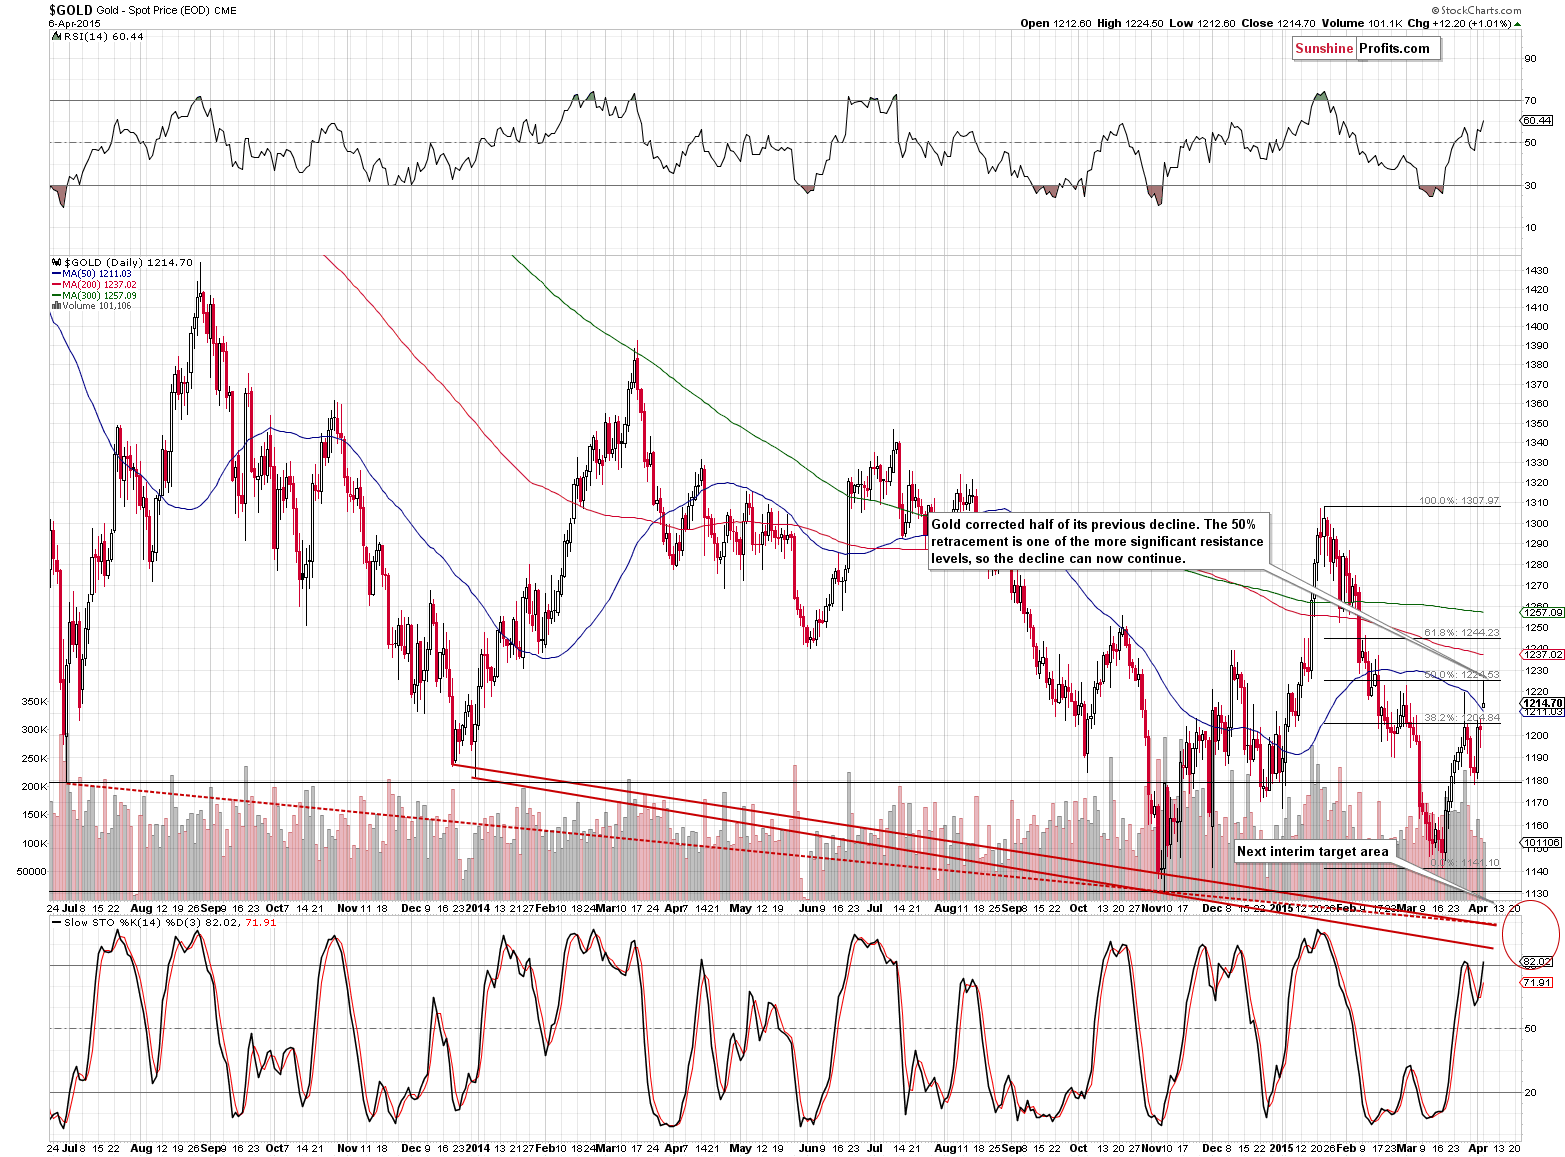
Gold rallied to the 50% Fibonacci retracement level, which means that the rally could be over. It’s not a sign that it is over by itself, but this retracement is definitely one of the likely levels at which the rally is likely to end.
The daily candlestick is a bearish shooting star, which is often sign of a local top. Have seen one? Combining the above 2 observations makes it likely.
Please note that gold’s performance since December 2014 can be seen as an uncompleted head-and-shoulders pattern. The implications – if the pattern is completed – will be very bearish and will make gold’s slide to approximately $1,000 a likely scenario.
Speaking of very bearish head-and-shoulders formations, our previous comments on silver remain up-to-date:
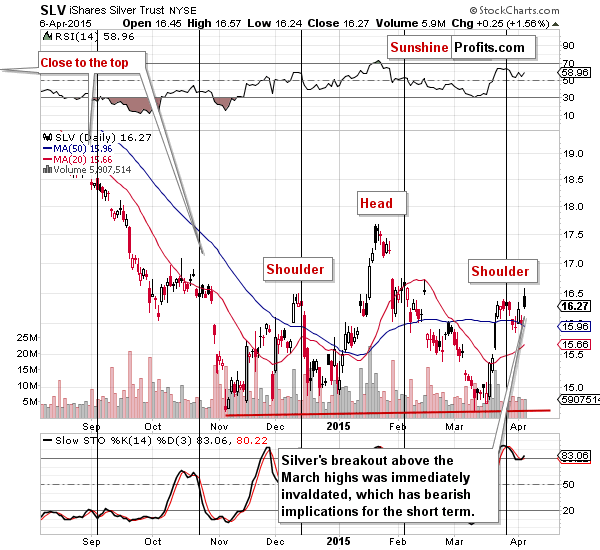
Another thing that’s worth keeping in mind at this time is the head and shoulders formation that is probably being formed (we will know for certain only after it is completed). The pattern is big and its implications are very bearish, however not for the very short term. If silver moves higher $0.50 or so, the pattern will not be invalidated and the bearish implications for the following weeks will remain in place. It does not rule out such a very short-term move by itself.
Interestingly, silver has indeed moved about $0.50 higher in the early trading, but declined once again before it’s end.
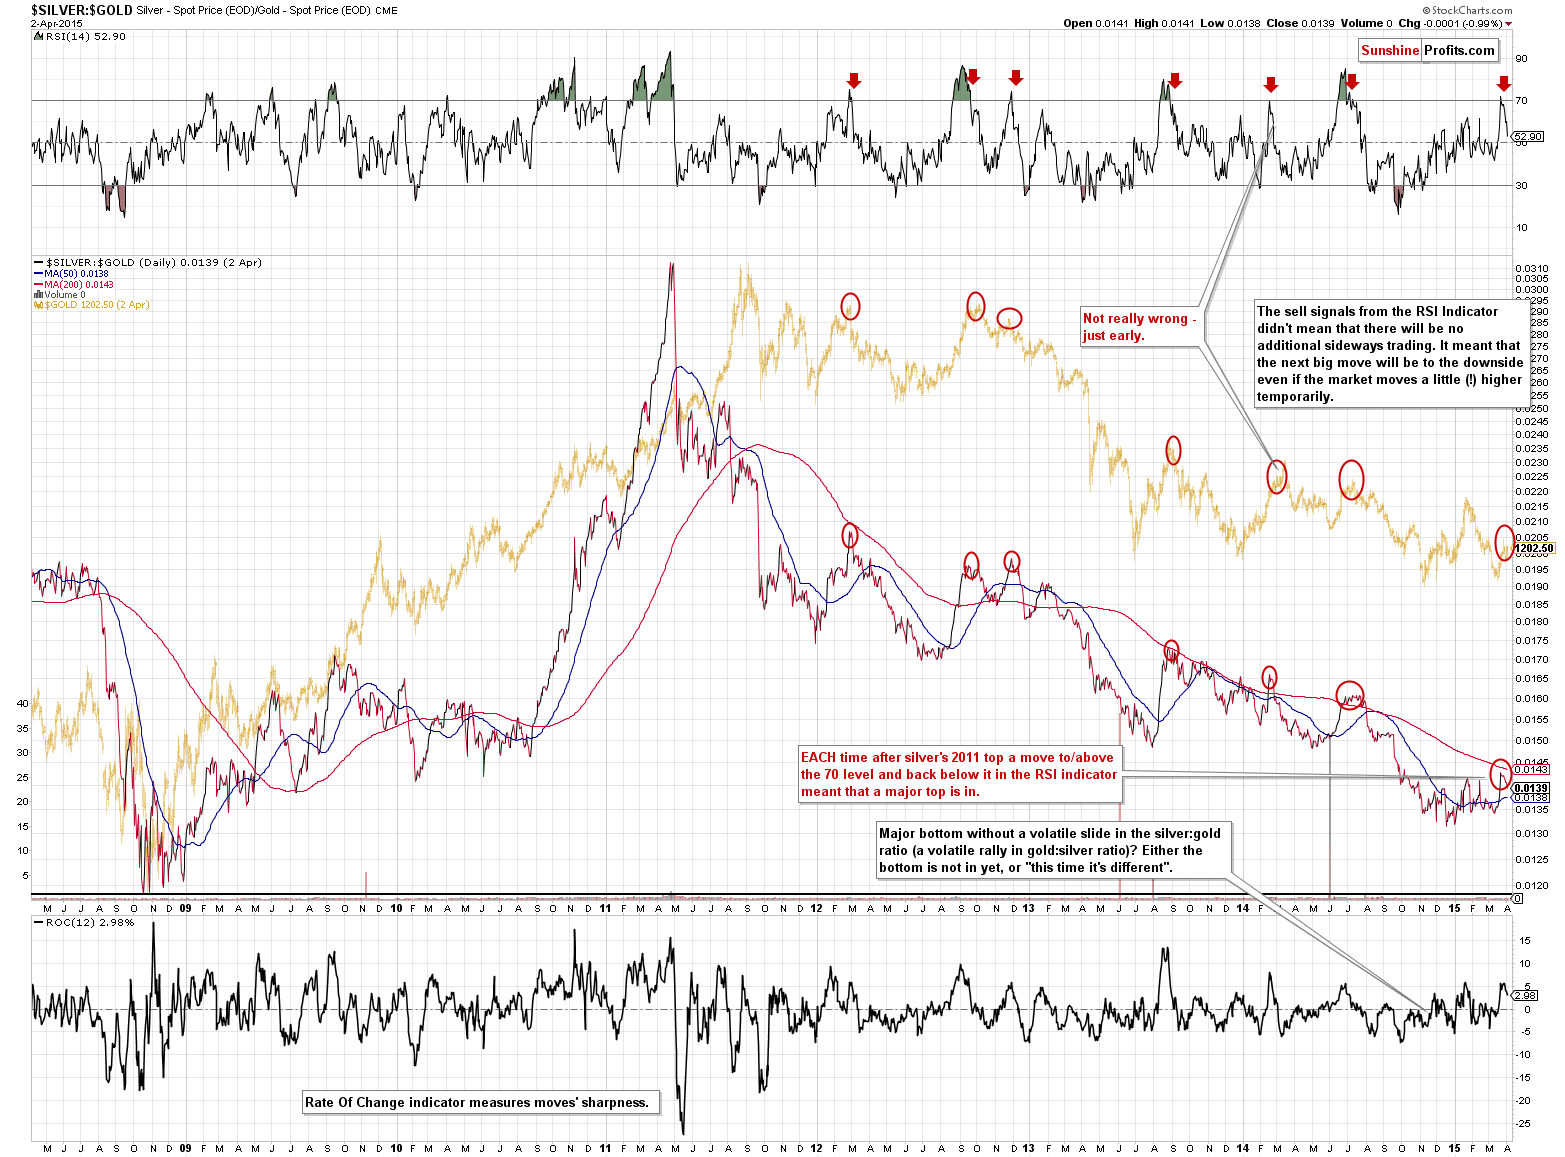
The silver to gold ratio continues to have bearish implications for the following weeks and our previous comments on the above chart remain up-to-date:
Note the red arrows that mark the sell signals and what happened with the silver to gold ratio and gold in the past years.
Some would say that silver is leading gold higher. Others would say that “whites lead yellow” suggesting that silver’s (or platinum’s) outperformance is a very bullish sign. Here’s our take:
Wrong.
Very wrong.
OK, there are no sure bets in any market, but the odds are that the most recent outperformance of silver is just a sign preceding a major top. Just take a look what happened in the past YEARS. EACH TIME (yes, each time) the RSI indicator based on the silver to gold ratio moved above 70 and then moved back below it (the times when silver outperformed gold for some time, but then it moved back down again), a major top was formed. That’s a signal that’s been 100% effective for 4 years. If this was the case for a year and there were 3 such cases, we would not be that excited, but it’s a signal that has been in place for 4 years and we saw 6 signals that were followed by 6 declines, which makes this signal something that should definitely not be ignored. The implications, of course, are bearish.
On Friday, we wrote the following regarding the mining stocks:
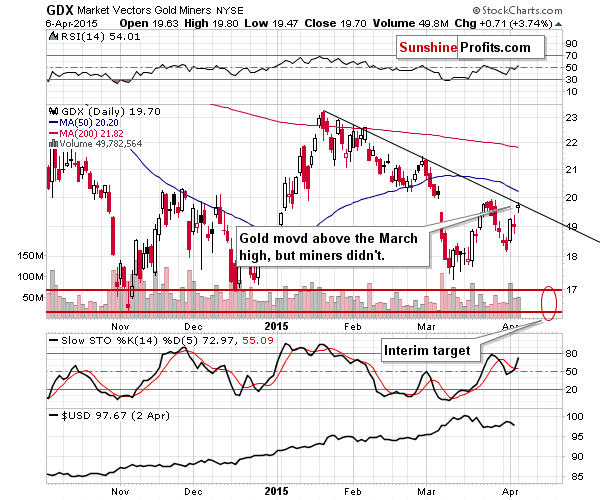
The situation in mining stocks, however, has clearly improved for the very short term. Yesterday’s rally was quite big and it was accompanied by big volume. While it doesn’t have meaningful implications for the medium term, this is a bullish sign for the very short term. We saw similar daily action in mid-March and it was followed by a $1 rally.
We have seen an almost $1 rally now, so perhaps the rally is already over. The more important thing that is visible on the above chart is the fact that miners didn’t manage to break above the March highs, even though gold did. This underperformance has bearish implications.
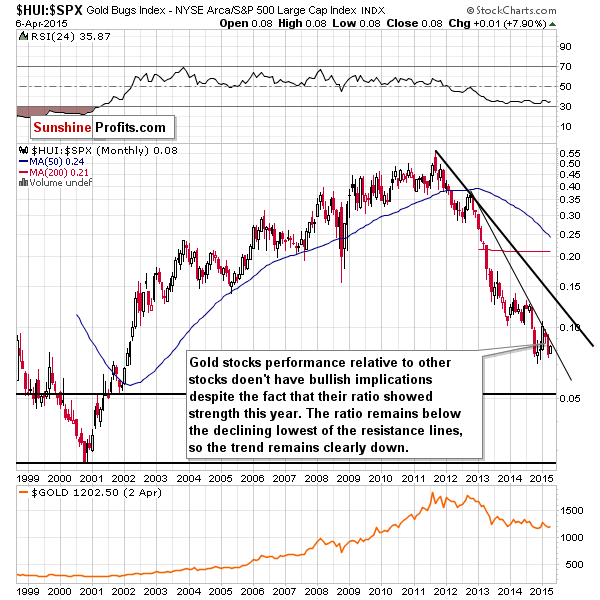
If we compare gold stocks performance to performance to other stocks, we’ll see that the trend remains down and that the recent move higher didn’t change much. The outlook remains bearish.
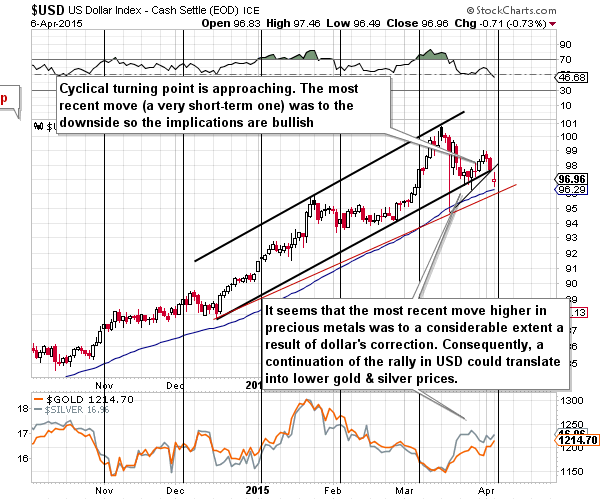
The USD Index is now very close to its cyclical turning point, which – given the recent decline - means that the uptrend could resume relatively soon.
The US dollar moved below 2 black support lines (which were not very strong) but is above the red support line, and given the proximity of the turning point, reaching this level could trigger a rebound. If the USD Index moves higher and invalidates the breakdown below the 2 support/resistance lines, then it will be even more likely to rally further, likely above March high.
With situation rather positive for the USD Index, the implications are negative for the precious metals sector.
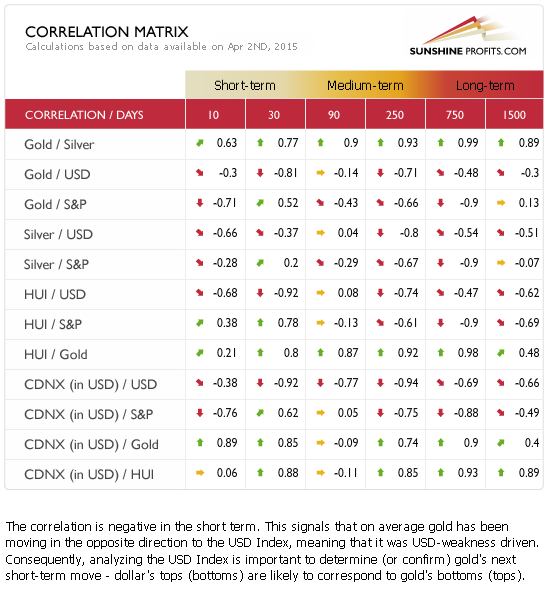
Our Correlation Matrix also shows that the link between gold and the USD Index is strongly negative once again. The values in the 30-day are close to -1 in case of USD vs. gold and mining stocks and are also negative in case of silver. The negative link between PMs and USD seems to be back, at least for now.
Our previous comments on the True Seasonal patterns remains up-to-date:
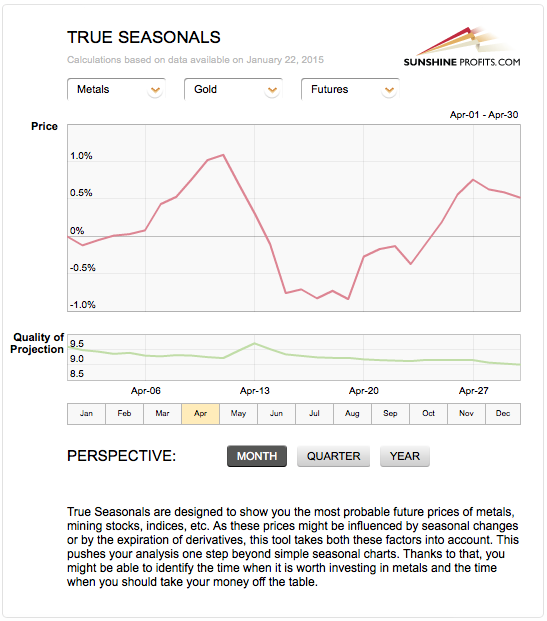
Gold tends to move higher in the first part of part of April only to disappoint close to the middle of the month. Consequently, a very short-term rally should not surprise us, but we should not expect it to be anything more than that. This is in tune with other signals.
We have already seen a short-term rally, so perhaps the entire move to the upside is already over.
Summing up, the outlook for the precious metals market remains bearish for the medium term (the following weeks) and it just deteriorated for the short term. It seems that re-opening a small speculative short position in the precious metals sector is once again justified from the risk/reward point of view.
In the summary of Thursday's alert we wrote that “it seems that we will have an opportunity to re-enter the short positions in just several days (and perhaps at more favorable prices)”. We indeed have more favorable prices and lower risk at this time.
We will keep you – our subscribers – updated.
To summarize:
Trading capital (our opinion): Short (half position) position in gold, silver and mining stocks is justified from the risk/reward perspective with the following stop-loss orders and initial (!) target prices:
- Gold: initial target price: $1,115; stop-loss: $1,253, initial target price for the DGLD ETN: $87.00; stop loss for the DGLD ETN $63.78
- Silver: initial target price: $15.10; stop-loss: $17.63, initial target price for the DSLV ETN: $67.81; stop loss for DSLV ETN $44.97
- Mining stocks (price levels for the GDX ETN): initial target price: $16.63; stop-loss: $21.83, initial target price for the DUST ETN: $23.59; stop loss for the DUST ETN $12.23
In case one wants to bet on lower junior mining stocks' prices, here are the stop-loss details and initial target prices:
- GDXJ: initial target price: $21.17; stop-loss: $27.31
- JDST: initial target price: $14.35; stop-loss: $6.18
Long-term capital (our opinion): No positions
Insurance capital (our opinion): Full position
Please note that a full position doesn’t mean using all of the capital for a given trade. You will find details on our thoughts on gold portfolio structuring in the Key Insights section on our website.
As a reminder – “initial target price” means exactly that – an “initial” one, it’s not a price level at which we suggest closing positions. If this becomes the case (like it did in the previous trade) we will refer to these levels as levels of exit orders (exactly as we’ve done previously). Stop-loss levels, however, are naturally not “initial”, but something that, in our opinion, might be entered as an order.
Since it is impossible to synchronize target prices and stop-loss levels for all the ETFs and ETNs with the main markets that we provide these levels for (gold, silver and mining stocks – the GDX ETF), the stop-loss levels and target prices for other ETNs and ETF (among other: UGLD, DGLD, USLV, DSLV, NUGT, DUST, JNUG, JDST) are provided as supplementary, and not as “final”. This means that if a stop-loss or a target level is reached for any of the “additional instruments” (DGLD for instance), but not for the “main instrument” (gold in this case), we will view positions in both gold and DGLD as still open and the stop-loss for DGLD would have to be moved lower. On the other hand, if gold moves to a stop-loss level but DGLD doesn’t, then we will view both positions (in gold and DGLD) as closed. In other words, since it’s not possible to be 100% certain that each related instrument moves to a given level when the underlying instrument does, we can’t provide levels that would be binding. The levels that we do provide are our best estimate of the levels that will correspond to the levels in the underlying assets, but it will be the underlying assets that one will need to focus on regarding the sings pointing to closing a given position or keeping it open. We might adjust the levels in the “additional instruments” without adjusting the levels in the “main instruments”, which will simply mean that we have improved our estimation of these levels, not that we changed our outlook on the markets. We are already working on a tool that would update these levels on a daily basis for the most popular ETFs, ETNs and individual mining stocks.
Our preferred ways to invest in and to trade gold along with the reasoning can be found in the how to buy gold section. Additionally, our preferred ETFs and ETNs can be found in our Gold & Silver ETF Ranking.
As always, we'll keep you - our subscribers - updated should our views on the market change. We will continue to send out Gold & Silver Trading Alerts on each trading day and we will send additional Alerts whenever appropriate.
The trading position presented above is the netted version of positions based on subjective signals (opinion) from your Editor, and the Tools and Indicators.
As a reminder, Gold & Silver Trading Alerts are posted before or on each trading day (we usually post them before the opening bell, but we don't promise doing that each day). If there's anything urgent, we will send you an additional small alert before posting the main one.
=====
Latest Free Trading Alerts:
Recently, data showed that Canadian trade deficit narrowed to C$0.98 billion in February from C$1.48 billion in January, beating analysts’ expectations. In response to these positive numbers Canadian dollar increased against the greenback, which approached USD/CAD to the long-term support line. Will we see a breakdown in the coming days?
Forex Trading Alert: USD/CAD – North or South?
=====
Hand-picked precious-metals-related links:
Gold supply boom ending as price slump means less mine spending
Norilsk sees South Africa cutting platinum output
=====
In other news:
Rand Paul tries to broaden libertarian appeal
Greece on warpath for damages as crisis grows
U.S. Dollar's Drop is a Signal to the World's Best Forecaster to Start Buying
Why oil inventory fall won't boost prices much: Goldman
=====
Thank you.
Sincerely,
Przemyslaw Radomski, CFA
Founder, Editor-in-chief
Gold & Silver Trading Alerts
Forex Trading Alerts
Oil Investment Updates
Oil Trading Alerts

