

Briefly: in our opinion, full (200% of the regular size of the position) speculative short positions in gold, silver and mining stocks are justified from the risk/reward perspective at the moment of publishing this alert.
Gold and silver once again declined to new 2018 lows yesterday, but this time mining stocks didn’t underperform. Quite the opposite – even though both precious metals were down substantially, mining stocks didn’t decline at all. GDX was up by just 1 cent, but this 1 cent seems to be very significant in light of gold and silver’s decline – after all, GDX was “supposed to” decline if the metals declined, and it didn’t. Is the bottom in?
In yesterday’s intraday Alert, we wrote that it probably wasn’t the case and in today’s analysis, we’d like to provide you with details. But first, let’s quote what we wrote:
Gold and silver moved to new yearly lows today, further increasing our profits from the current short position, but the mining stocks are almost unchanged. This appears to be strength of the latter relative to gold and thus a bullish sign. Consequently, you may be wondering, if this is indeed a sign to close the short position and take profits off the table.
In our view, it’s too early to do so due to combination of two reasons:
- There are so many bearish confirmations in place right now that it would take a meaningful bullish sign to make the situation neutral
- We’ve seen strength in the mining stocks for only 3.5 hours. That’s not even a daily show of strength and it would take more than just one day to invalidate the previous short-term weakness and cause another breakout in the mining stocks to gold ratios. The GDX to GLD ratio moved higher, but compared to the size of the decline in the ratio that we saw this month, it appears to be just a correction that’s quite in tune with what happened in case of other declines (we’ll show you details in tomorrow’s regular Gold & Silver Trading Alert).
In other words, it’s too early to say that anything changed regarding the situation in the GDX to GLD ratio and it’s way too early to say that the outlook for the entire precious metals sector changed. Consequently, for now, the outlook remains bearish and keeping the short positions intact seems to be justified from the risk to reward point of view.
Gold and silver are moving lower in today’s pre-market trading and it seems that the above was correct. Yesterday was not the final bottom. In order to check if one is likely to be formed shortly, let’s take a look at the mining stocks to gold ratio (charts courtesy of http://stockcharts.com).
Mining Stocks’ Correction
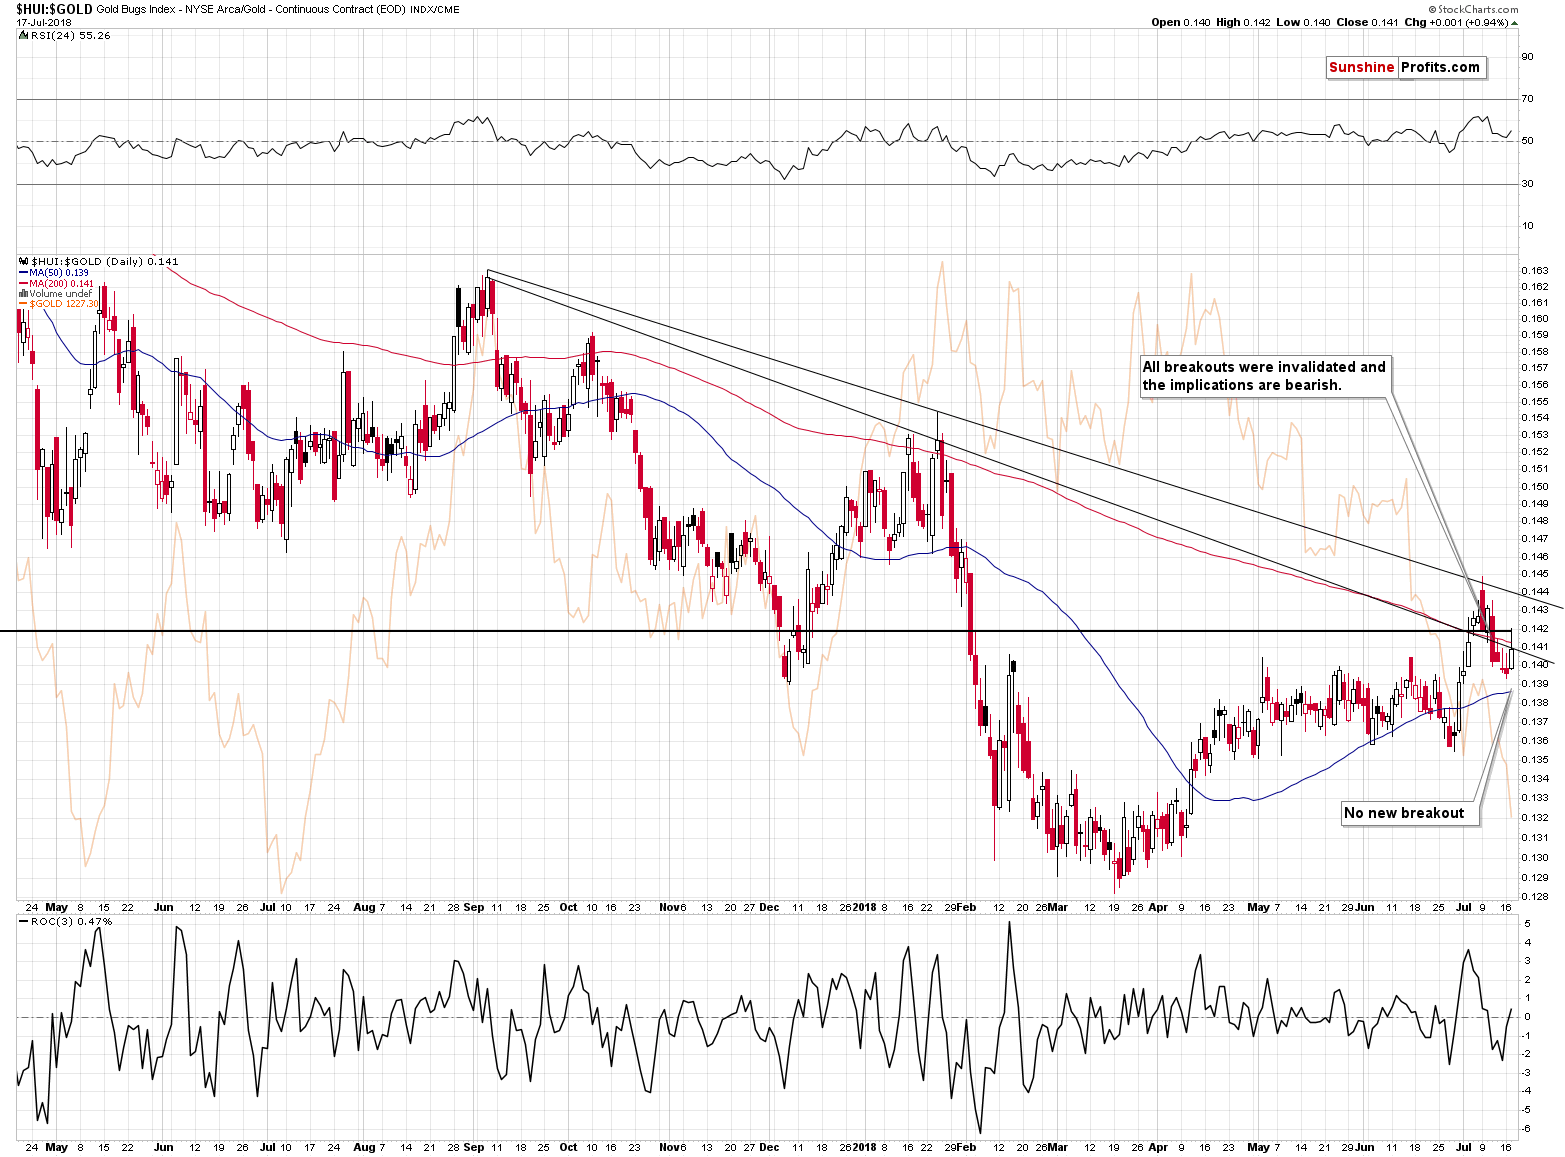
On July 12th, we described the above chart in the following way:
The HUI to gold ratio also moved above a bit above the declining medium-term resistance lines and these small breakouts were invalidated. Invalidations of breakdowns are generally bearish signs, and the above is not an exception.
The above remains up-to-date, because yesterday’s strength in gold stocks relative to gold didn’t cause any technical changes on the above chart. Naturally, the ratio moved higher, but we saw no new breakout. There was an attempt to move above the late-2016 low(thick horizontal line) and the declining resistance line based on the previous highs in terms of closing prices, but none of them succeeded.
If we see more strength in the miners and the ratio rallies further and breaks above the mentioned levels, then the implications of the above chart may become bullish. But they are not bullish now.
Therefore, it was simply a corrective upswing – or a pause – that didn’t change the technical outlook. This means that the ratio is still likely to move lower.
Consequently, even though yesterday’s intraday reversal in miners seemed bullish, it actually isn’t.
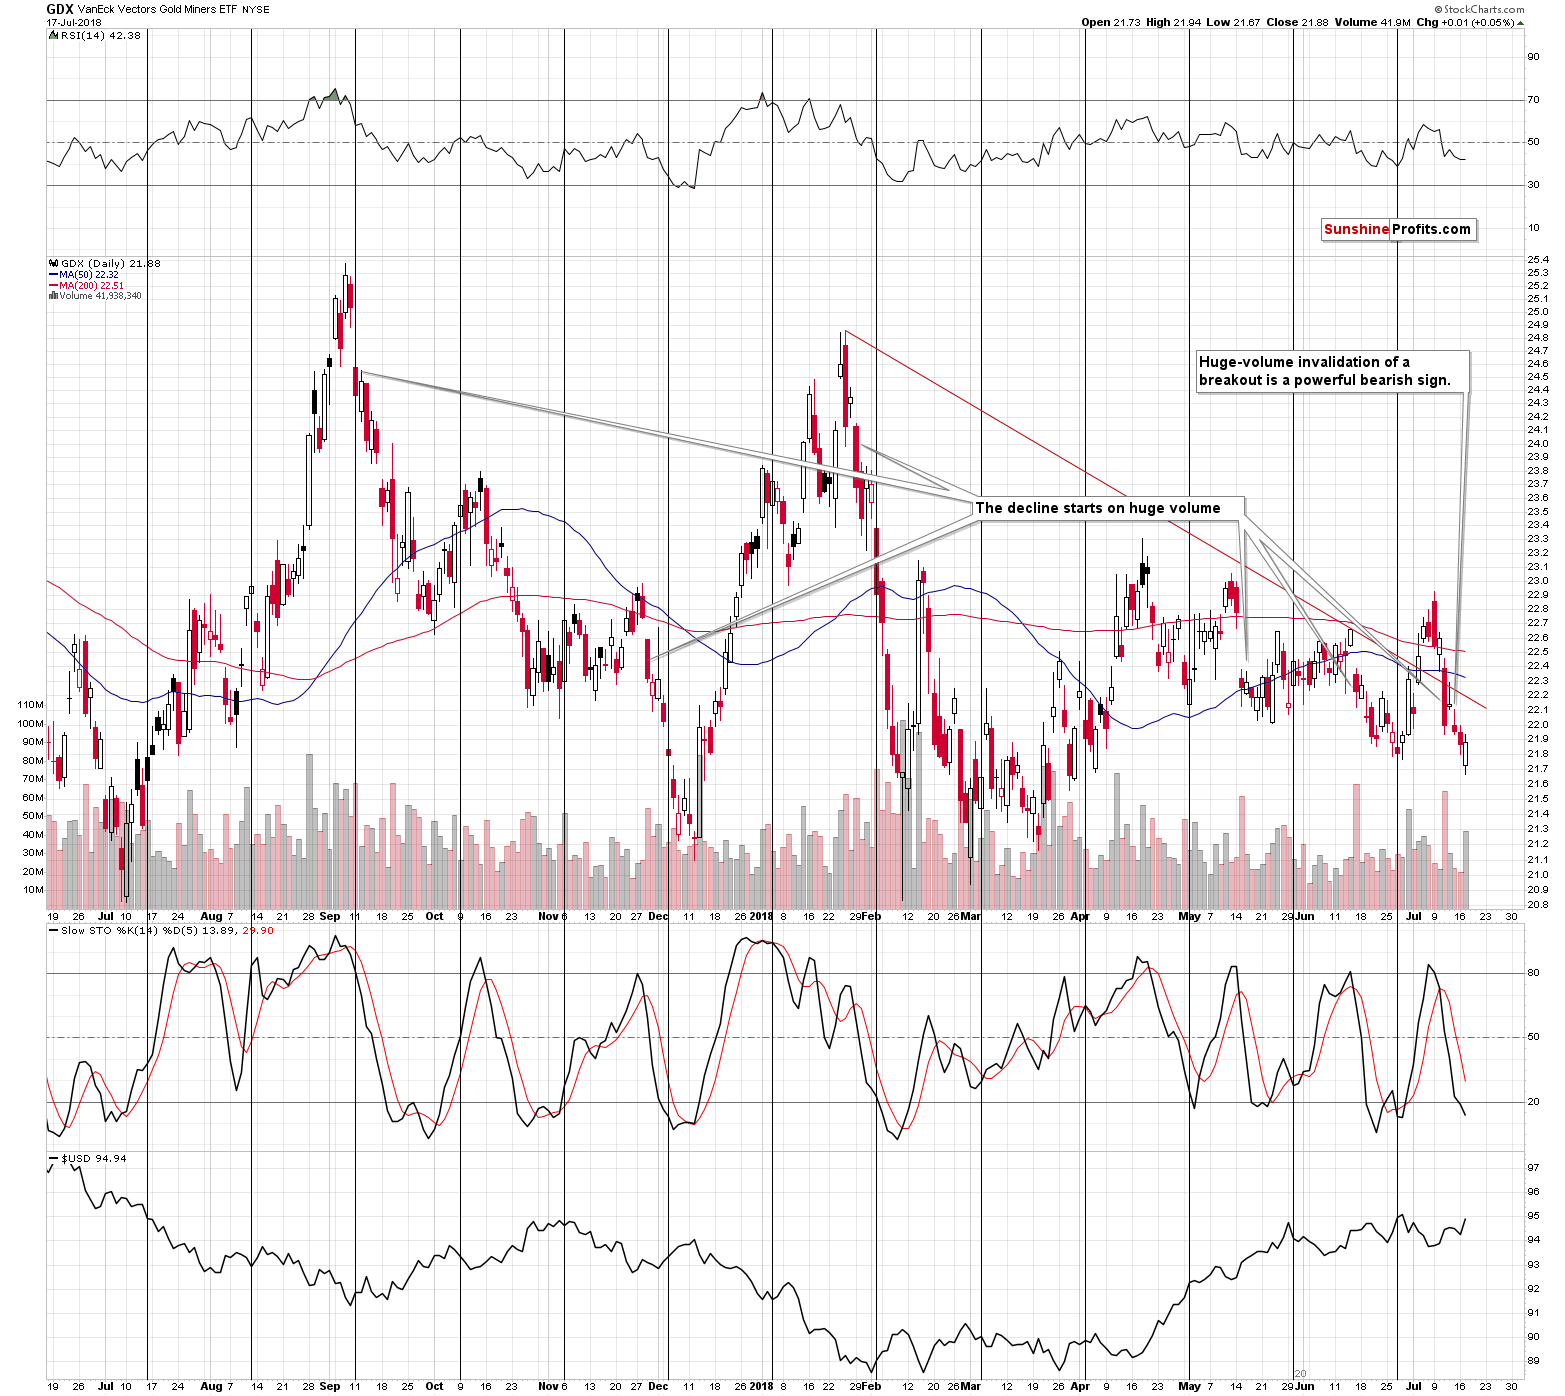
The volume that accompanied the intraday reversal was significant, but in light of what we already wrote above, it doesn’t seem that the implications are strongly bullish.
Moreover, if you look at the two previous sizable downswings (September-December 2017, February 2018) in both: GDX, and in the HUI to gold ratio (previous chart), you’ll notice that the daily downswings quite often had daily shows of strength after which the decline resumed, either immediately, or after an additional 1-2 days. Again, so far, it doesn’t seem like we’ve seen a major bullish sign.
Having said that, let’s take a look at the metals.
Gold and Silver’s Slide
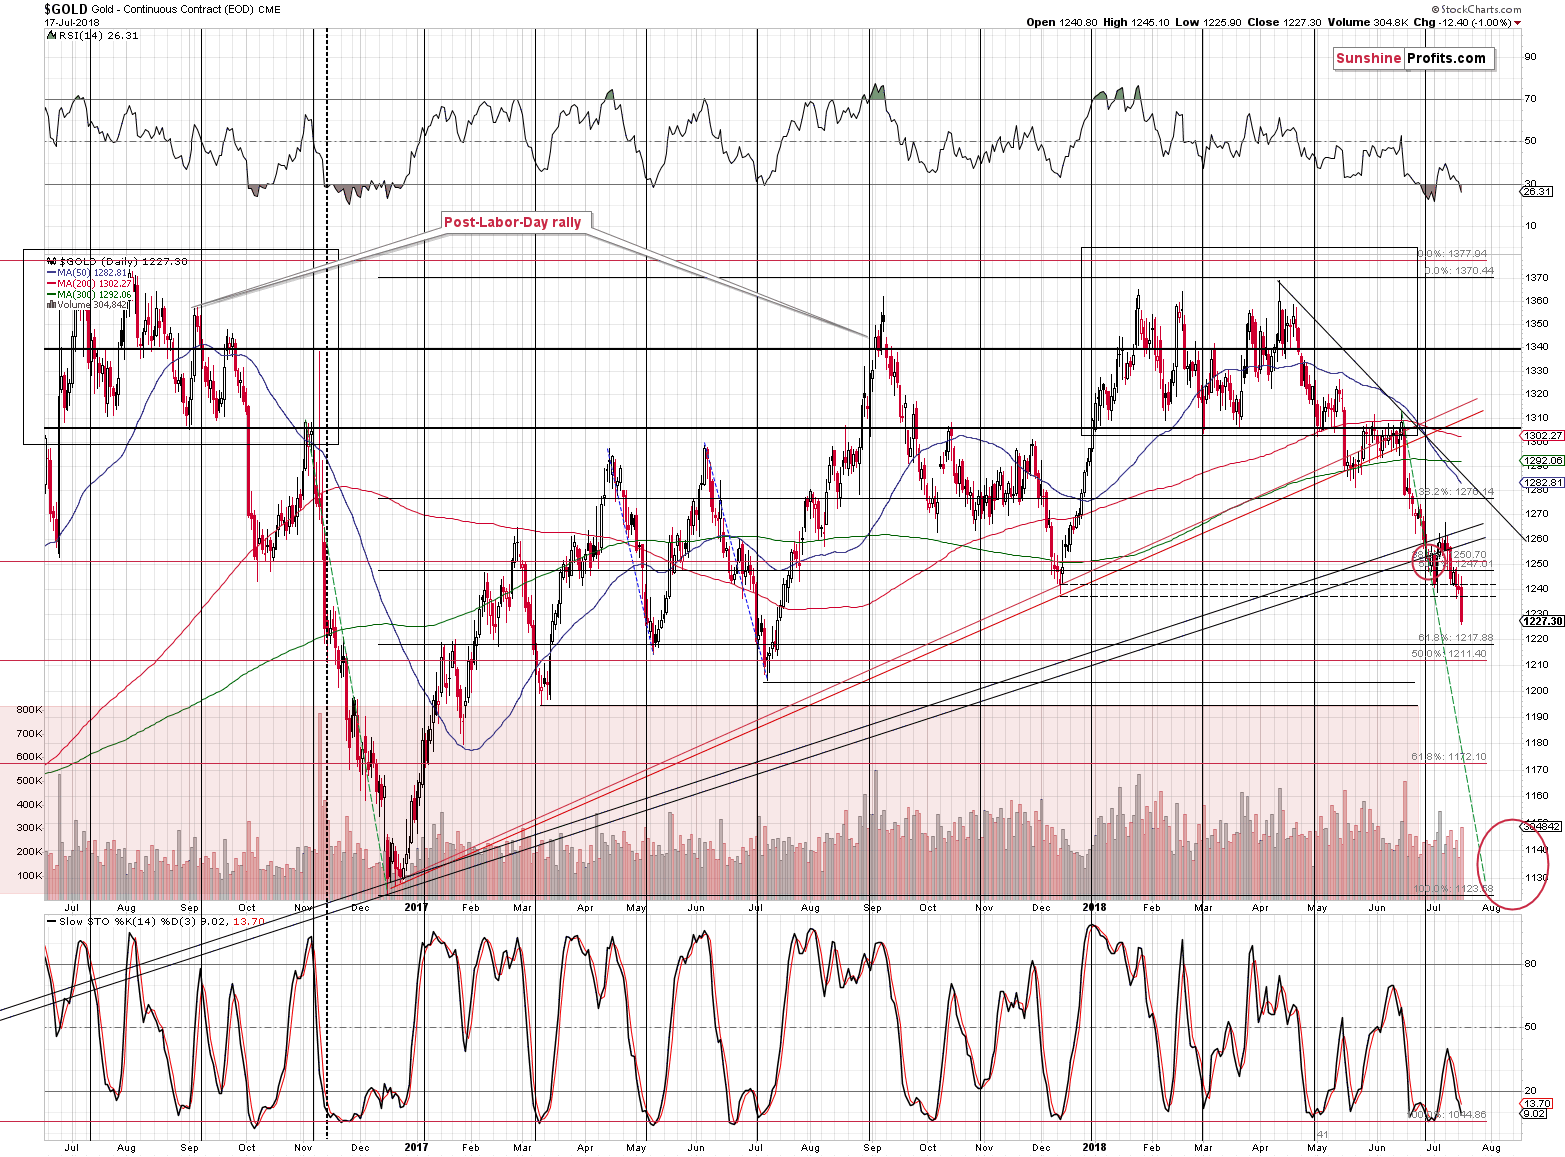
Gold showed substantial weakness when the USD index moved lower in the previous days, and we explained that this meant that gold was likely to decline more visibly during the USD’s rally. And it did. The US currency moved higher yesterday, while the yellow precious metal moved to new yearly lows and below the December 2017 bottom. This breakdown took place on high volume, which further confirmed the bearish outlook.
The are several nearby support levels and the most visible one is the one based on the July 2017 low – just a few dollars above $1,200. Will we see a rebound once gold moves to this level? It’s not that clear. If we didn’t expect gold to slide very far in the next few months, we would probably focus on a rebound. But in light of multiple bearish signs of medium-term nature and the powerful breakdown in the yen, it may not be the best course of action.
It was already very difficult to profit on the previous corrective upswing (but we did thanks to sizable profits from mining stocks) and this case could be even trickier. If we get a lot of bullish signs, we might adjust the position, but we are not doing so right now. If we see a rebound and we don’t take advantage of it, please keep in mind that it will be a deliberate decision based on the risk to reward ratio. It will not be something that we “fail to do”, but something that we know that may happen, but that will most likely not be worth acting on.
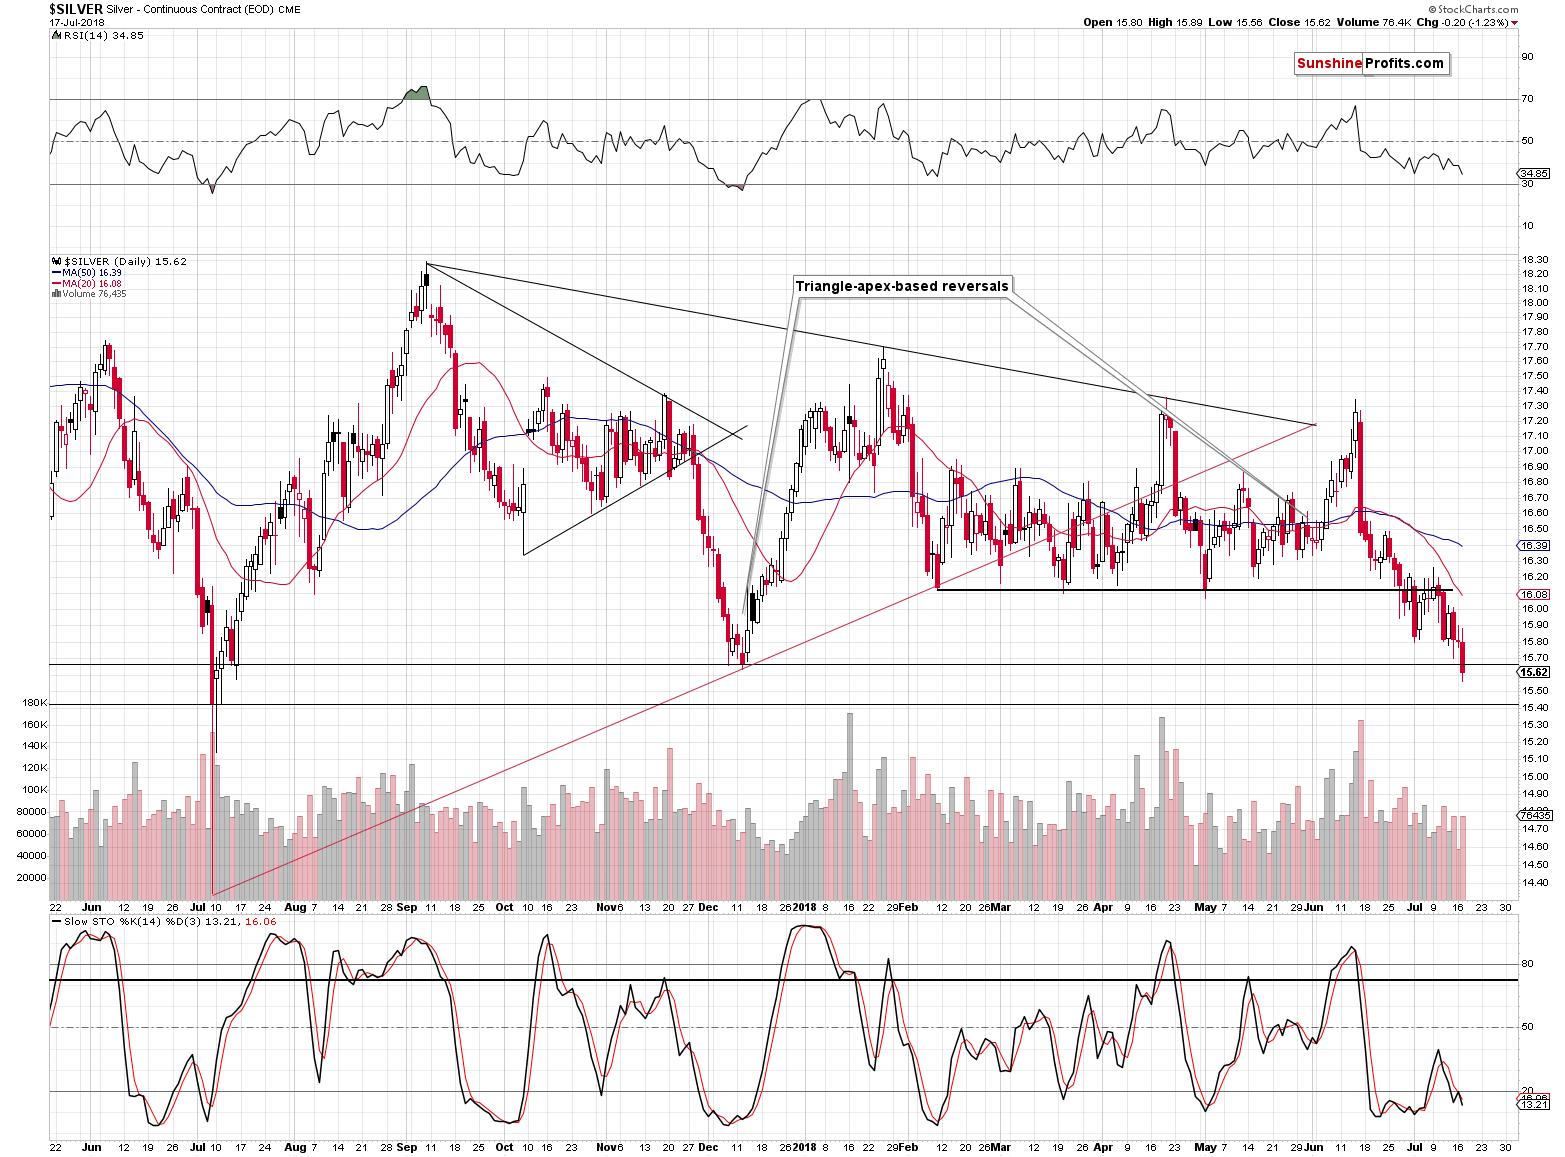
Silver broke below its December 2016 low, just like gold did. The next target is based on the July bottom in terms of the closing prices. Yet, reaching it will not automatically mean that we’ll close the current short position. This level is not as significant as the intraday extreme. If silver moved below $14.40, it would mean that a major support was reached, but $15.40 may not be enough to trigger a corrective upswing on its own.
At the moment of writing these words, silver is already at 15.40 and it’s not moving sharply higher from here – in fact, it’s been trading around this level for a few hours.
There are no signs of strength in the precious metals market (except for the one seen in mining stocks, which – as we explained – doesn’t really count yet), so we’re keeping the current position intact.
The most important short-term reason for us keeping the positions intact, however, comes from the forex market.
USD’s Inconsequential Decline
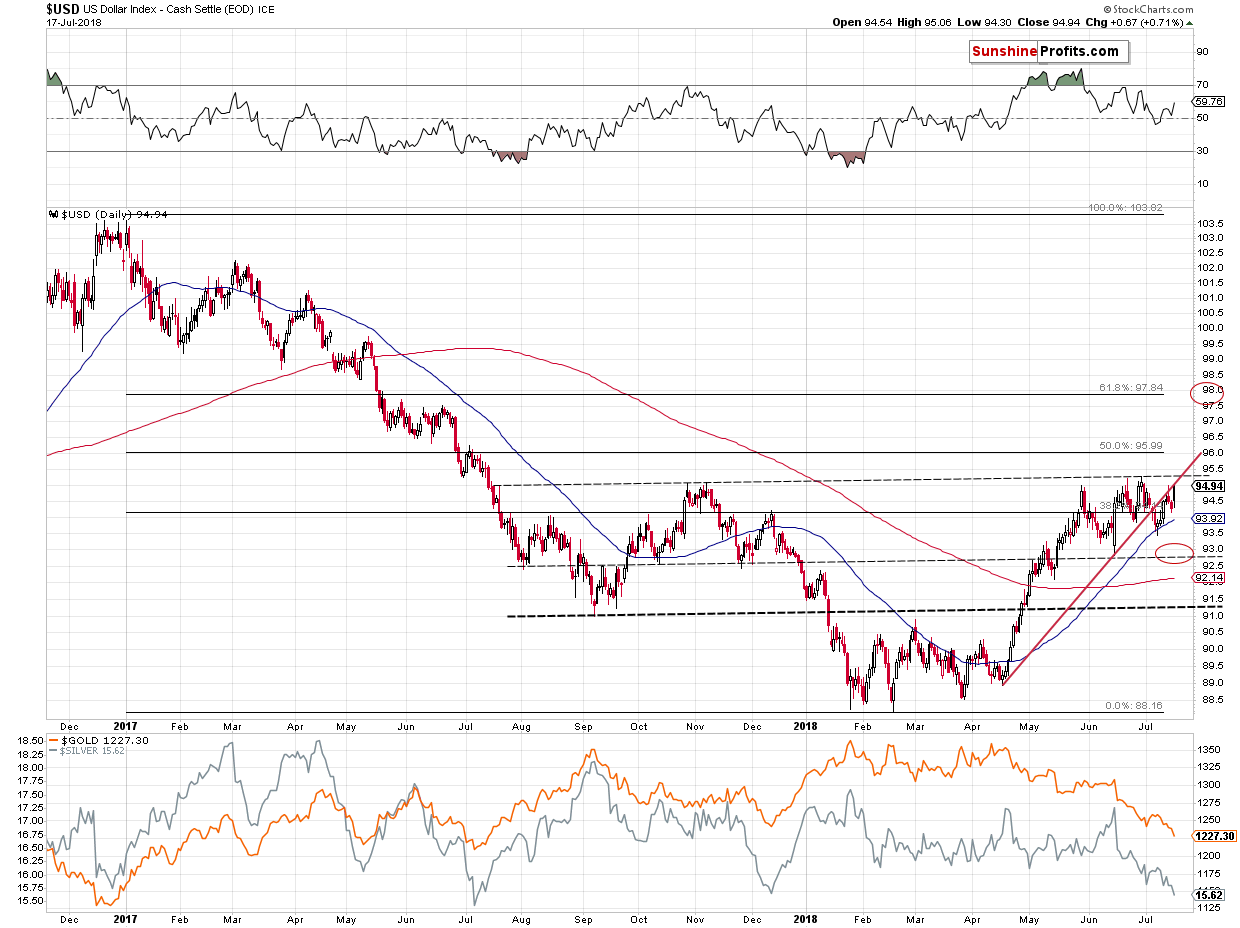
The USD Index rallied yesterday and moved back to the rising red support line. More importantly, however, the USD Index moved higher once again today, which means that – even though it’s not visible on the above chart – it just moved back above it.
This means that the technical outlook for the USDX improved. Once we see the daily close above the red line and the previous 2018 high, we’ll know that the next big upswing in the US currency is most likely underway.
On a side note, please note that while the USDX is not yet at new 2018 highs, gold and silver are both at new 2018 lows. This is a sign of weakness in the precious metals sector.
Having said that, let’s move to the part of the USD Index that’s particularly closely connected to gold’s performance – the Japanese yen.
Yen’s Verification
In the previous Alerts, we wrote the following about the Japanese currency:
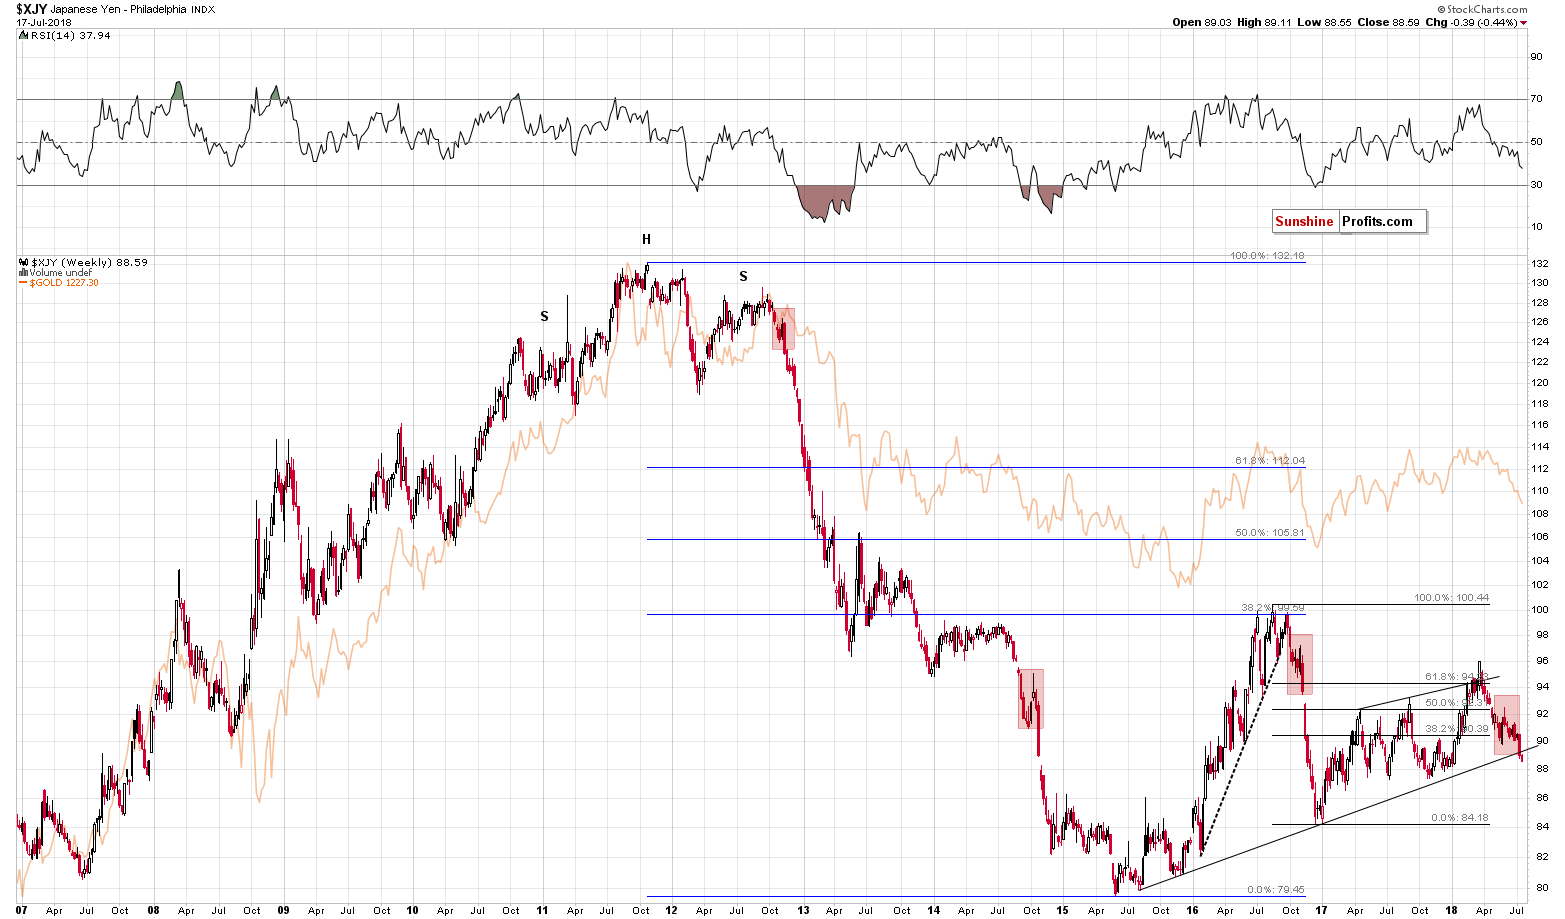
And we saw it. The Japanese yen just broke below the key long-term support line. Also, when viewing the currency while using the linear scale instead of a logarithmic one, this breakdown took place even sooner.
This is the most profound development on the long-term yen chart since the late-2016 breakdown. The results are clearly visible – a huge decline in the currency. And in gold.
There are multiple factors pointing to lower gold prices right now and this breakdown is one of the most important ones. Naturally, the breakdowns need to be confirmed, before their implications are completely bearish. But, let’s keep in mind that the yen is already after short- and medium-term breakdowns.
The Japanese yen closed the week below the rising long-term support line and the breakdown below the medium-term support line was confirmed by the third consecutive close below it. Both mean that the outlook for the Japanese currency has deteriorated substantially for the following weeks.
Due to the strong link between gold and yen, the above means that the odds of seeing a huge decline in the following weeks (not necessarily days, though, but we’ll move to that in the next paragraph) in both: the yen and the precious metals sector increased substantially.
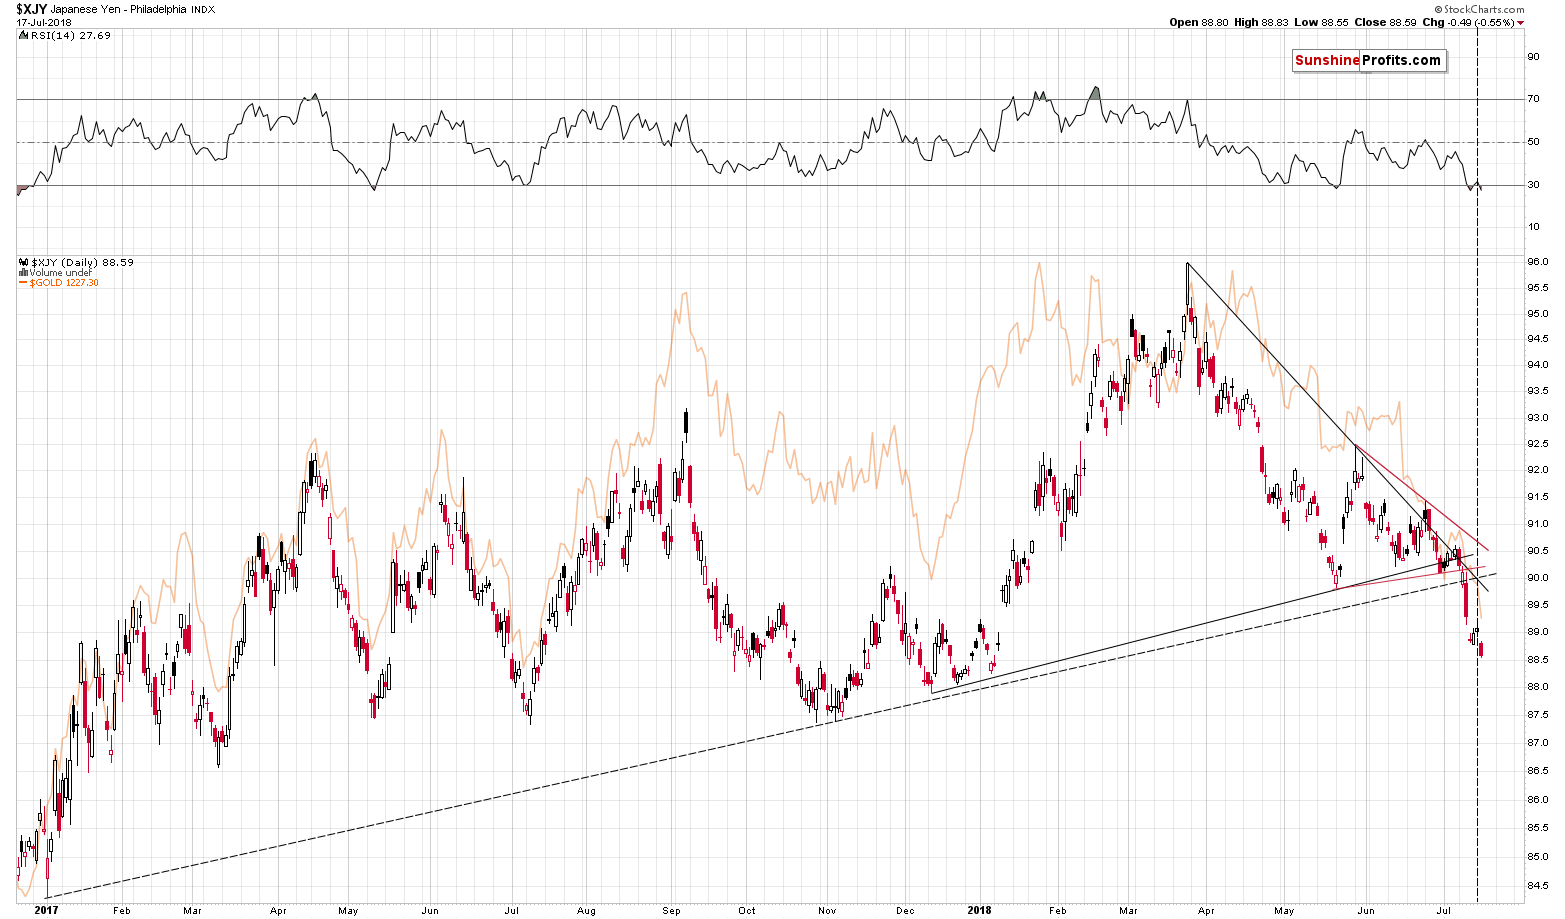
Let’s keep in mind that there’s a triangle-apex-based reversal today (vertical dashed line), which may mean that we can see some kind of reversal today and a very short-term rally. This would likely serve as a quick verification of the breakdown below the long-term support line. The verification of a breakdown is not a bullish phenomenon, but a bearish one and it doesn’t seem that one should adjust their positions based on just the above. The same goes for the very short-term outlook in the case of gold and the rest of the precious metals sector.
In other words, a short-term corrective upswing may take place and if it does, there’s no need to be stressed about it – it will be the normal course of action. Action that we think is best to be left ignored – i.e. we don’t think that adjusting the positions is a good idea. Why? Because of what happened after similar situations in the past.
That’s exactly what happened – we saw a small, short-term upswing as indicated by the apex of the triangle and it was nothing important – the decline followed shortly thereafter.
Please take one more look at the long-term Japanese yen chart. There were three similar cases to the very recent one and we marked them with red rectangles. All corrective upswings after these similar patterns were so tiny that they are practically invisible on the above chart. In all these cases it was much better to just hold on to a position than to try to time every correction. That’s what we plan to do in the near term with regard to our positions in the metals – unless something major happens we’ll likely stick to the short positions.
All in all, the implications for the precious metals market are very bearish.
All the above remains up-to-date. The slide in the Japanese yen is likely to be big and the corrections in it may be tiny, or even nonexistent. This means that we shouldn’t expect huge rallies in gold anytime soon. Short-term corrections may take place, but unless we see strong bullish signals, it may be best to simply keep the short position intact.
Summary
Summing up, the outlook for the precious metals is extremely bearish for the following weeks and months, and – based on the situation in the USD Index and the Japanese yen - days. Naturally, we could still see a small move higher or a pause, but the odds for it are limited and it doesn’t seem that adjusting positions based on this possibility is a good idea.
The extra-large short positions in gold, silver, and mining stocks are definitely justified from the risk to reward point of view. The profits on the short position that we had opened only several days ago increased once again yesterday (and in today’s pre-market trading), and it’s likely that they will increase much more before this trade is over.
As always, we’ll keep you – our subscribers – informed.
To summarize:
Trading capital (supplementary part of the portfolio; our opinion): Full short positions (200% of the full position) in gold, silver and mining stocks are justified from the risk/reward perspective with the following stop-loss orders and initial target price levels:
- Gold: initial target price: $1,142; stop-loss: $1,272; initial target price for the DGLD ETN: $63.96; stop-loss for the DGLD ETN $46.38
- Silver: initial target price: $14.42; stop-loss: $16.46; initial target price for the DSLV ETN: $32.97; stop-loss for the DSLV ETN $24.07
- Mining stocks (price levels for the GDX ETF): initial target price: $19.12; stop-loss: $23.64; initial target price for the DUST ETF: $37.97; stop-loss for the DUST ETF $20.87
In case one wants to bet on junior mining stocks' prices (we do not suggest doing so – we think senior mining stocks are more predictable in the case of short-term trades – but if one wants to do it anyway, we provide the details), here are the stop-loss details and initial target prices:
- GDXJ ETF: initial target price: $28.10; stop-loss: $34.82
- JDST ETF: initial target price: $74.83 stop-loss: $42.78
Long-term capital (core part of the portfolio; our opinion): No positions (in other words: cash)
Insurance capital (core part of the portfolio; our opinion): Full position
Important Details for New Subscribers
Whether you already subscribed or not, we encourage you to find out how to make the most of our alerts and read our replies to the most common alert-and-gold-trading-related-questions.
Please note that the in the trading section we describe the situation for the day that the alert is posted. In other words, it we are writing about a speculative position, it means that it is up-to-date on the day it was posted. We are also featuring the initial target prices, so that you can decide whether keeping a position on a given day is something that is in tune with your approach (some moves are too small for medium-term traders and some might appear too big for day-traders).
Plus, you might want to read why our stop-loss orders are usually relatively far from the current price.
Please note that a full position doesn’t mean using all of the capital for a given trade. You will find details on our thoughts on gold portfolio structuring in the Key Insights section on our website.
As a reminder – “initial target price” means exactly that – an “initial” one, it’s not a price level at which we suggest closing positions. If this becomes the case (like it did in the previous trade) we will refer to these levels as levels of exit orders (exactly as we’ve done previously). Stop-loss levels, however, are naturally not “initial”, but something that, in our opinion, might be entered as an order.
Since it is impossible to synchronize target prices and stop-loss levels for all the ETFs and ETNs with the main markets that we provide these levels for (gold, silver and mining stocks – the GDX ETF), the stop-loss levels and target prices for other ETNs and ETF (among other: UGLD, DGLD, USLV, DSLV, NUGT, DUST, JNUG, JDST) are provided as supplementary, and not as “final”. This means that if a stop-loss or a target level is reached for any of the “additional instruments” (DGLD for instance), but not for the “main instrument” (gold in this case), we will view positions in both gold and DGLD as still open and the stop-loss for DGLD would have to be moved lower. On the other hand, if gold moves to a stop-loss level but DGLD doesn’t, then we will view both positions (in gold and DGLD) as closed. In other words, since it’s not possible to be 100% certain that each related instrument moves to a given level when the underlying instrument does, we can’t provide levels that would be binding. The levels that we do provide are our best estimate of the levels that will correspond to the levels in the underlying assets, but it will be the underlying assets that one will need to focus on regarding the signs pointing to closing a given position or keeping it open. We might adjust the levels in the “additional instruments” without adjusting the levels in the “main instruments”, which will simply mean that we have improved our estimation of these levels, not that we changed our outlook on the markets. We are already working on a tool that would update these levels on a daily basis for the most popular ETFs, ETNs and individual mining stocks.
Our preferred ways to invest in and to trade gold along with the reasoning can be found in the how to buy gold section. Additionally, our preferred ETFs and ETNs can be found in our Gold & Silver ETF Ranking.
As a reminder, Gold & Silver Trading Alerts are posted before or on each trading day (we usually post them before the opening bell, but we don't promise doing that each day). If there's anything urgent, we will send you an additional small alert before posting the main one.
=====
Latest Free Trading Alerts:
Let’s face it: the Fed’s tightening always ended with some sort of market crisis. Will this time be different? We invite you to read our today’s article about the current tightening cycle and find out whether it will bring the next catastrophe to the world.
Will the Fed’s Tightening Trigger Another Crisis?
The first session of this week was undoubtedly dominated by the sellers. Thanks to their sharp attack, black gold lost over 4%, making oil bears’ short positions even more profitable. Will it still be possible to earn money on crude oil in the coming week?
What Did Crude Oil - Platinum Link Tell Us Last Week?
=====
Hand-picked precious-metals-related links:
PRECIOUS-Gold slumps to lowest in a year on strong dollar, weak oil
Silver's Solar Demand 'Down 40% by 2024'
Gold ETF Holdings plunge to lowest level since March
This Could Finally Be The Time To Buy Gold - BAML Survey
=====
In other news:
What Fed Chair Powell sees when he looks at the flattening yield curve
Fed’s Powell Says Gradual Rate Hikes Are the Best Path ‘For Now’
Bernanke, Geithner, Paulson Voice Some Concern About Next Crisis
Stocks hit one-month high, dollar puts squeeze on gold
UK rate hike in doubt after weak inflation figures
Google hit with record $5 billion EU antitrust fine
Texas to pass Iraq and Iran as world's No. 3 oil powerhouse
Oil prices fall on U.S. stock rise, higher supply
=====
Thank you.
Sincerely,
Przemyslaw Radomski, CFA
Founder, Editor-in-chief, Gold & Silver Fund Manager
Gold & Silver Trading Alerts
Forex Trading Alerts
Oil Investment Updates
Oil Trading Alerts

