

U.S. consumer spending rose 0.1 percent in March. What does it mean for the gold market?
Consumers Save Instead of Spending
Personal consumption expenditures increased merely 0.1 percent in March. The number was slightly lower than in February and below the expectations. It means that consumer spending is decelerating. The chart below shows that the annual pace of growth remained in the downward trend which started in August 2014.
Chart 1: Personal consumption expenditures from 2011 to 2016 (as percent change from year ago).
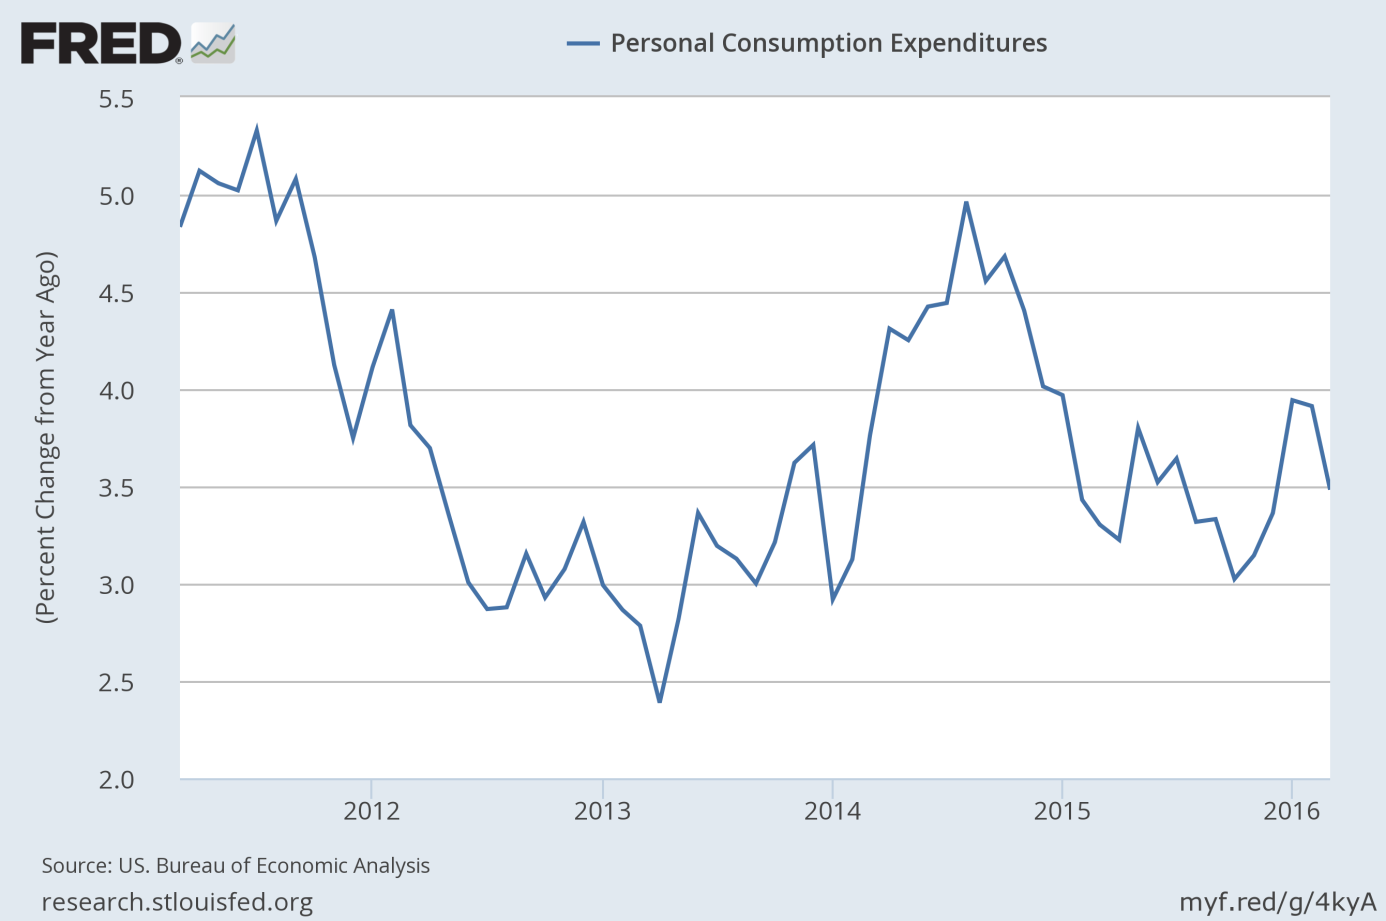
Personal incomes increased 0.4 percent in March, but consumers were still cautious and boosted their savings. Personal saving as a percentage of disposable personal income rose to 5.4 percent from 5.1 percent in previous month. The increased personal saving rate casts doubts whether the consumer sentiment is as strong as it is commonly believed.
GDP Decelerates in Q1 2016
Consumer spending slowed down, but was still strong enough to positively contribute to the GDP in the first quarter of 2016. However, according to the advance estimate, the U.S. economy rose just by 0.5 percent, the slowest annual pace in two years, as one can see in the chart below. The number was below the economists’ expectations, but close to 0.6-percent forecast conducted by the Atlanta Fed’s GDPNow model.
Chart 2: Real GDP growth (as percent change) from 2011 to 2016
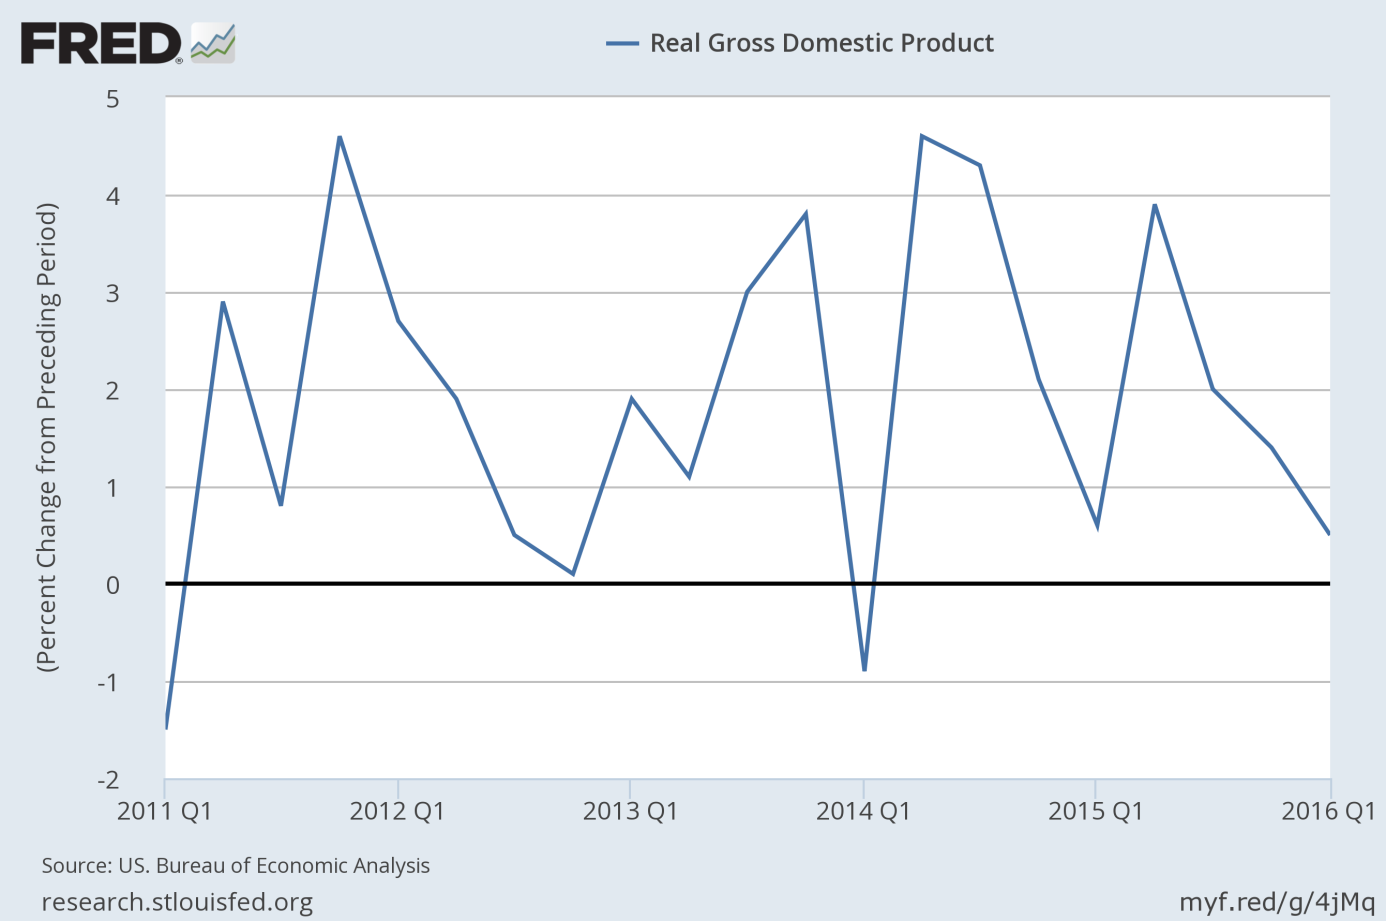
What is worrying is that the deceleration in GDP growth reflected a decrease in nonresidential fixed investment. Another troubling issue is that unlike last year, this year’s first quarter was not hit by severe weather. It also seems that the falling oil prices did not boost the U.S. economy.
Surely, the BEA revisions may do the trick and increase the GDP growth in next estimates; however we do not believe in a significant rebound in the second quarter. Nonresidential investments are not likely to bounce back, not before presidential elections. The corporate revenues and earnings are falling, while corporate defaults are rising – in such an environment investors should not expect a major improvement in business investments. Moreover, entrepreneurs are expected to continue destocking – thus, inventories also are likely to pull down the GDP.
Are We Heading into Stagflation?
The PCE price index increased 0.1 percent in March, following 0.1 percent decrease in February. The core PCE price index, which excludes food and energy, edged up 0.1 percent, following an increase of 0.2 percent in February. On an annual basis, the PCE price index increased 0.8 percent in March, while the core PCE price index rose 1.6 percent. It means that inflationary pressure softened further, as one can see in the chart below.
Chart 3: PCE Price Index (blue line) and Core PCE Price Index (red line) as a percent change from year ago, from 2011 to 2016.
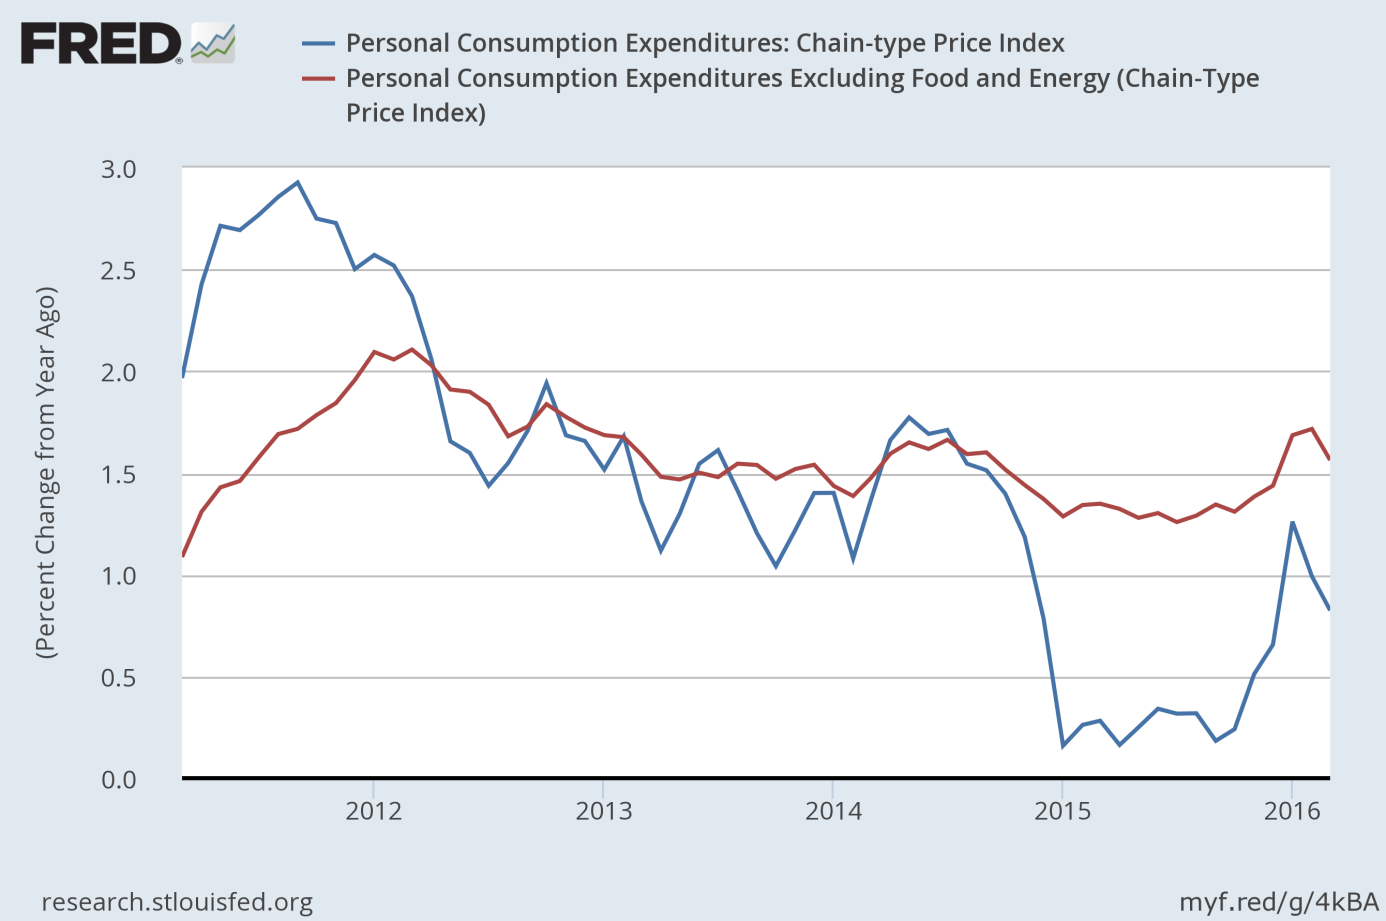
However, if inflation picks up and the GDP growth weakens further, the U.S. economy will fall into stagflation, i.e. a stagnation accompanied by inflation. It goes without saying that in such environment the gold would shine, as it did in the 1970s. Of course, there is a long way for that – it is unlikely that the Fed would allow for the realization of such a scenario.
Recent U.S. Economic Data and Gold
The recent data on U.S. consumer spending, GDP growth and other aspects of the economy (for example, orders for U.S. durable goods were weak and climbed just 0.8 percent in March, below the expectations, while the Markit U.S. Manufacturing PMI fell in April to 50.8, the lowest level in more than six years) is soft. Consequently, we believe that the odds for a Fed hikes this year are reduced. The weak U.S. economic data may reprice the expectations of significant Fed’s tightening cycle and pushed the greenback lower. This is what we are observing now. The lack of Fed hikes since December 2015 combined with the Bank of Japan and the European Central Bank’s inaction in April weighted on the U.S. dollar. In consequence, the shiny metal should be supported by the current economic data. The price of gold was sharply higher and reached a 15-month high at $1,291 in late-morning trading Friday.
Disclaimer: Please note that the aim of the above analysis is to discuss the likely long-term impact of the featured phenomenon on the price of gold and this analysis does not indicate (nor does it aim to do so) whether gold is likely to move higher or lower in the short- or medium term. In order to determine the latter, many additional factors need to be considered (i.e. sentiment, chart patterns, cycles, indicators, ratios, self-similar patterns and more) and we are taking them into account (and discussing the short- and medium-term outlook) in our trading alerts.
Thank you.
Arkadiusz Sieron
Sunshine Profits‘ Gold News Monitor and Market Overview Editor
Gold News Monitor
Gold Trading Alerts
Gold Market Overview

