

Please log in to read the entire text.
If you don’t have a login yet, please select your access package.
The upcoming stagflation might be less severe than in the 1970s. So is the Fed’s reaction, which could mean good news for gold.
There are many terrifying statements you can hear from another person. One example is: “Honey, we need to talk!” Another is: “I’m from the government and I’m here to help.” However, the scariest English word, especially nowadays, is “stagflation.” Brrr!
I’ve explained it many times, but let me remind you that stagflation is a combination of economic stagnation and high inflation. This is why it’s a nightmare for central bankers as they should ease monetary policy to stimulate the economy and simultaneously tighten it to curb inflation.
Although we haven’t fallen into recession yet, the pace of GDP growth has slowed down recently. According to the World Bank’s report Global Economic Prospects from June 2022, “the global economy is in the midst of a sharp growth slowdown” and “growth over the next decade is expected to be considerably weaker than over the past two decades.” The U.S. growth is expected to slow to 2.5 percent in 2022, 1.2 percentage points lower than previously projected and 3.2 percentage points below growth in 2021.
This is why more and more experts raise concerns about stagflation similar to what happened in the 1970s. So far, employment remains strong, but the misery index, which is the sum of the unemployment rate and inflation rate, is already relatively high (see the chart below) and could continue to rise if economic activity deteriorates further.
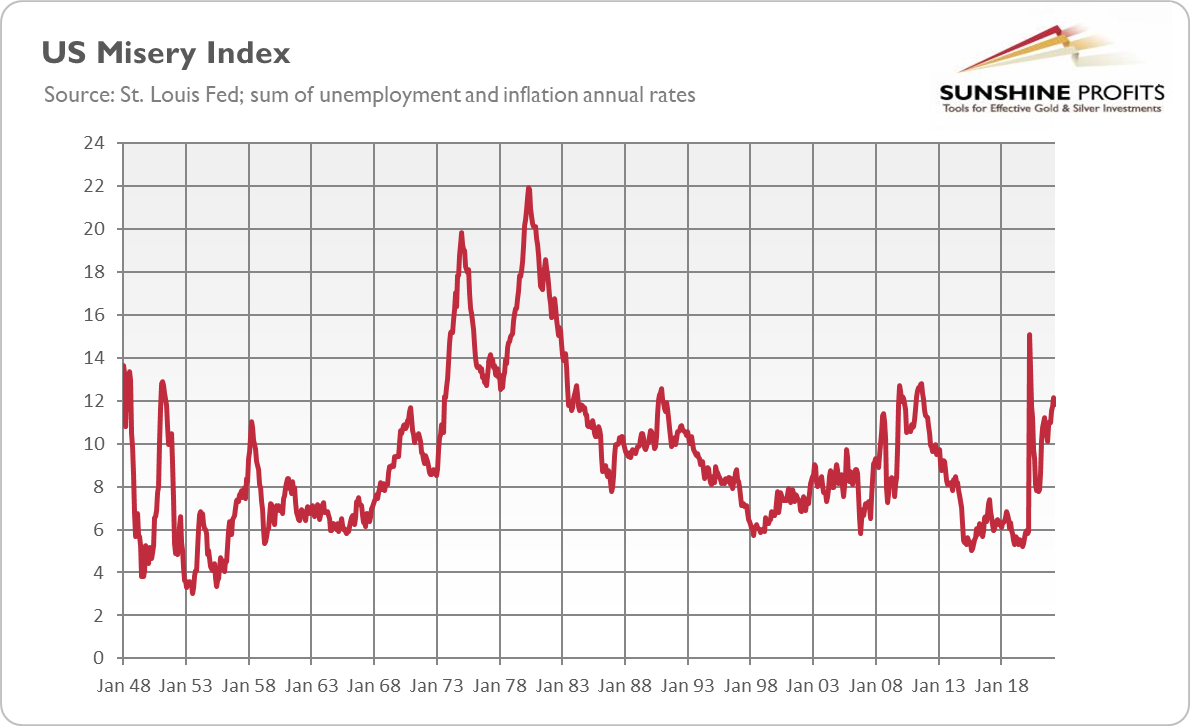
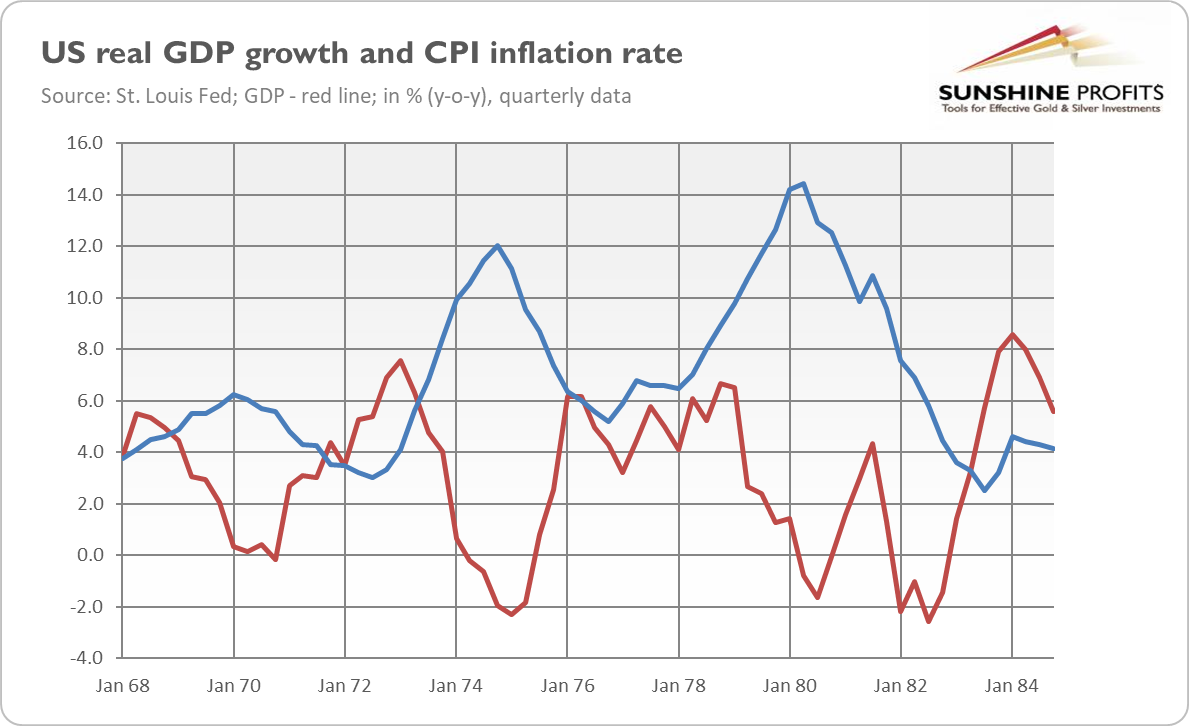
So, it seems that the consensus view is that stagflation is likely, but the key question is how bad it will be, or how similar it will be to the stagflation of the 1970s. As the chart below shows, that period was pretty bad. The inflation rate stayed above 5% for a decade, reaching almost 15% in early 1980. Meanwhile, there was a long and deep recession in 1973-1975 and the subsequent two in the 1980s, triggered by Volcker’s monetary tightening that was necessary to curb high inflation.
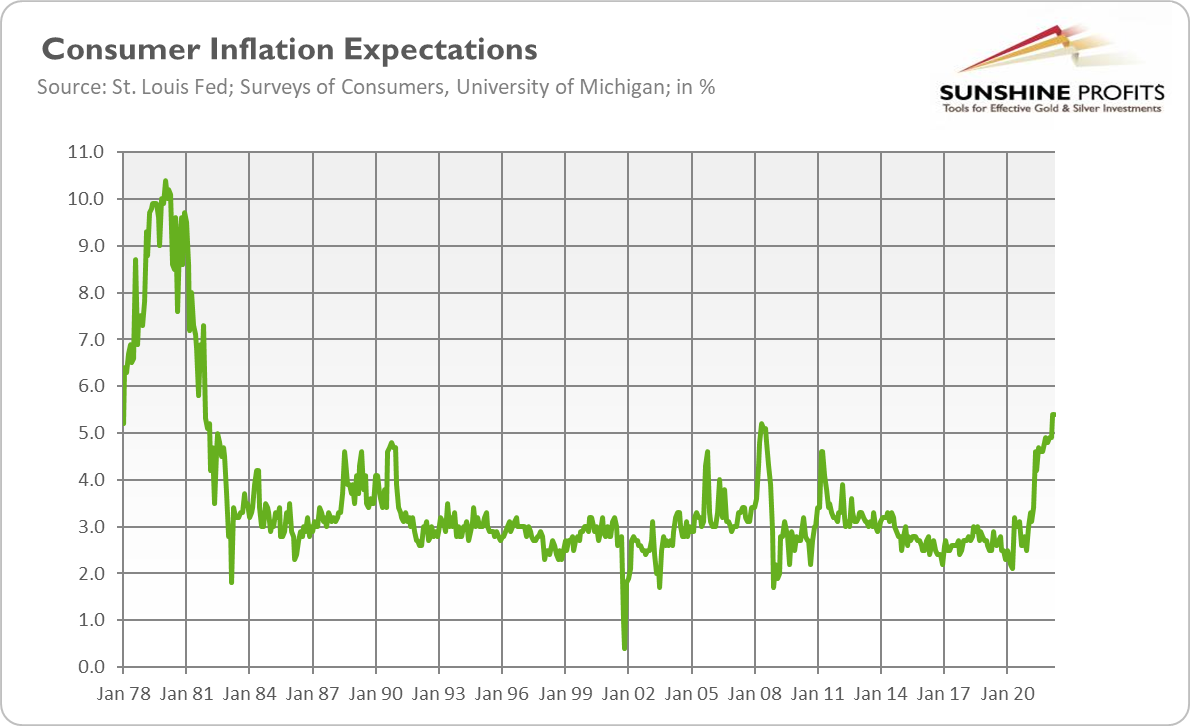
Similarities are quite obvious. First, the economic slowdown came after the previous recession and rebound. Second, supply shocks. Supply disruptions caused by the pandemic and by Russia’s invasion of Ukraine resemble the oil shocks of the 1970s. Third, the burst of inflation comes after prolonged period of easy monetary policy and negative real interest rates. According to the World Bank, “global real interest rates averaged -0.5 percent over both the 1970-1980 and the 2010-2021 periods”. Fourth, consumer inflation expectations are rising significantly, which increases the risk of their de-anchoring, as in the 1970s. As the chart below shows, consumers now expect inflation to run at 5.4% over the next twelve months, according to the University of Michigan survey, the highest level since 1981.
However, the World Bank also points out important differences. First, the magnitude of commodity price jumps has been smaller than in the 1970s. Oil prices are still below the peaks from those years, especially in real terms, while the economy is much more energy-dependent. Second, the fiscal stance is tighter now. In the 1970s, fiscal policy was very easy, while now it’s expected to tighten, which could help to curb inflation. According to the CBO, the federal budget deficit will shrink to $1.0 trillion in 2022 from $2.8 trillion last year.
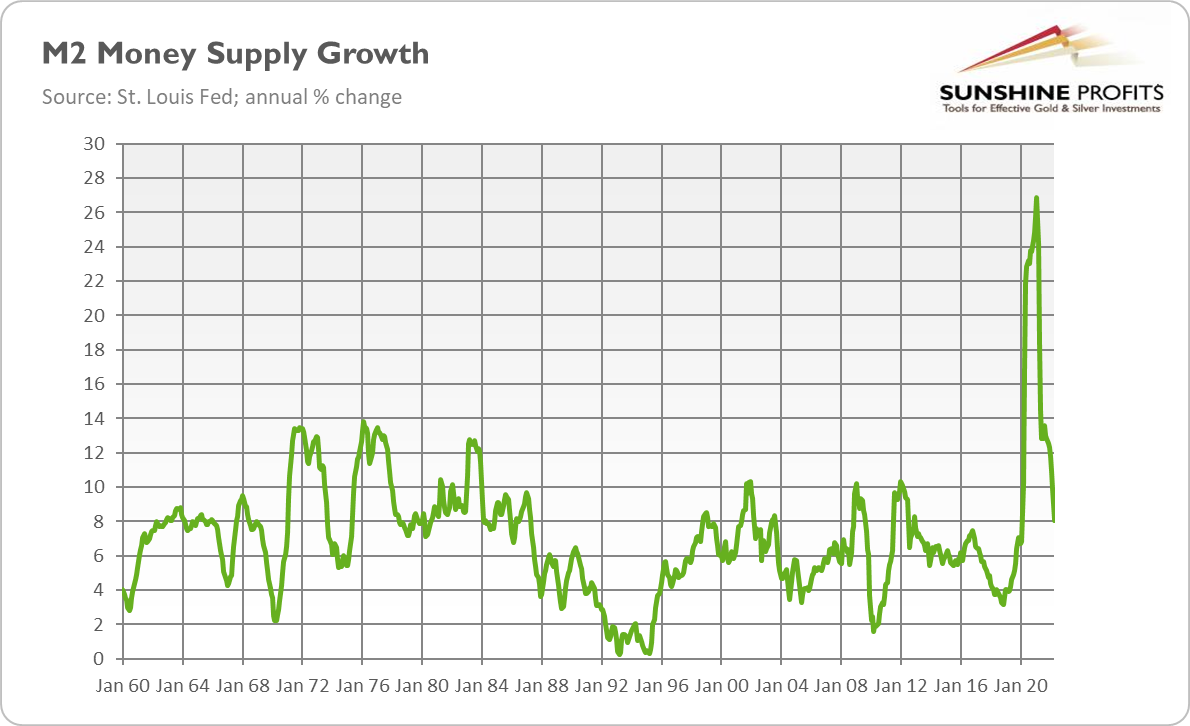
Third, the M2 money stock M2 ballooned after the pandemic by 40% in just two years. So, the increase in the money supply was much more abrupt, although it was rather a one-time outburst than a constant fast pace of money supply growth as it was in the 1970s (see the chart below). Thus, the pattern of inflation could be similar.
Fourth, contemporary economies are much more flexible with the weaker position of trade unions, and income and price policies (like interest or price controls) are not popular today. It allows a faster response of supply to rising prices and reduces the likelihood of price-wage spirals. The fifth difference mentioned by the World Bank is more credible monetary policy frameworks and better-anchored inflation expectations. Although true, I would be cautious here, as the Fed remains behind the curve and people could quickly lose confidence in the central bank while inflation expectations could easily de-anchor.
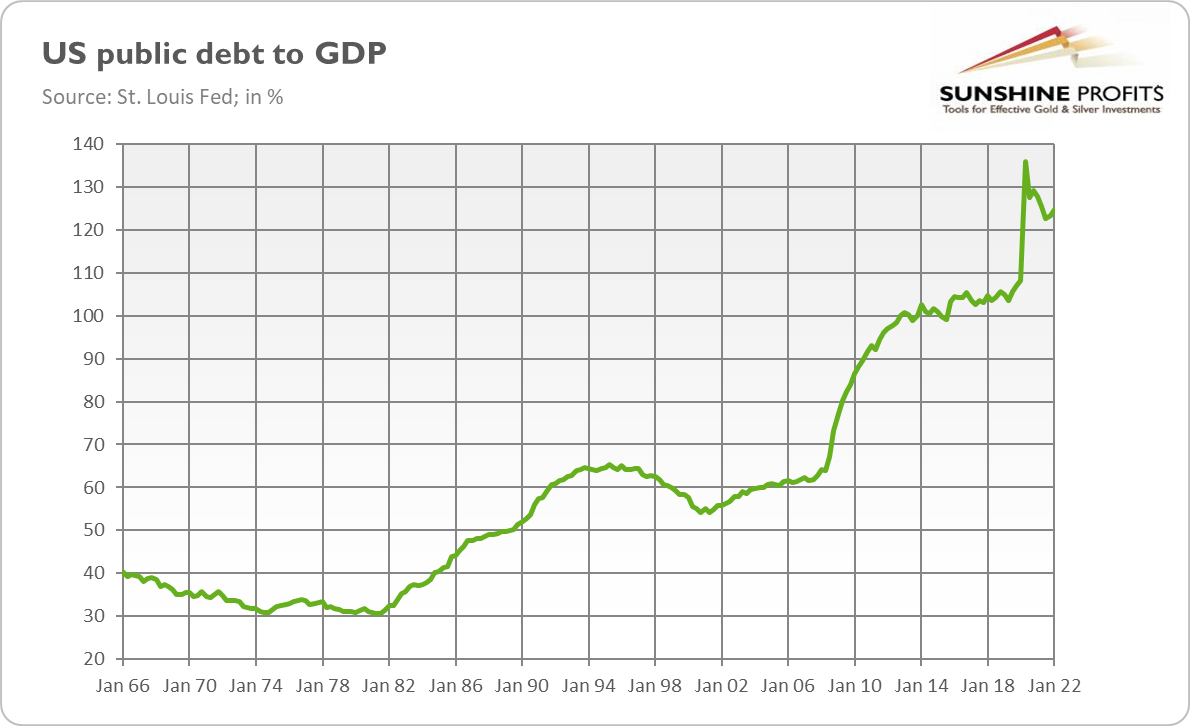
For me, the two crucial differences are the much higher levels of both private and public debt today compared to the 1970s (see the chart below) and less political willingness to combat inflation. Yes, Powell could have a laser focus on addressing inflation right now, but I seriously doubt whether he will stick with significantly raising interest rates, especially when the economy starts to falter.
So, what are the conclusions and implications for the gold market? Well, stagflation is indeed likely, as I expect a further economic slowdown next year, which will be accompanied by stubbornly elevated inflation, although rather lower than this year, thanks to normalization in the pace of money supply growth and tightening of both monetary and fiscal policies. Hence, the upcoming stagflation could be less severe than in the 1970s.
The Fed’s response will also be less aggressive. Luckily for the yellow metal, Powell is not Volcker, so he won’t raise the federal funds rate so decisively. Hence, the current Fed’s tightening cycle could continue to exert downward pressure on gold. However, when the Fed chickens out and deviates from its hawkish plan when faced with recessionary winds, gold should rally again.
Thank you for reading today’s free analysis. If you enjoyed it, and would you like to know more about the links between the economic outlook, and the gold market, we invite you to read the July Gold Market Overview report. Please note that in addition to the above-mentioned free fundamental gold reports, and we provide premium daily Gold & Silver Trading Alerts with clear buy and sell signals. We provide these premium analyses also on a weekly basis in the form of Gold Investment Updates. In order to enjoy our gold analyses in their full scope, we invite you to subscribe today. If you’re not ready to subscribe yet though and are not on our gold mailing list yet, we urge you to sign up. It’s free and if you don’t like it, you can easily unsubscribe. Sign up today!
Arkadiusz Sieron, PhD
Sunshine Profits: Effective Investment through Diligence & Care.
-----
Disclaimer: Please note that the aim of the above analysis is to discuss the likely long-term impact of the featured phenomenon on the price of gold and this analysis does not indicate (nor does it aim to do so) whether gold is likely to move higher or lower in the short- or medium term. In order to determine the latter, many additional factors need to be considered (i.e. sentiment, chart patterns, cycles, indicators, ratios, self-similar patterns and more) and we are taking them into account (and discussing the short- and medium-term outlook) in our Gold & Silver Trading Alerts.

