

Briefly: Outlook for the precious metals market remains bearish for the following few weeks, and bullish for the following months and years.
Welcome to this week's Gold Investment Update.
Quite a few things happened recently, including the last several hours, so today's analysis will feature mostly new comments. However, there are still some parts of the analysis that didn't change in the previous days, and we will put them in italics.
There are multiple fundamental reasons due to which gold is likely to soar in the upcoming years, however, even the most profound bull markets can't move up in a straight line and some corrections will take place. After big rallies, we're likely to see big corrections, and one is long-overdue in case of the precious metals market.
Just as it was in March, it seems that the visible worsening in the economic situation might trigger a sell-off.
At this point we would like to quote what we wrote about the aspects of the virus scare and how the market reacts to them. In short, gold (and other markets) reacted when people started to strongly consider the economic implications and this topic was ubiquitous in the media.
The particularly important factor for gold will likely be the economic implications of the second Covid-19 wave. How do we know that? Because we compared what people were searching for (online) with how gold prices shaped. There's a lot more data available on https://searchingcovid19.com/ but we'll focus on the chart that shows when people were getting interested in what aspects of the pandemic and we'll compare them to gold.
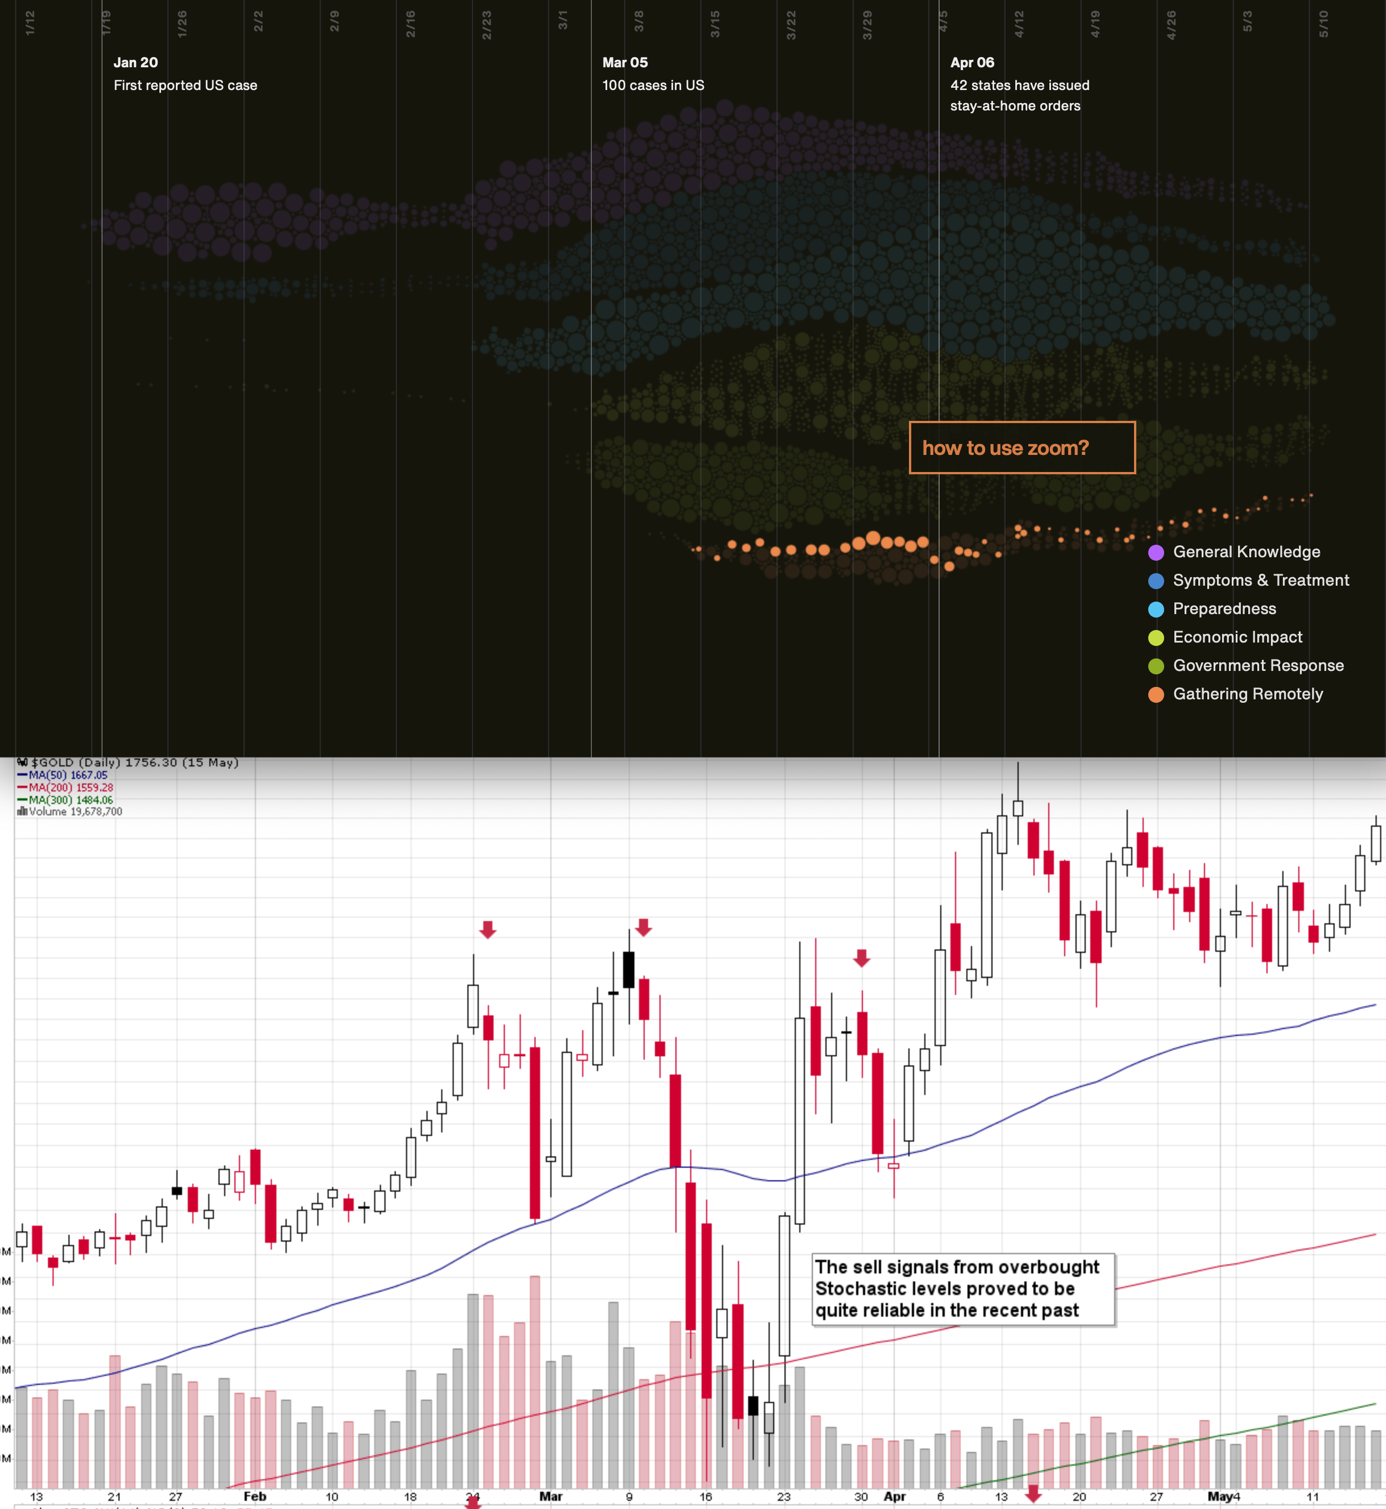
We aligned both charts with regard to time. The chart on the bottom is from Stockcharts.com and it features gold's continuous futures contract. The gold price (and the USD Index value) really started to move once people got particularly interested in the economic impact of the pandemic and in the government's response.
In the recent days (and weeks) the news is dominated by other issues. Once people start considering the economic implications of the second wave of this coronavirus, the prices would be likely to move.
The news coming from the Fed is positive for gold in the long run, but in the short term, they continue to indicate risk for the economy. This risk is likely to translate into lower stock values and initially gold is likely to slide given the above - just like it did in March.
All in all, gold is likely to rally far in the long run, but in the short run it's vulnerable to a sizable decline, when the economic implications of the pandemic's continuation become obvious to investors.
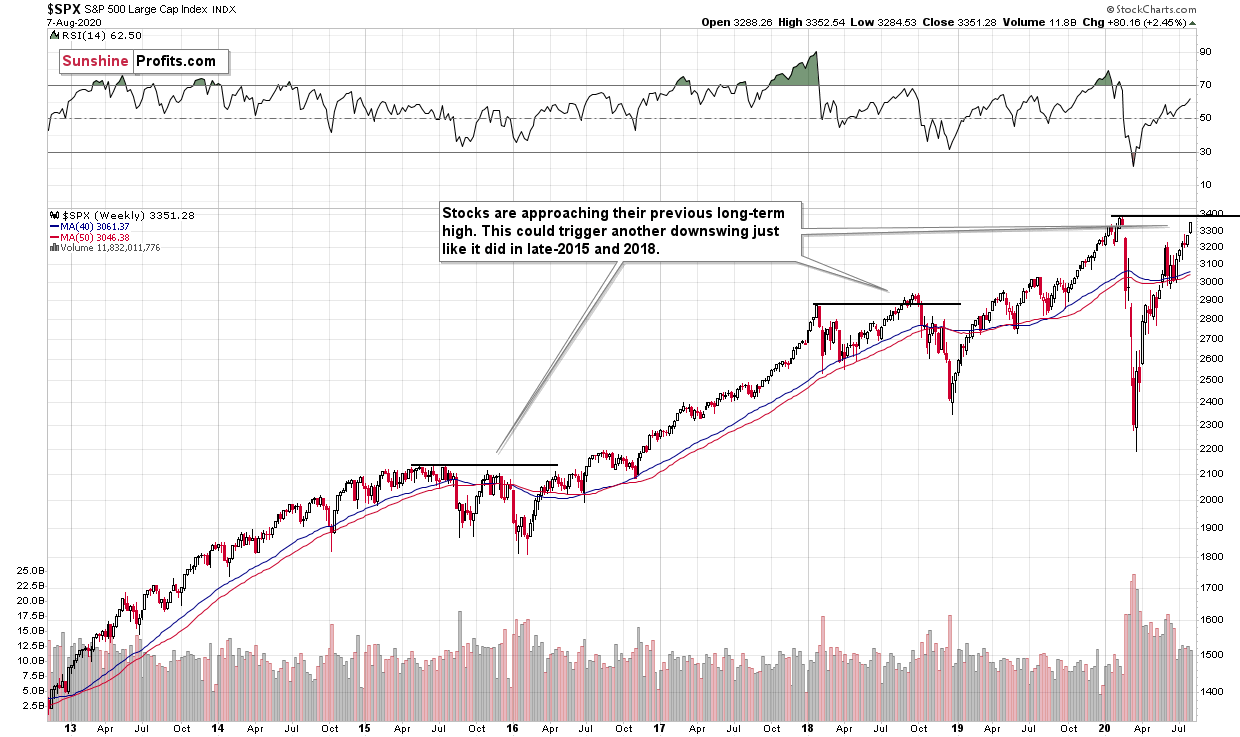
The S&P 500 is approaching its previous 2020 high. Given the economic background, I find this performance unfounded. But the markets can stick to a certain emotional trend for longer than many investors can remain logical, which would fit the above picture.
Back in 2015 stocks topped below their previous highs, and in 2018 they topped a bit above them, so the proximity to the previous is far from being a precise sell signal. It does indicate, that the stock market is likely vulnerable to sell signals coming from other markets and that this emotional rally could end sooner rather than later.
Do you remember what happened in February when the S&P 500 lost its upward momentum? They plunged, and that was when tops in mining stocks and silver formed. Gold made another attempt to move higher but ultimately declined profoundly in the following days.
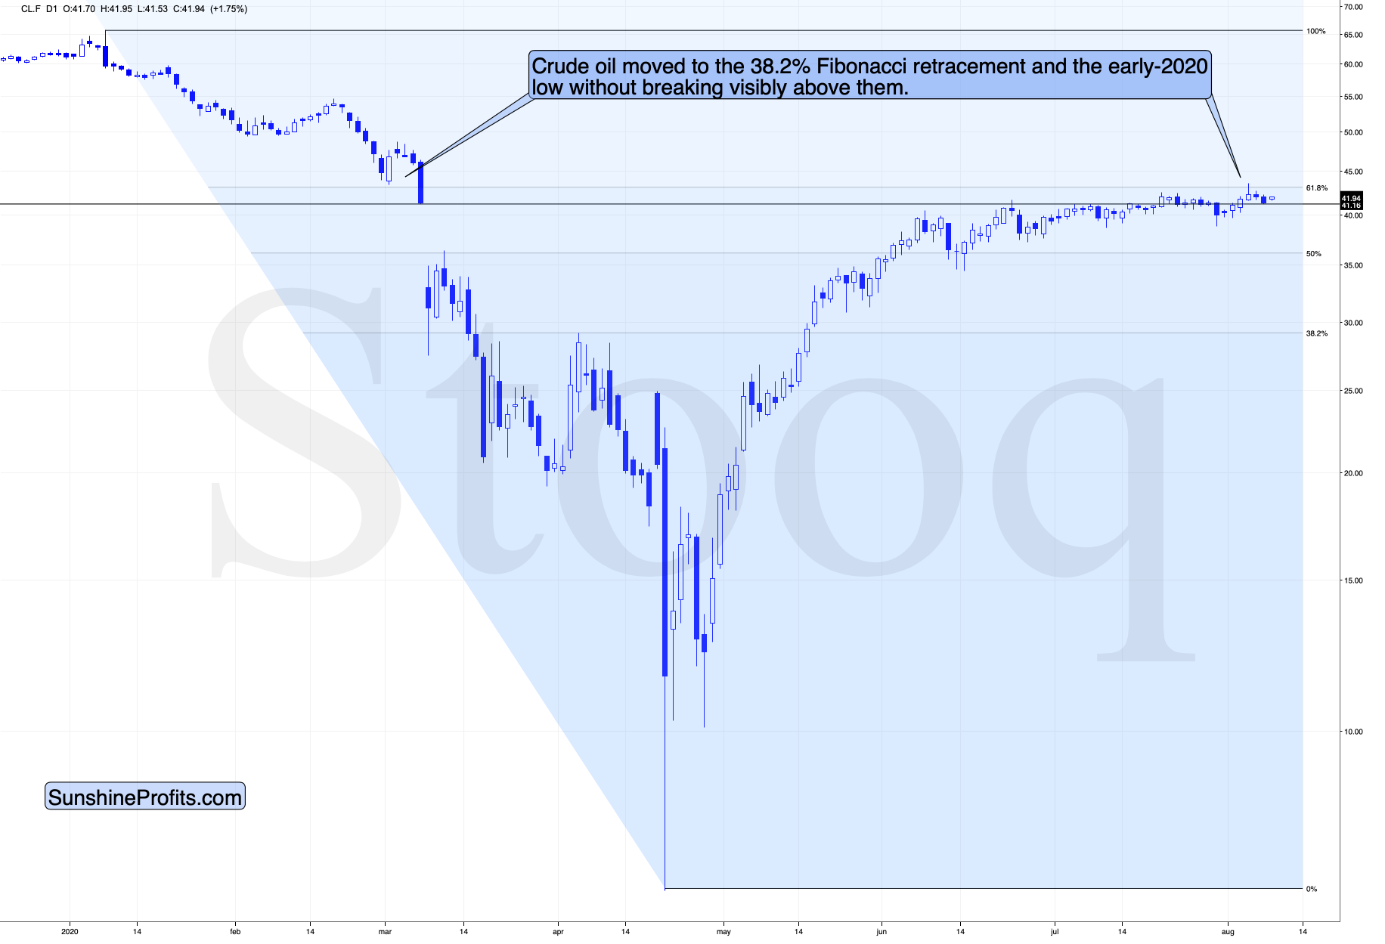
Back then, crude oil was relatively weak - and we see this weakness also this time. The black gold's upswing seems to have ended in June, but it made another attempt to move higher recently. It failed to move above the 61.8% Fibonacci retracement based on the entire 2020 decline and it seems to be ready to move lower shortly.
It appears that on one hand, everything that could have gone well for gold on the fundamental front, has already gone well, and it already rallied, and on the other hand, we have many signals pointing to the situation being excessive. This means that as some of the bullish factors ease (perhaps temporarily) and investors get scared about economy's ability to really recover, gold is likely to correct significantly, before continuing its upward march.
Speaking of indications pointing to the situation being excessive, let's take a look at the USD Index.
Remember when in early 2018 we wrote that the USD Index was bottoming due to a very powerful combination of support levels? Practically nobody wanted to read that as everyone "knew" that the USD Index is going to fall below 80. We were notified that people were hating on us in some blog comments for disclosing our opinion - that the USD Index was bottoming, and gold was topping. People were very unhappy with us writing that day after day, even though the USD Index refused to soar, and gold was not declining.
Well, it's the same right now.
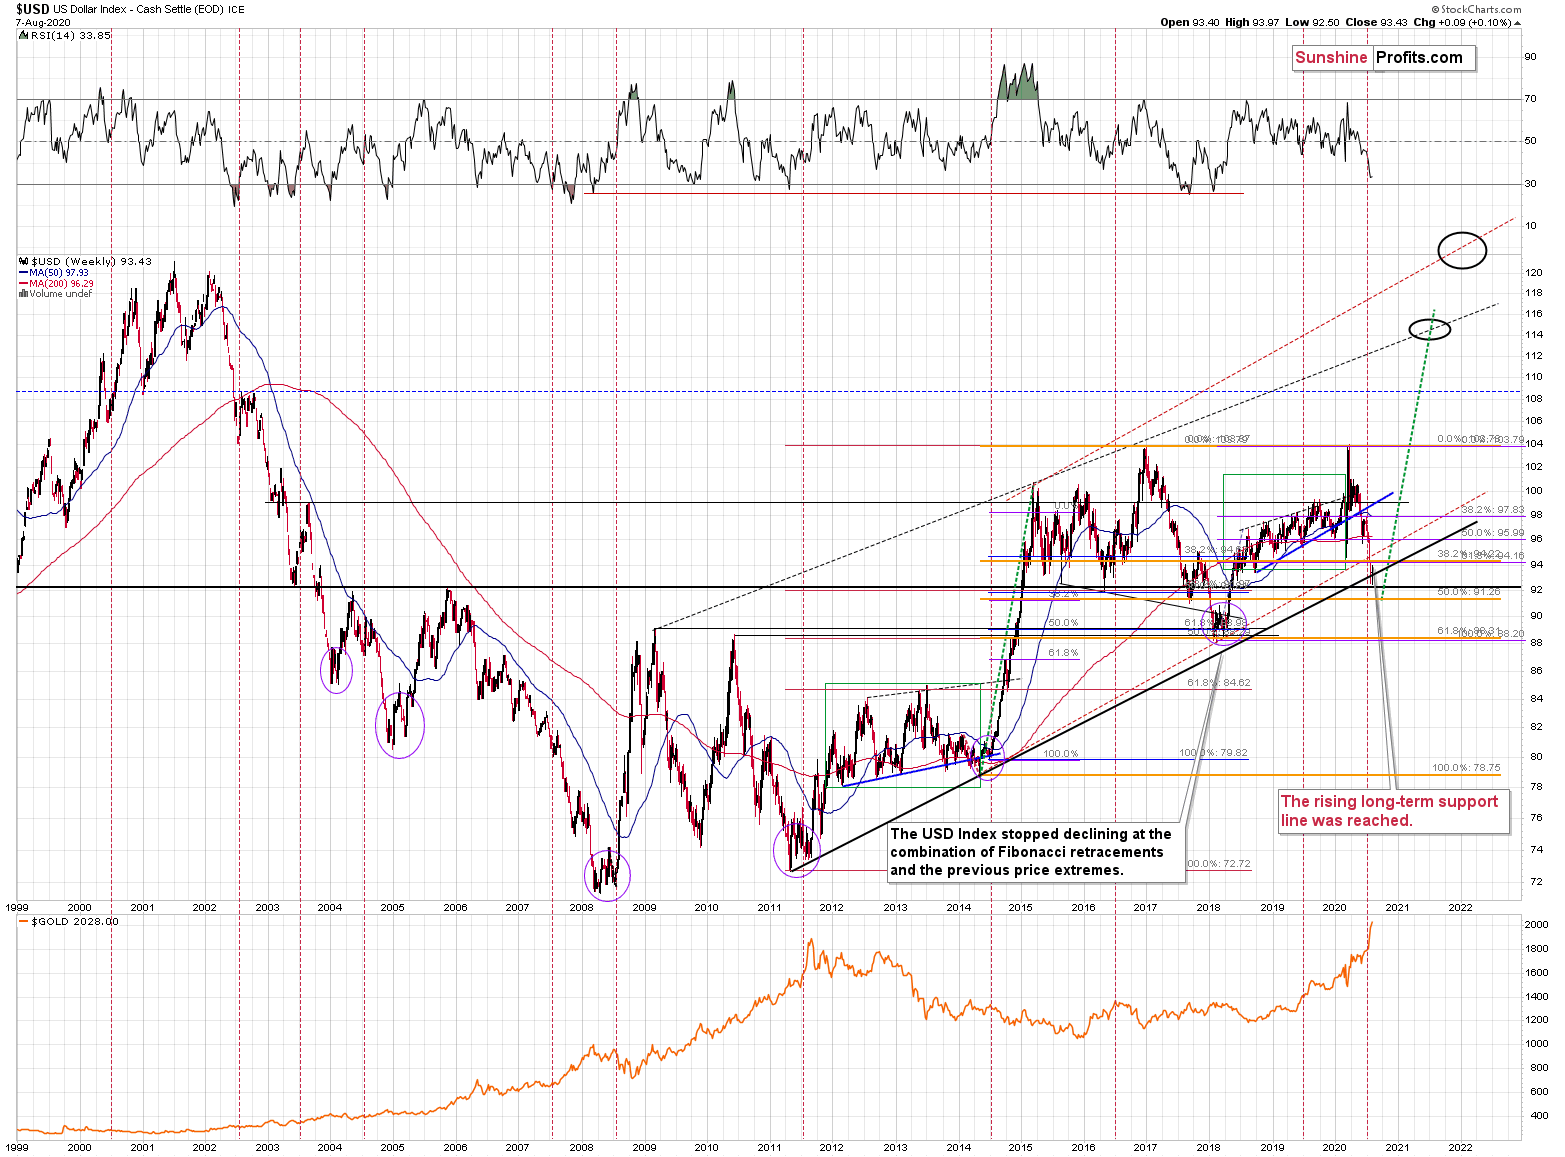
The USD Index is at a powerful combination of support levels. One of them is the rising, long-term, black support line that's based on the 2011 and 2014 bottoms.
The other major, long-term factor is the proximity to the 92 level - that's when gold topped in 2004, 2005, and where it - approximately - bottomed in 2015, and 2016.
The USDX just moved to these profound support levels, and it's very oversold on a short-term basis. It all happened in the middle of the year, which is when the USDX formed major bottoms on many occasions. This makes a short-term rally here very likely.
While it might not be visible at the first sight (you can click on the chart to enlarge it), the USD Index moved briefly below the long-term, black support line and then it invalidated this breakdown before the end of the week. This is a very bullish indication for the next few weeks.
We even saw a confirmation from USD's short-term chart.
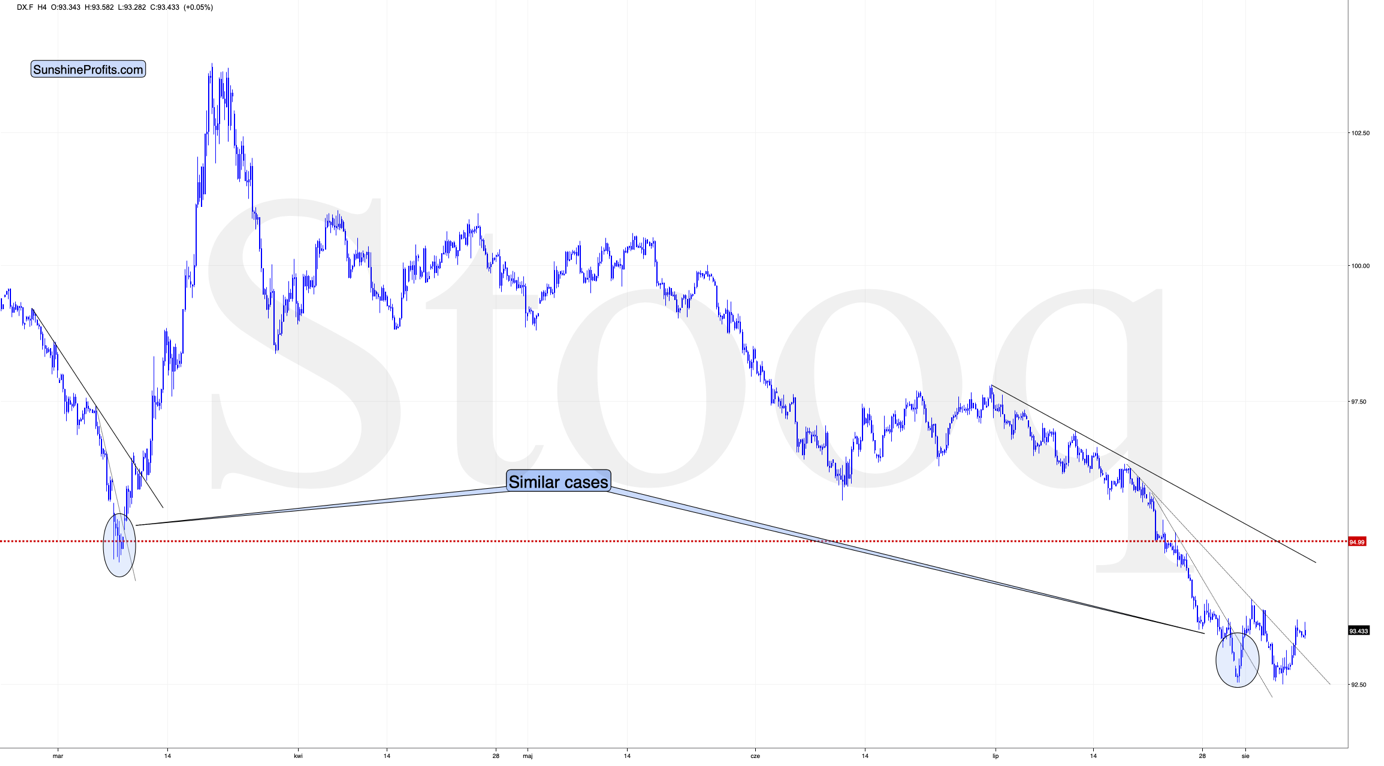
The U.S. currency is finally after a decisive short-term breakout. In fact, it's already after two short-term breakouts. Looking at the short-term picture only, the USD's sideways trading could be both: a double-bottom pattern, or a flag consolidation pattern. The former would be bullish, and the latter would be bearish. Based on the previous long-term chart, the bullish interpretation is stronger.
Back in March, the short-term breakout in the USD Index was the thing that triggered the powerful rally in it, as well as a powerful plunge in the precious metals market. It's generally a good gold trading tip to monitor the USD Index's performance.
Consequently, based on this analogy, the implications for the near term are bearish for the PMs. Especially, when we consider the fact that Gold Miners Bullish Percent Index showed the highest possible overbought reading recently.
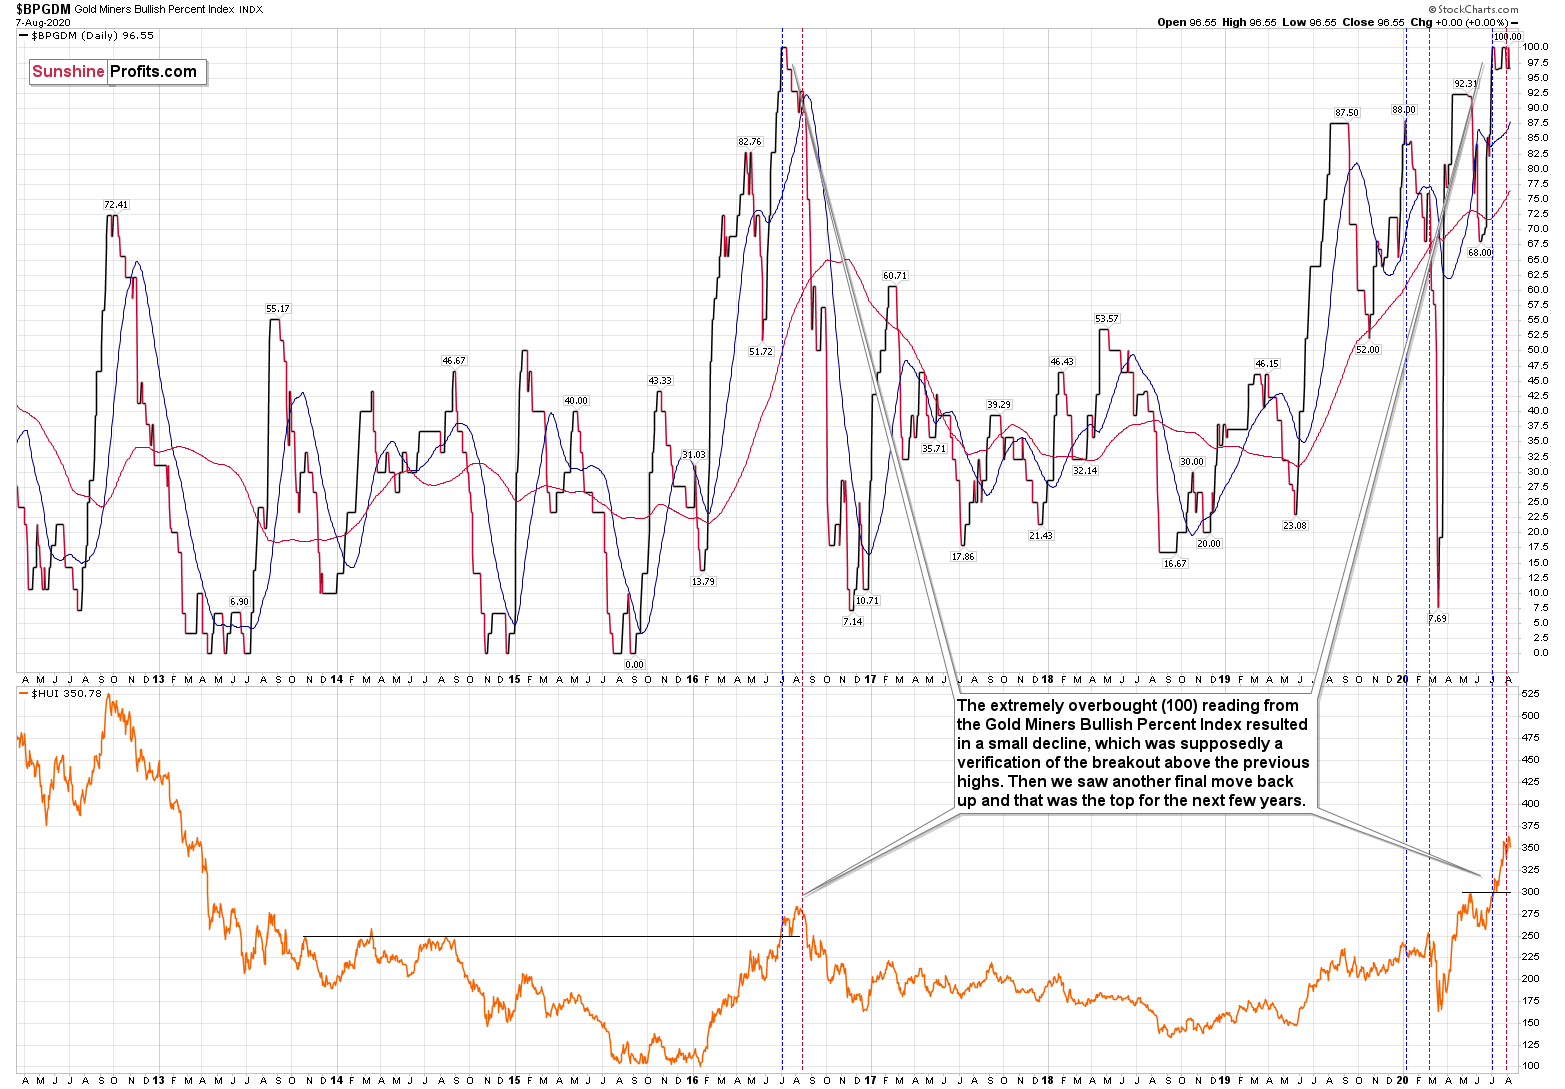
The excessive bullishness was present at the 2016 top as well and it didn't cause the situation to be any less bearish in reality. All markets periodically get ahead of themselves regardless of how bullish the long-term outlook really is. Then, they correct. If the upswing was significant, the correction is also quite often significant.
Please note that back in 2016, there was an additional quick upswing before the slide and this additional upswing has caused the Gold Miners Bullish Percent Index to move up once again for a few days. It then declined once again. We saw something similar also this time. In this case, this move up took the index once again to the 100 level, while in 2016 this wasn't the case. But still, the similarity remains present.
Back in 2016, when we saw this phenomenon, it was already after the top, and right before the big decline. Given the situation in the USD Index, it seems that we're seeing the same thing also this time.
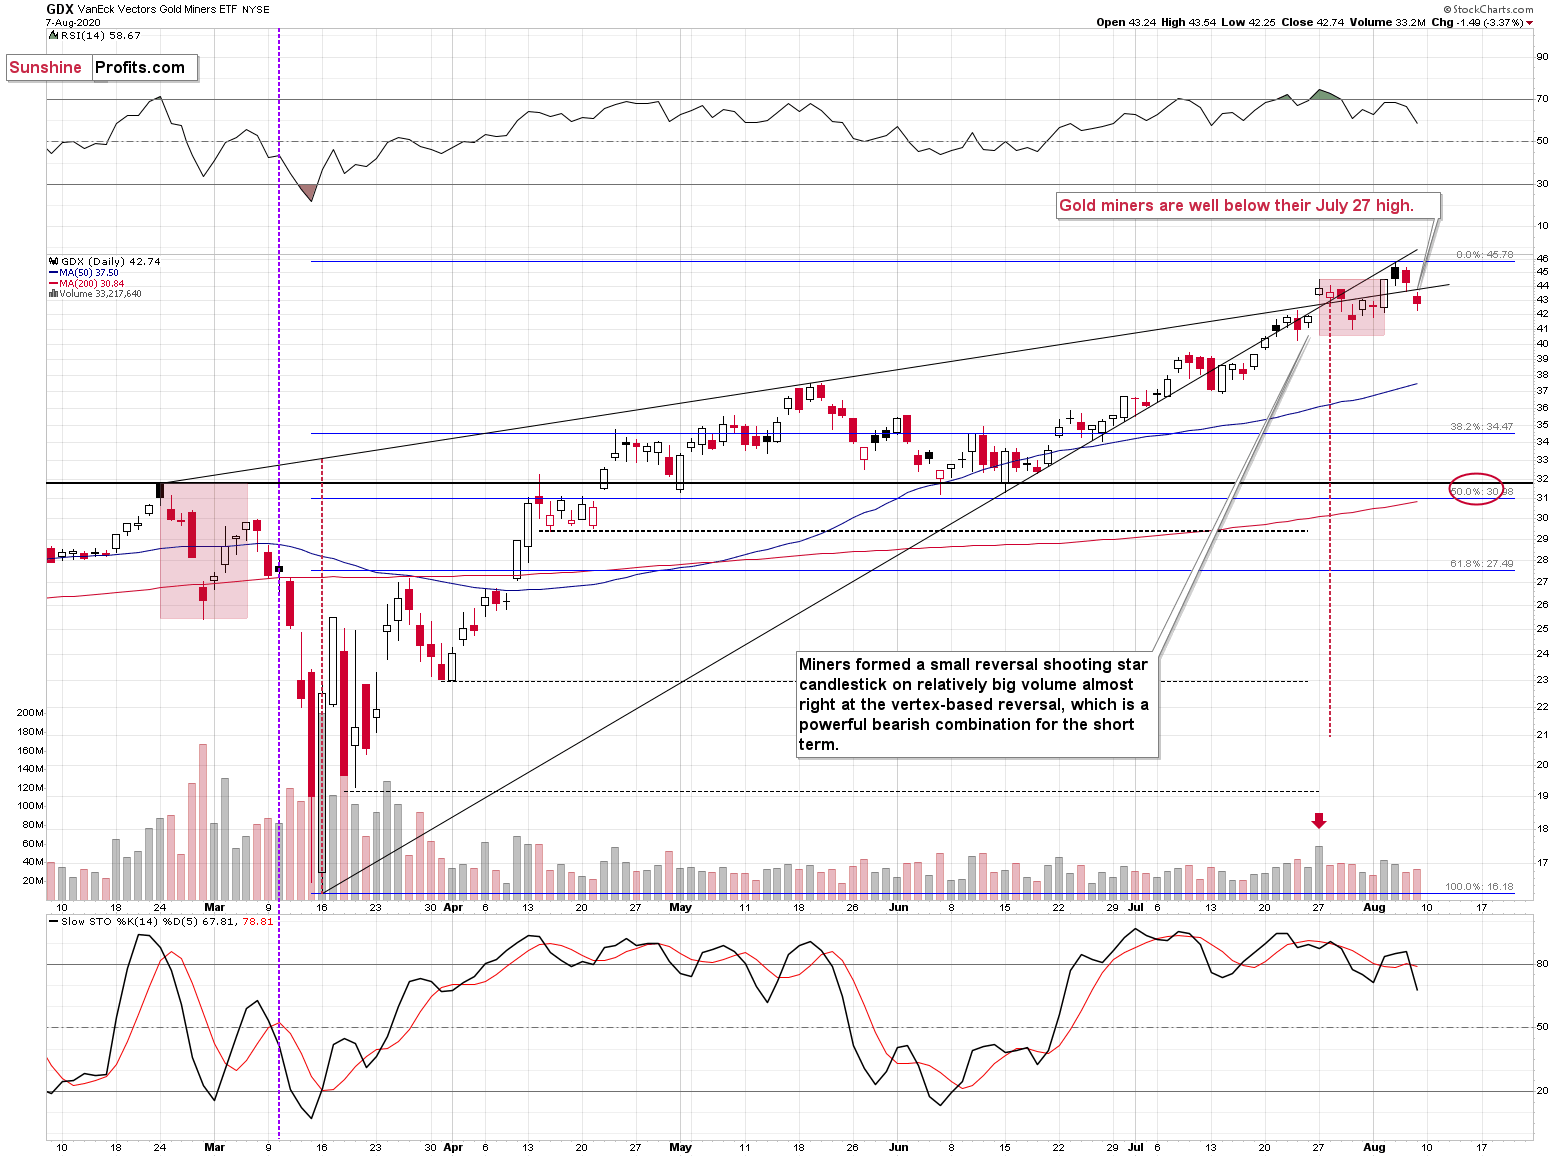
On Friday, gold stocks declined significantly, and they moved visibly below their July 27 high, even though gold ended its Friday's session almost $100 higher. Mining stocks' underperformance is quite extreme, especially that it's connected with silver's very strong short-term performance. This is what we usually see when the precious metals market is topping.
Please note that the miners topped almost right at the vertex of the huge rising wedge pattern. Quoting our previous analysis:
(...) huge rising wedge pattern is about to form a vertex today or tomorrow. The same rule that applies to triangles has implications also here. The vertex is quite likely to mark a reversal date. Given the overbought status of the RSI (given today's upswing, it's almost certain to move above 70 once again) as well as miners recent unwillingness to track gold during its continuous rally, it's highly likely in my view that this will be a top.
The downside target for the mining stocks is very far from the current price. However, if the stock market declines significantly once again, miners can indeed fall far, even if gold declines by "only" a couple of hundreds of dollars.
We marked also an interim price target that's based on a few other techniques, with a red ellipse - at about $31 - $32. One of the techniques is the 50% Fibonacci retracement level based on the March - August rally, and the other two are the February high, and the May and June lows. That's also where - approximately - we have the 200-day moving average. The latter is not particularly strong in case of the GDX ETF, so we wouldn't say that it creates any significant support on its own, but it serves as a good confirmation of the other techniques.
Let's turn to metals themselves.
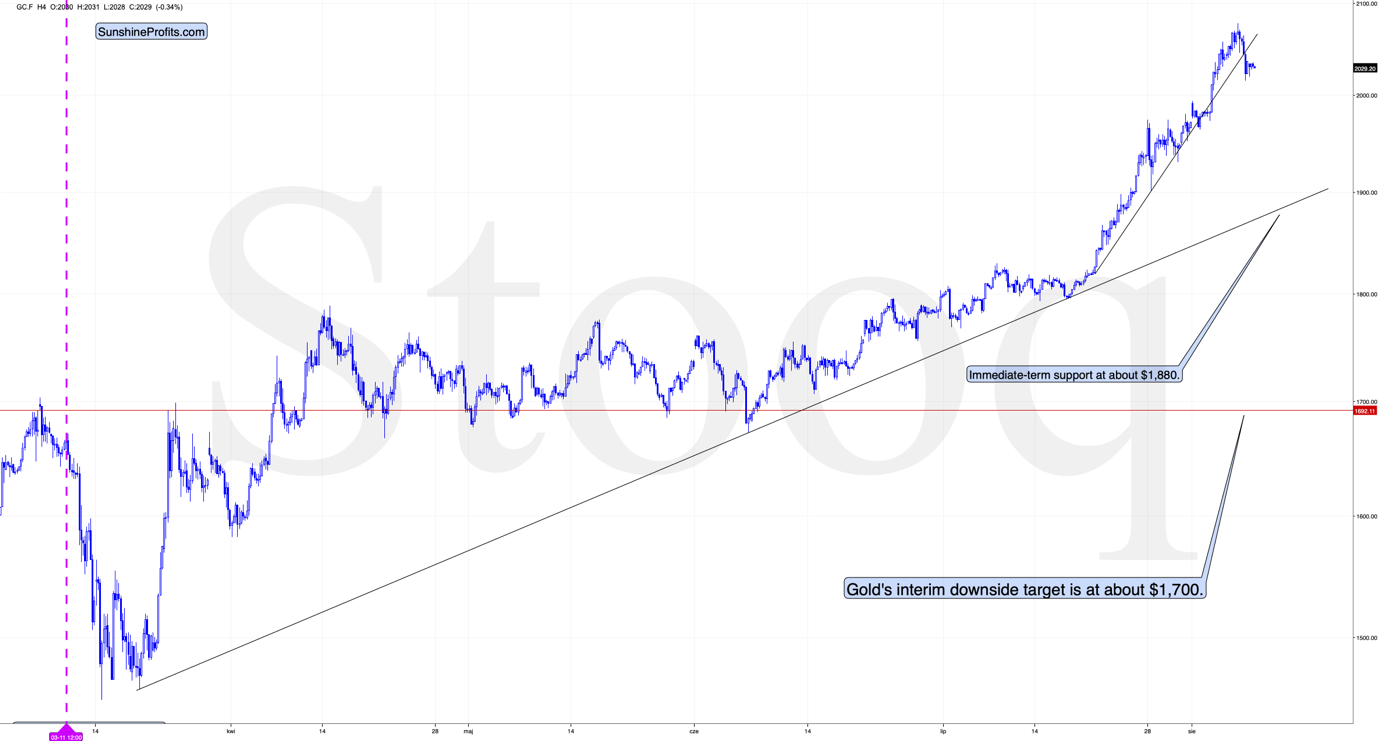
From the short-term point of view, we see that gold finally moved below its rising short-term support line and then it paused a bit. At this time, we can't rule out another temporary upswing close to the previous highs, where gold could verify the breakdown by moving once again to the rising line that was broken.
Based on the likely double-bottom in the USD Index, it seems that a smaller rally is more likely - similar to the one that we saw in early March shortly after the top and also right before the plunge. Please note that we saw something similar - a small upswing - also after the April top.
The interim downside target is the rising support line, which is at about $1,880 right now, but before gold reaches it, it's likely to be closer to $1,900.
The next support is at $1,700, which is where - approximately - gold topped and bottomed multiple times earlier this year.
The $1,700 level is additionally confirmed by the 61.8% Fibonacci retracement based on the entire 2015 - 2020 rally.
There's also possibility that gold would decline to the $1,500 - $1,600 area or so (50% Fibonacci retracement and the price level to which gold declined initially in 2011), but based on the size of the recent upswing, we no longer think that this scenario is the most likely one.
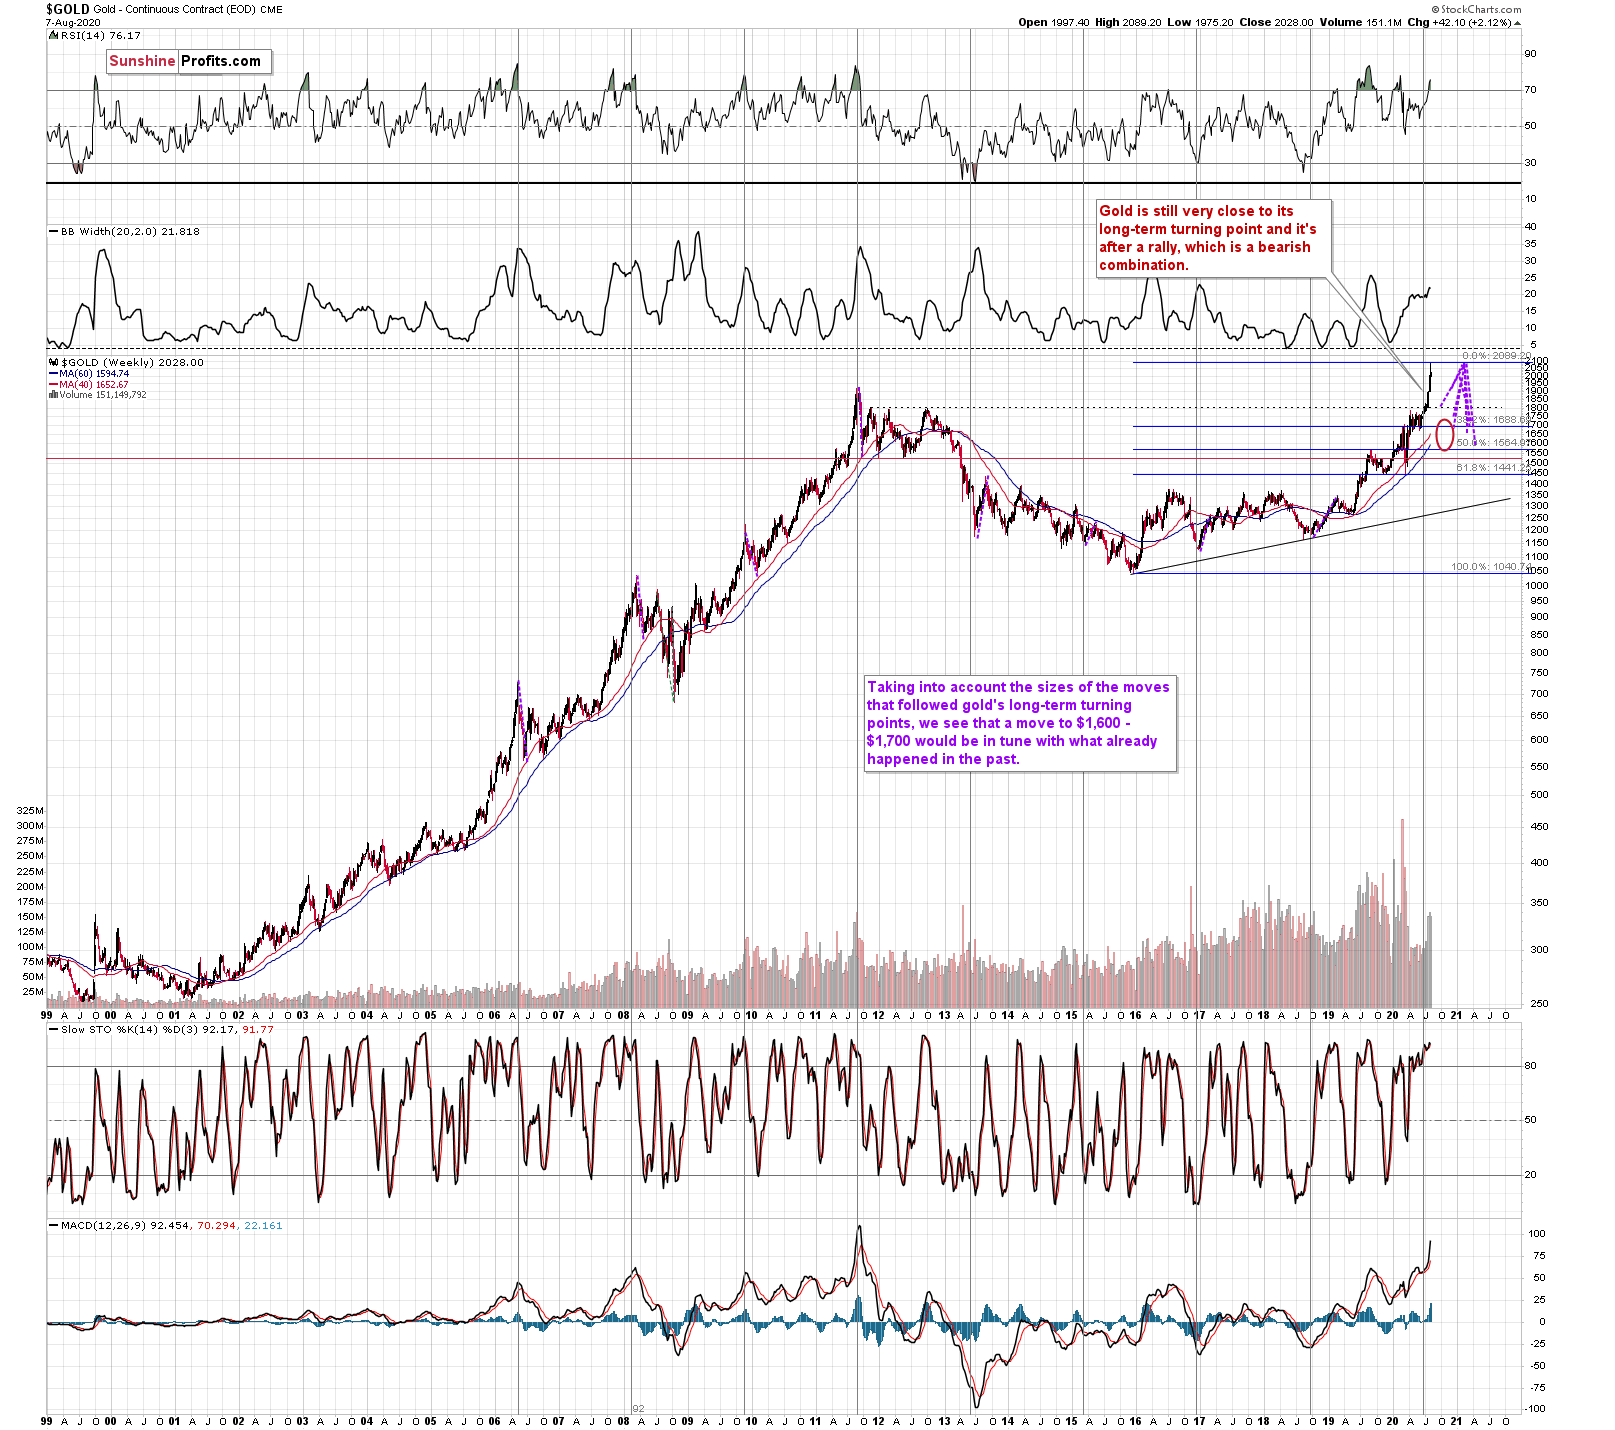
Gold's very long-term turning point is here and since the most recent move has definitely been to the upside, its implications are bearish.
We used the purple lines to mark the previous price moves that followed gold's long-term turning points, and we copied them to the current situation. We copied both the rallies and declines, which is why it seems that some moves would suggest that gold moves back in time - the point is to show how important the turning point is in general.
The big change here is that due to gold's big rally, we moved our downside target for it higher. Based on the information that we have available right now, it seems likely that gold will bottom close to the $1,700 level. That's very much in tune with how much gold moved after the previous long-term turning points.
Also, while we're discussing the long-term charts, please note the most important detail that you can see on the gold, silver, and mining stock charts, is hidden in plain sight. Please note how much silver and miners rallied.
The analogy to the price moves after the previous turning points didn't change, but since the starting point is much higher, the downside target is also higher.
Speaking of upside targets, last week we wrote the following:
Based on gold's Fibonacci extensions and the previous major highs and lows (the 2018 high and late-2019 low along with the 2020 low), we get a nearby upside target of $2085. At the moment of writing these words, gold is trading at $2044. Given this week's volatility, it could even be a matter of hours before gold reaches the above-mentioned target and reverses. Taking closing prices into account, gold is up by $35, so if it reverses significantly, we would be likely to see a powerful weekly reversal candlestick and one that causes gold to decline in the following weeks.
That's more or less what happened. Gold didn't erase the entire weekly gain, but most thereof. Gold topped at $2,089.20.
And what about silver?
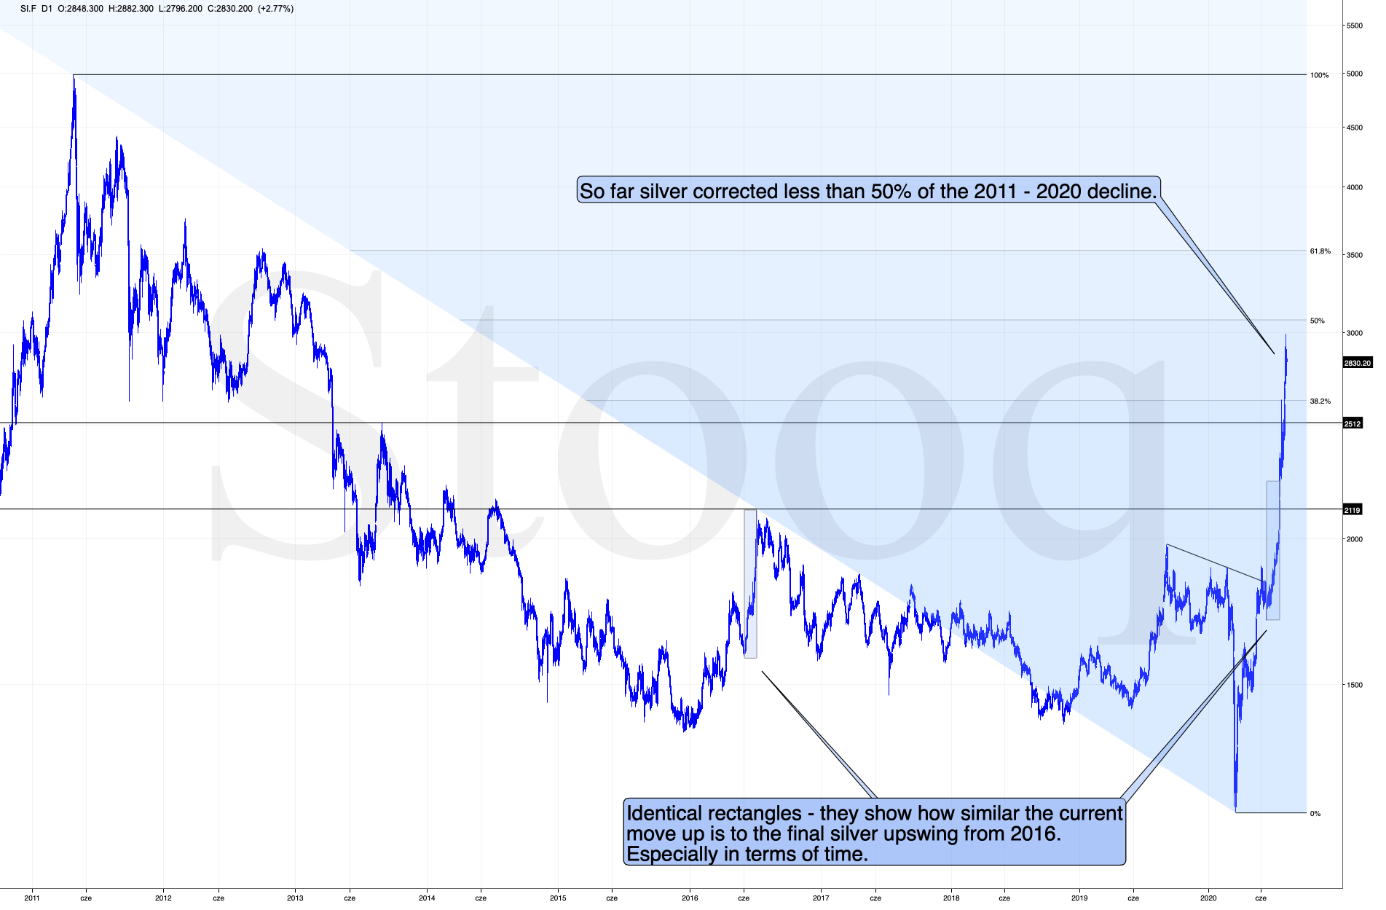
While gold moved to new highs, silver - despite its powerful short-term upswing - didn't manage to correct more than half of its 2011 - 2020 decline.
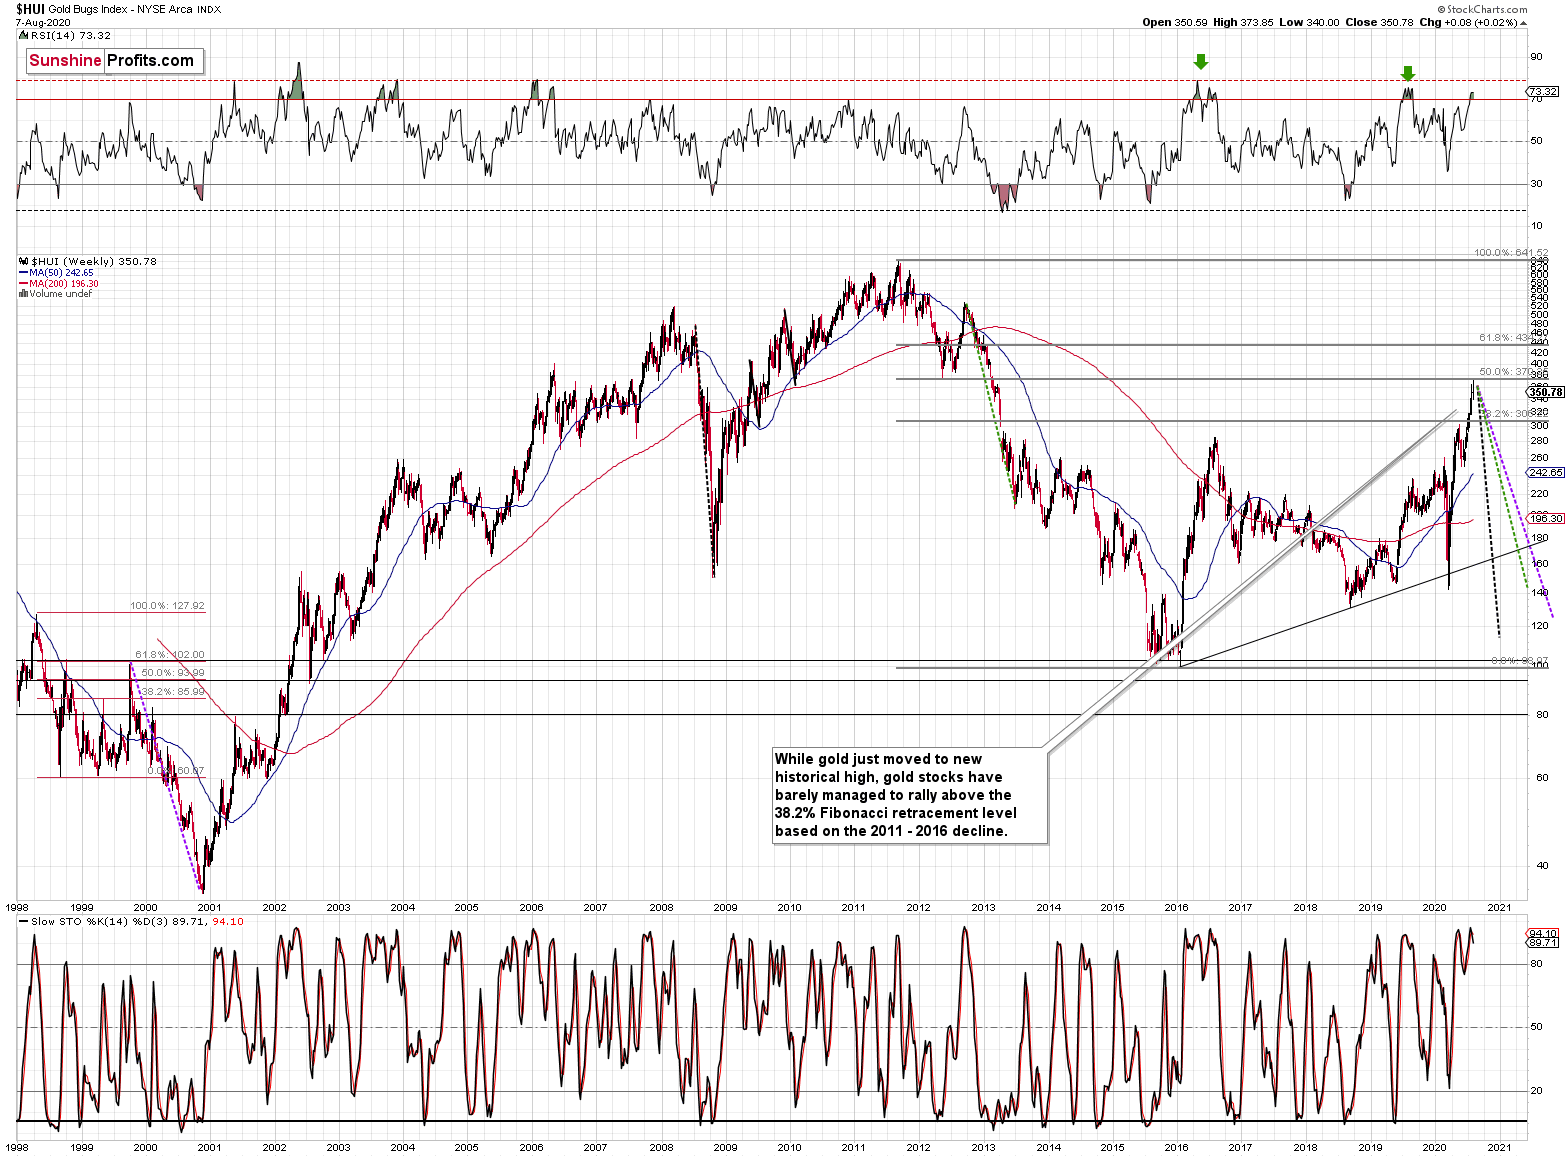
We see something similar in the HUI Index. The latter corrected half of its 2011 - 2016 decline and nothing more.
Last week, gold was up by over $40 and gold stocks were just 0.02% higher, which is another way of saying that they were basically flat. We already wrote about miners' excessive underperformance, but the above is another confirmation of it.
All in all, it's mostly gold that is making the major gains - not the entire precious metals sector.
Moving back to silver's forecast, it's good to note that the time the current rally is taking, is still very similar to the time that the final part of the 2016 run-up took. The current move is bigger, but in terms of time, they are still very alike. This adds to the bearish implications of the situation in the USD Index and gold miners' extremely overbought condition.
Overview of the Upcoming Decline
As far as the current overview of the upcoming decline is concerned, I think that after bottoming temporarily at about $1,900, gold, silver and miners will bounce back - perhaps $30-$50 or so in gold, and then we will probably see another move lower, with silver declining more than miners. That would be in tune with how the markets initially reacted to the Covid-19 threat and how they performed after the previous long-term turning points.
At this time, it seems that after the initial decline to $1,900, gold could correct and then decline to about $1,700 and that would be the final bottom - one that would hold for years, perhaps decades.
Still, it's possible that the $1,900 bottom in gold would be the final bottom.
How will we tell, which scenario is more likely - a decline visibly below $1,900 or just to it? Based on the way different parts of the precious metals sector react to the decline and to the initial rebound. If silver catches up with the decline when gold moves to $1,900, but miners lead on the way back up (strongly so), it will be more likely that the bullish scenario prevails. If we see the opposite - miners are weak during the rebound and silver doesn't catch up with the decline once gold approaches $1,900, the bearish case will prevail. Anything in between will require additional confirmations and we will keep you - our subscribers - updated in any case.
The impact of all the new rounds of money printing in the U.S. and Europe on the precious metals prices is very positive in the long run, but it doesn't make the short-term decline unlikely. In the very near term, markets can and do get ahead of themselves and then need to decline - sometimes very profoundly - before continuing their upward march.
Summary
Summing up, it seems that after reversing $4 above our upside target, gold has finally topped. The opposite appears likely in store for the USD Index, which seems to have formed a double-bottom pattern. The extremely overbought reading from the Gold Miners Bullish Percent Index and the individual price moves make the current case very similar to the 2016 topping pattern, and other important indications (especially gold's and USD's long-term cycles) point to likely - sizable - decline in the following several weeks.
Naturally, everyone's trading is their responsibility, but in our opinion, if there ever was a time to either enter a short position in the miners or to increase its size if it wasn't already sizable, it's now. We made money on the March decline and on the March rebound, and it seems that another massive slide is about to start. When everyone is on one side of the boat, it's a good idea to be on the other side, and the Gold Miners Bullish Percent Index literally indicates that this is the case with mining stocks.
After the sell-off (that takes gold to about $1,700), we expect the precious metals to rally significantly. The final decline might take as little as 1-6 weeks, so it's important to stay alert to any changes.
Most importantly - stay healthy and safe. We made a lot of money on the March decline and the subsequent rebound (its initial part) price moves (and we'll likely make much more in the following weeks and months), but you have to be healthy to really enjoy the results.
As always, we'll keep you - our subscribers - informed.
To summarize:
Short-term outlook for the precious metals sector (our opinion on the next 1-6 weeks): Bearish
Medium-term outlook for the precious metals sector (our opinion for the period between 1.5 and 6 months): Bullish
Long-term outlook for the precious metals sector (our opinion for the period between 6 and 24 months from now): Bullish
Very long-term outlook for the precious metals sector (our opinion for the period starting 2 years from now): Bullish
Our preferred ways to invest in and to trade gold along with the reasoning can be found in the how to buy gold section. Additionally, our preferred ETFs and ETNs can be found in our Gold & Silver ETF Ranking.
As a reminder, Gold Investment Updates are posted approximately once per week. We are usually posting them on Monday, but we can't promise that it will be the case each week.
Please note that this service does not include daily or intraday follow-ups. If you'd like to receive them, we encourage you to subscribe to our Gold & Silver Trading Alerts today.
Thank you.
Sincerely,
Przemyslaw Radomski, CFA
Editor-in-chief, Gold & Silver Fund Manager

