Even though mining stocks closed last week below the Jan. 2 close and silver even declined below the Dec 31, 2017 close, gold moved higher. It’s not far from this year’s top either. So, is all well and are bullish gold price forecasts justified? Not necessarily. In today’s article, we show you two reasons why it’s a good idea to think twice before opening long positions in gold.
Some time ago we discussed the apex technique for the HUI Index and it worked perfectly, triggering a reversal right at the apex of the triangle. Today, we can see something very similar on the long-term GDX ETF chart and in light of the mentioned performance, it shouldn’t be ignored. Let’s take a look at the details (charts courtesy of http://stockcharts.com).
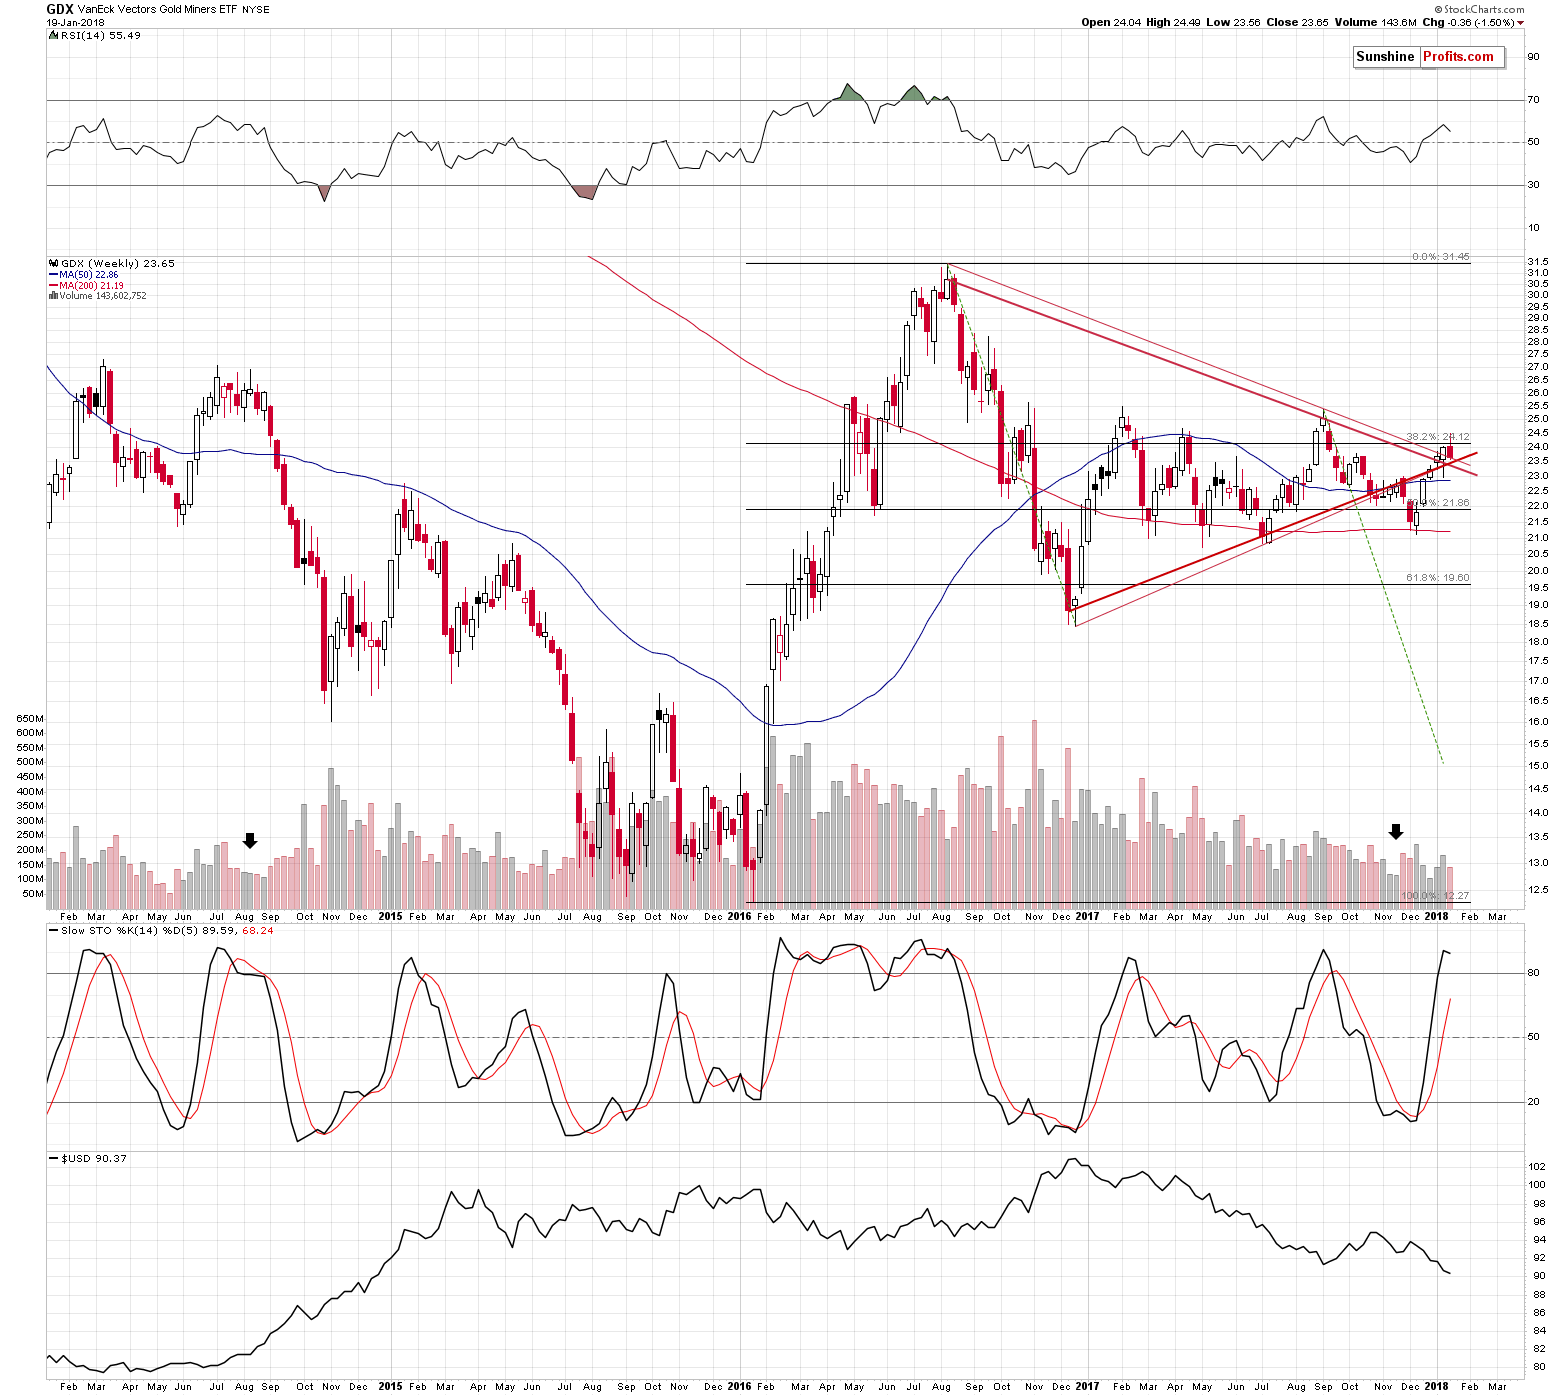
If you’re not familiar with the apex reversal technique, here’s a quick intro. Whenever we have a visible triangle pattern, the moment when the lines creating the triangle cross marks the likely time target for a turnaround. This is a method for detecting reversals, but it doesn’t say anything about the price, at which the reversal is likely. This technique doesn’t work for all markets, but - fortunately for us – it’s quite efficient in the case of the precious metals market.
The triangle pattern is clearly visible as it’s based on the very important 2016 and 2017 price extremes. We created two triangles, one based on the closing prices and the other based on the intraday extremes. Based on the former, the reversal was likely to be seen last week or the week prior to it, and based on the latter, the reversal was likely to be seen last week or this week. The common denominator is the last week, and – unsurprisingly – mining stocks reversed precisely at the moment.
The implications of the turnaround in mining stocks is clearly bearish as the preceding move was up.
What about the gold price itself?
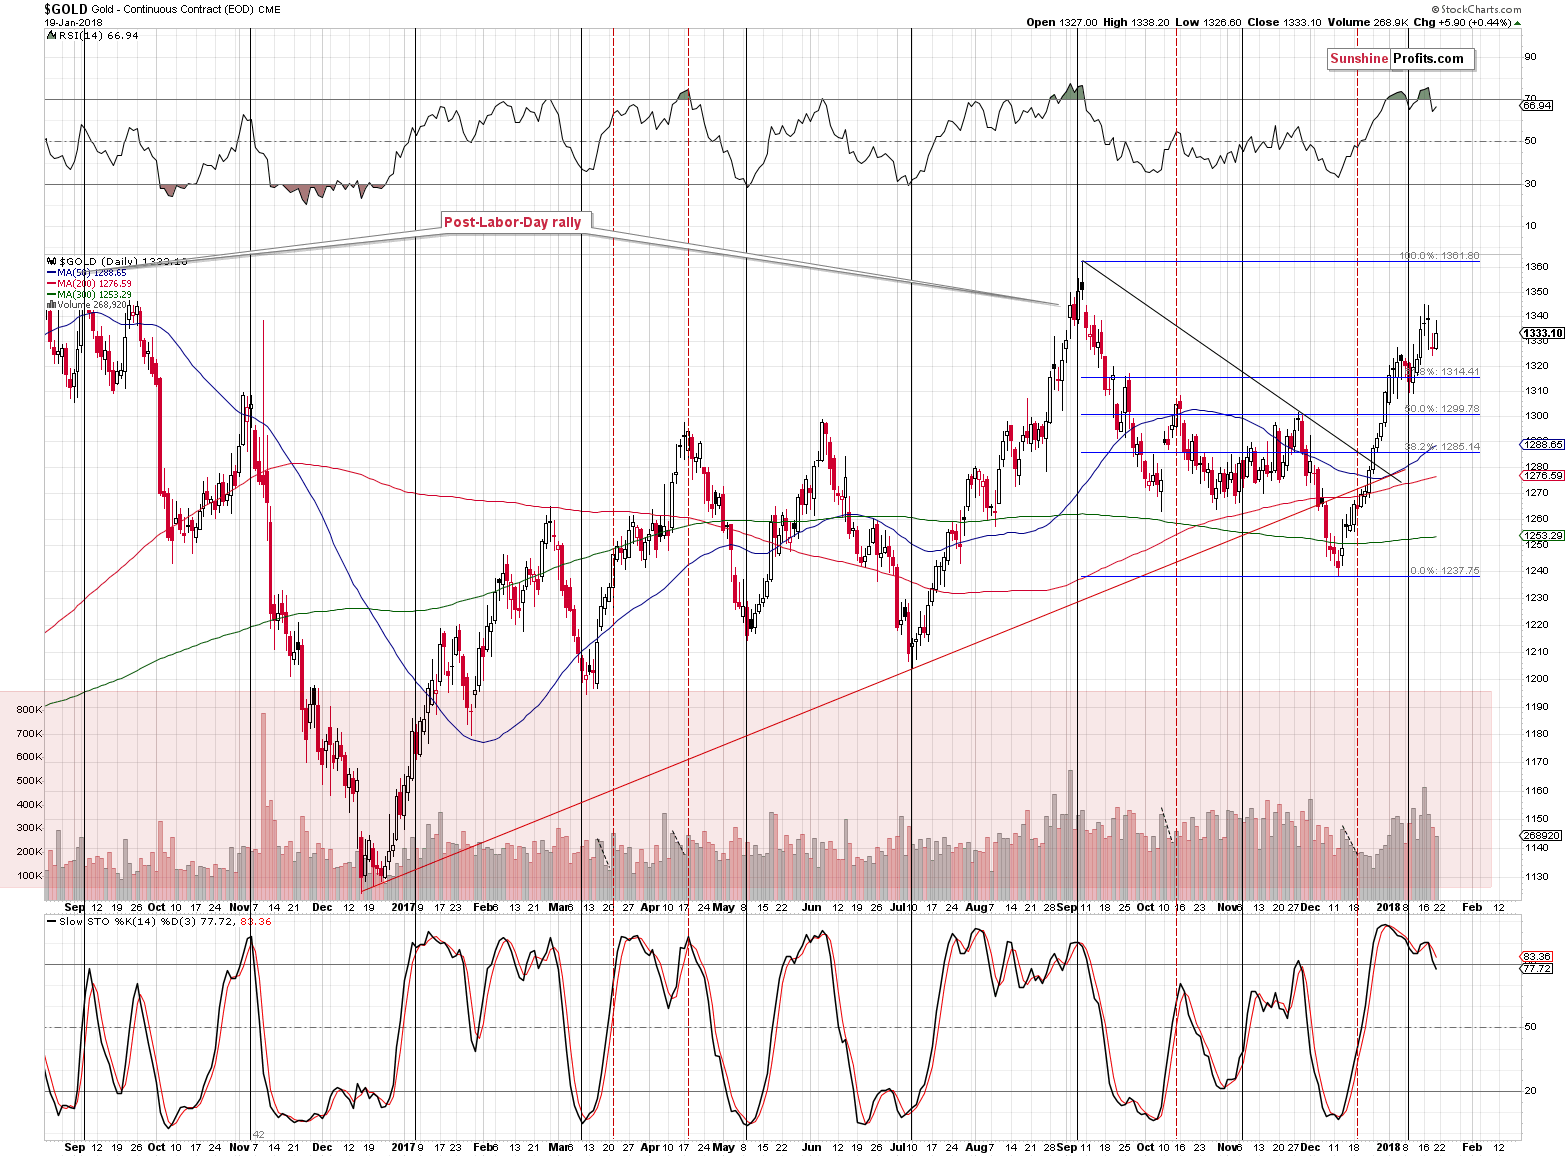
On Friday, the yellow metal moved a few dollars higher on relatively low volume (lowest in a week). The sell signals from the RSI and Stochastic remain in place. However, the overall picture is much more bearish than it may seem based on these three signals alone.
One of the very important additional factors is gold’s strength relative to the USD Index. To be more precise – the lack thereof.
The USD Index declined by 0.36 last week. What did gold do in light of the above? How much it rallied? Not at all. Gold moved $1.80 lower (and GLD was down by $0.54, so gold futures’ price data is not accidental or a data error). While we’re at it – silver declined by 11 cents. Gold stocks (HUI) were down by 4.41, while silver stocks (SIL) were down by $0.68 (over 2%). By the way, the S&P 500 was up almost 1%, so silver and miners had another reason to rally.
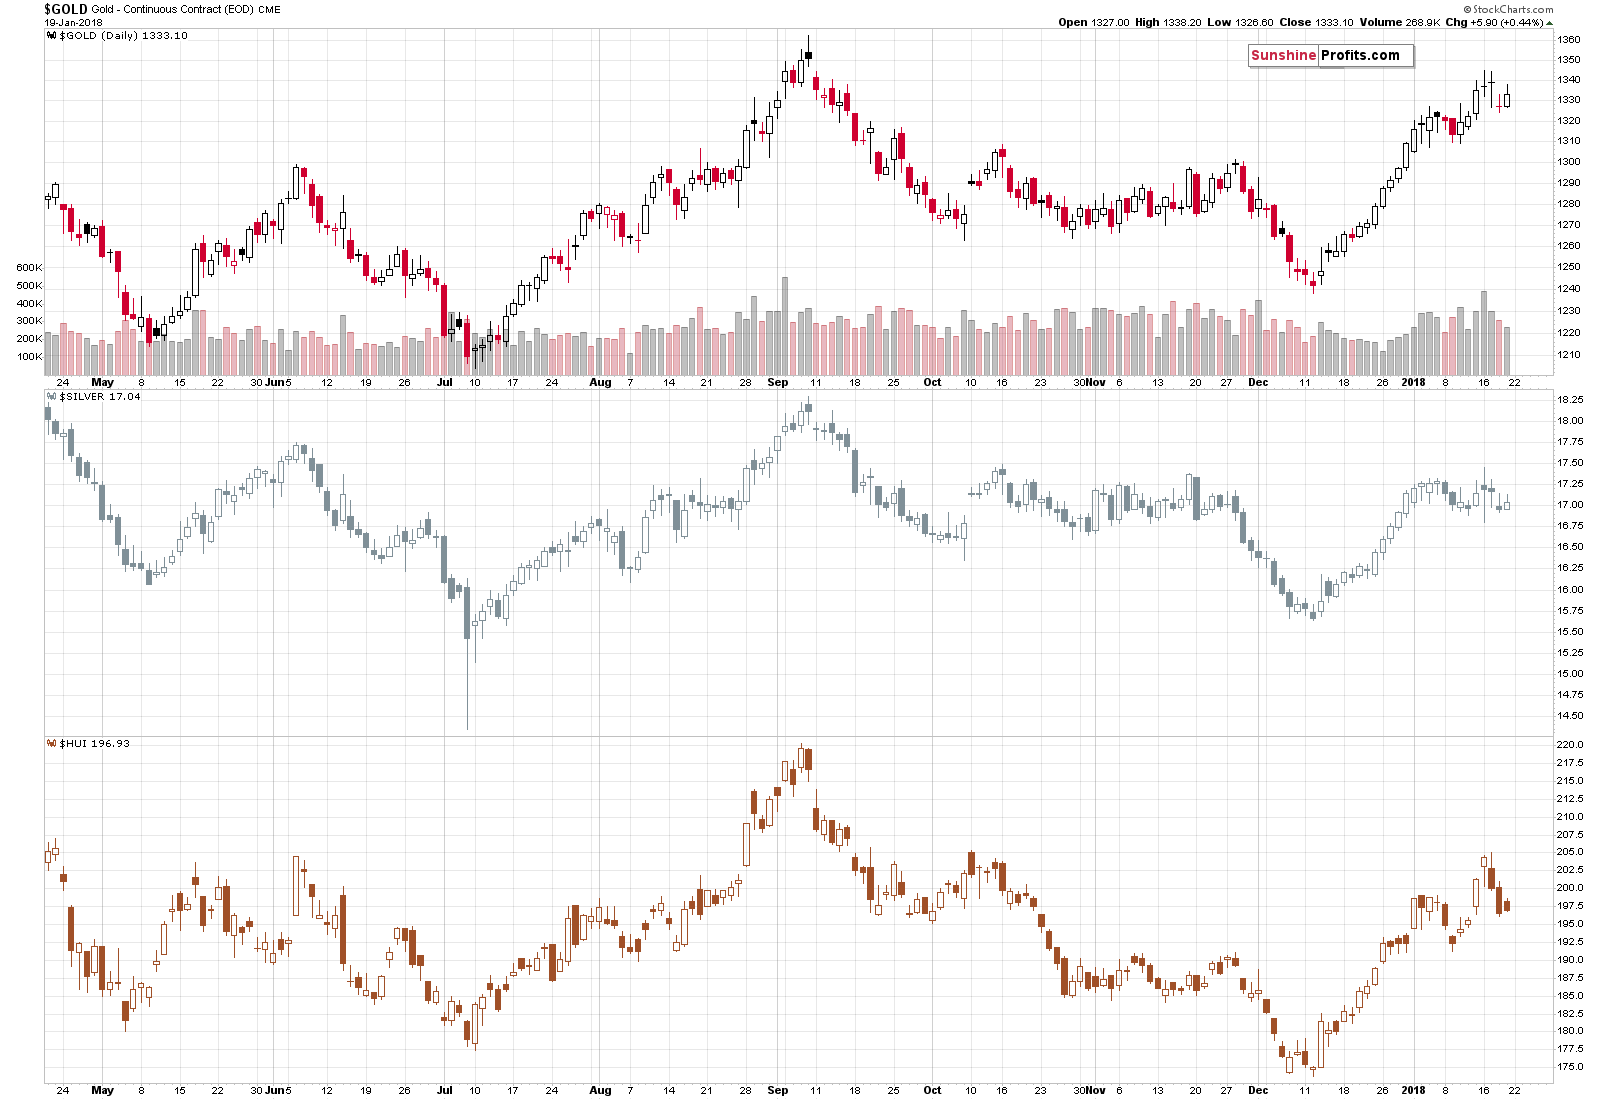
A refusal to rally, when a given market should move higher is a clear sign of a top. In the case of the precious metals market we get an additional confirmation by looking at gold stocks’ performance relative to gold’s performance. A decline of over 4 index points in light of less than a $2 decline in gold is definitely as sign of underperformance of the former. Another bearish confirmation.
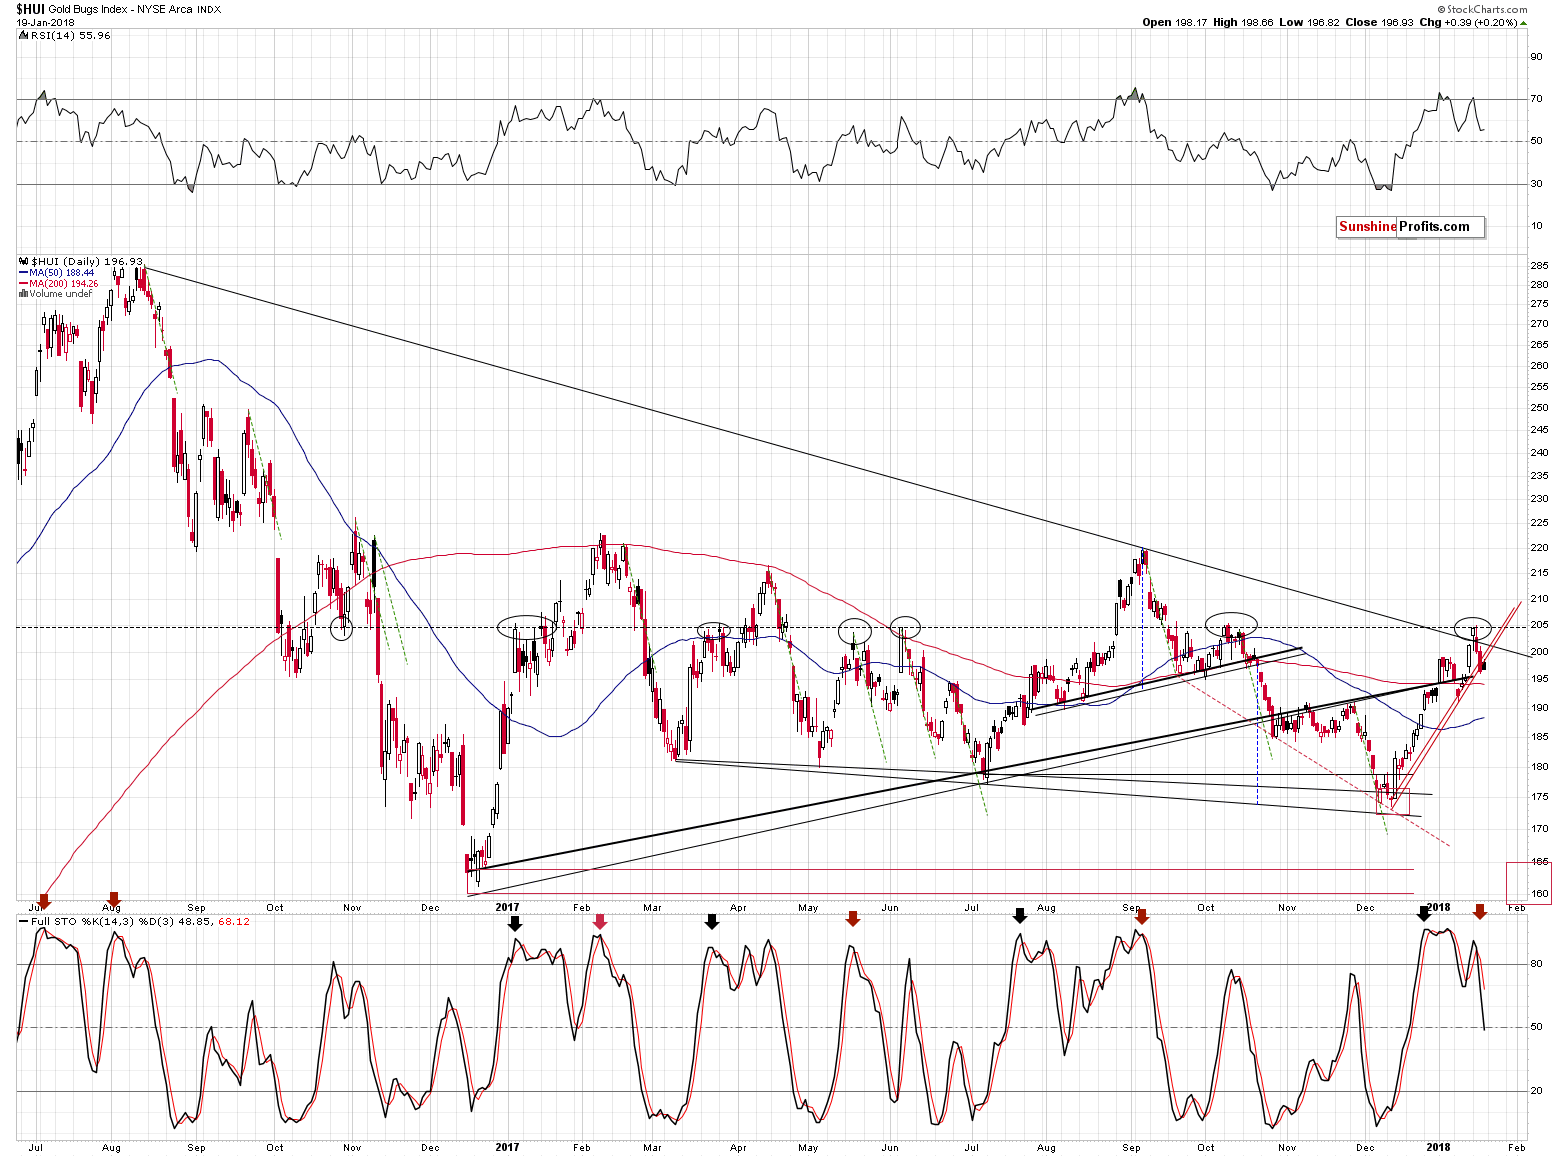
Gold stocks themselves (HUI Index) are after an invalidation of a medium-term breakout, and a breakdown below the very short-term rising support line. No matter if you base the latter on the intraday lows or the closing prices, the breakdown just took place. The latter is not confirmed, but if we consider the fact that gold actually moved a bit higher on Friday, we see that miners broke lower even while they had good reason not to. That’s a bearish indication.
The sell signal from the Stochastic indicator suggests lower prices as well.
Let’s take a look at silver.
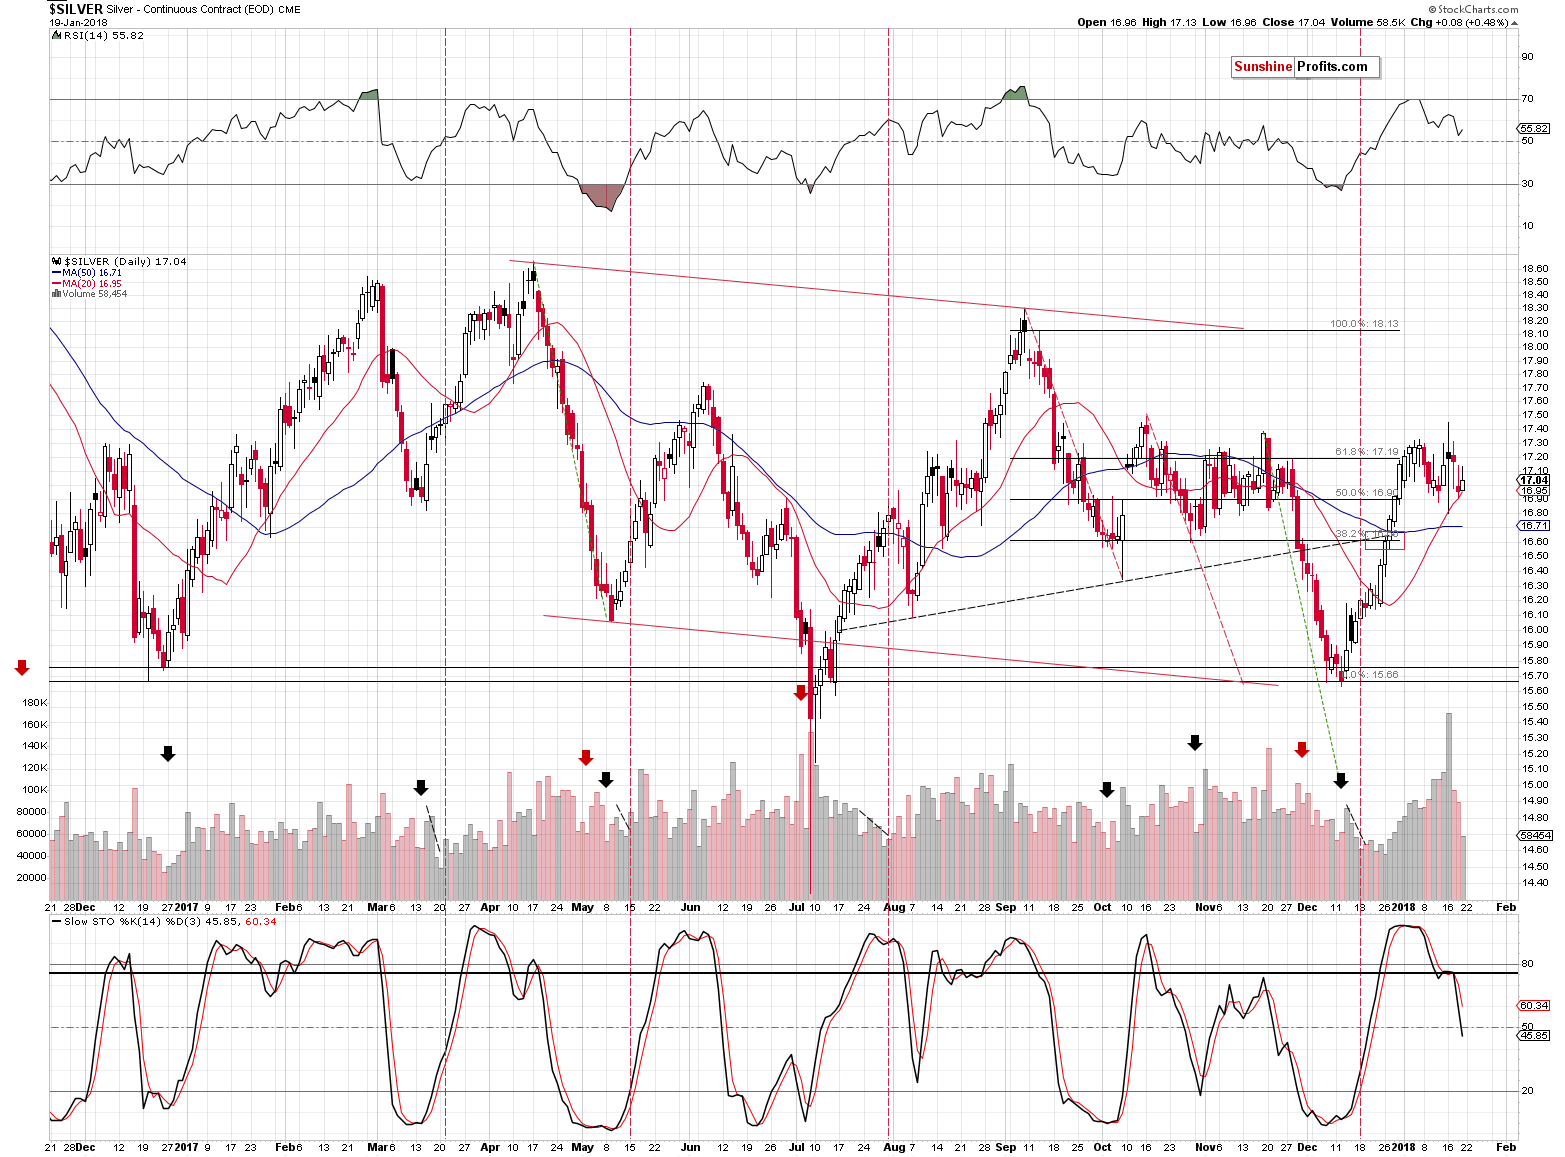
In Friday’s Gold & Silver Trading Alert, we wrote the following:
Silver closed yesterday’s session not only below the January 2nd close, but also below the December 31st, 2017 close. In other words, 2018 is a down year for silver, even considering the current price of $17.07.
This is particularly shocking given the very strong performance of the general stock market, with which silver is traditionally more correlated than gold. Silver simply does not want to move higher and this is based on more than just a day or two – this has been the case for weeks.
Silver closed the week below the Dec 31st 2017 close, further confirming that this is a down year for silver.
However, on Friday, silver moved higher and the interesting thing about this upswing was the volume that accompanied it. It was low, which is generally a bearish sign.
Speaking of silver’s volume, please keep in mind that the implications of the extremely big volume in the price of the white metal that we saw on Tuesday remain in place.
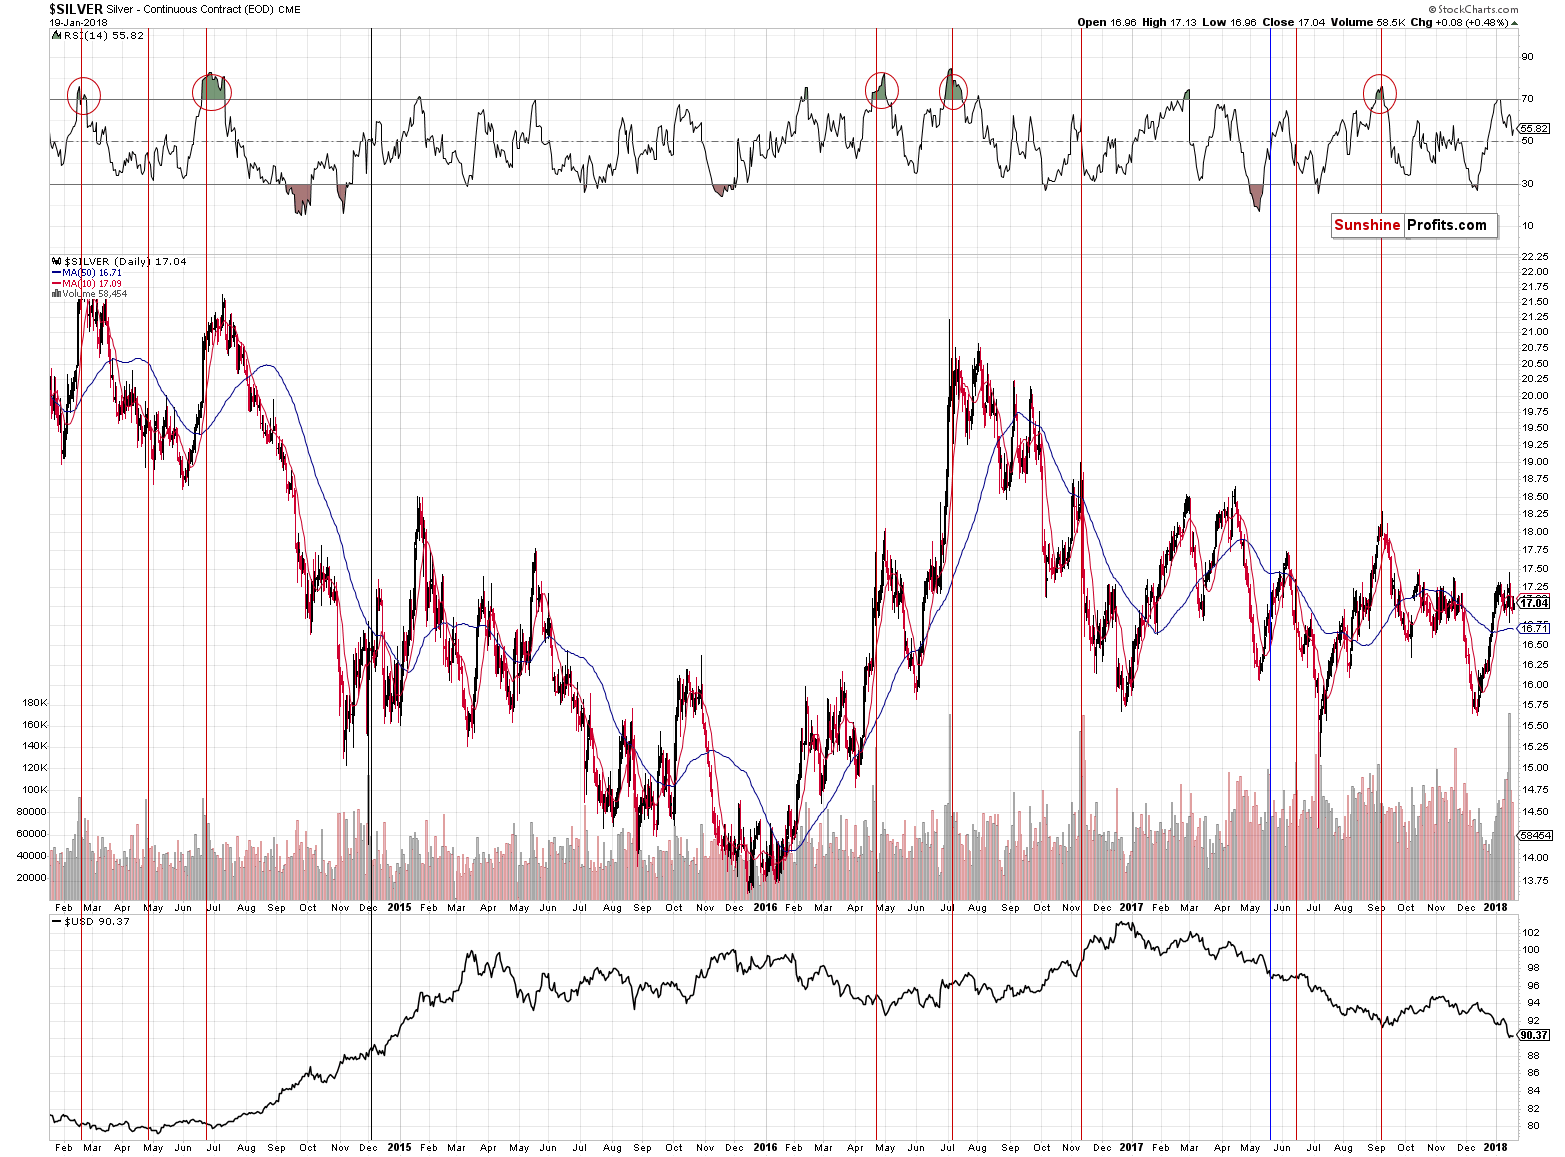
We described them in greater detail in on Wednesday:
The volume in silver was epic. One could say that it’s because there was no regular session on Monday, but during the previous years there were also other cases when there were market holidays and in no other case was the volume this big. In other words, the volume is extreme even if we take the above effect into account.
However, it is most important that the volume was extremely big – not that it broke a few records. History tends to repeat itself, so the key question is what silver did after previous sessions when it traded on huge volume.
It usually declined. We marked the similar sessions with vertical lines and we used the red color for the cases when a bigger decline followed either immediately or shortly. The black line represents the session that was not followed by anything specific and the blue session was followed by higher silver prices in the short term.
The red sessions dominate, which makes the current session bearish. However, what makes it very bearish is considering the above together with the RSI indicator. The latter shows the status of the market when the huge-volume upswing was seen.
Whenever silver moved higher on huge volume when the RSI was above 60, it meant that a top was in or at hand. We marked those situations with red ellipses. The RSI closed at 62 yesterday, which makes the current combination of signals very bearish.
Has silver topped based the extreme volume reading? It could be the case, but this is not what the above chart is saying. It’s saying that a big decline is just around the corner and paying a lot of attention to bullish signs might be misleading.
Knowing how silver performed for the rest of the previous week, it now seems that the top has indeed been formed. The white metal had all the reasons to rally and it didn’t, except for Friday’s tiny 8-cent upswing. Also, the sell signal from the Stochastic indicator remains in play.
Summing up, there are multiple signs pointing to lower precious metals prices in the coming weeks. Two of the most important ones for the short term are the relative price moves of gold stocks, gold and the USD Index, and the turnaround that’s likely already happened in mining stocks based on the apex technique. Gold above $1,300 may appear encouraging and bullish, but, in our opinion, long positions are not the best way to go at this moment.
 Details available to Subscribers only.
Click here to subscribe.

Naturally, the above is up-to-date at the moment of publishing it and the situation may – and is likely to – change in the future. If you’d like to receive follow-ups to the above analysis (including the intraday ones, when things get hot), we invite you to subscribe to our Gold & Silver Trading Alerts.
Thank you.
Sincerely,
Przemyslaw Radomski, CFA
Founder, Editor-in-chief, Gold & Silver Fund Manager
Gold & Silver Trading Alerts
Forex Trading Alerts
Oil Investment Updates
Oil Trading Alerts


