

The 2017 is almost gone. The last eleven months were not perhaps a spectacular time for gold, but it managed to rise more than 12 percent year-to-date, as one can see in the chart below.
Chart 1: Gold prices year-to-date (London P.M. Fix).
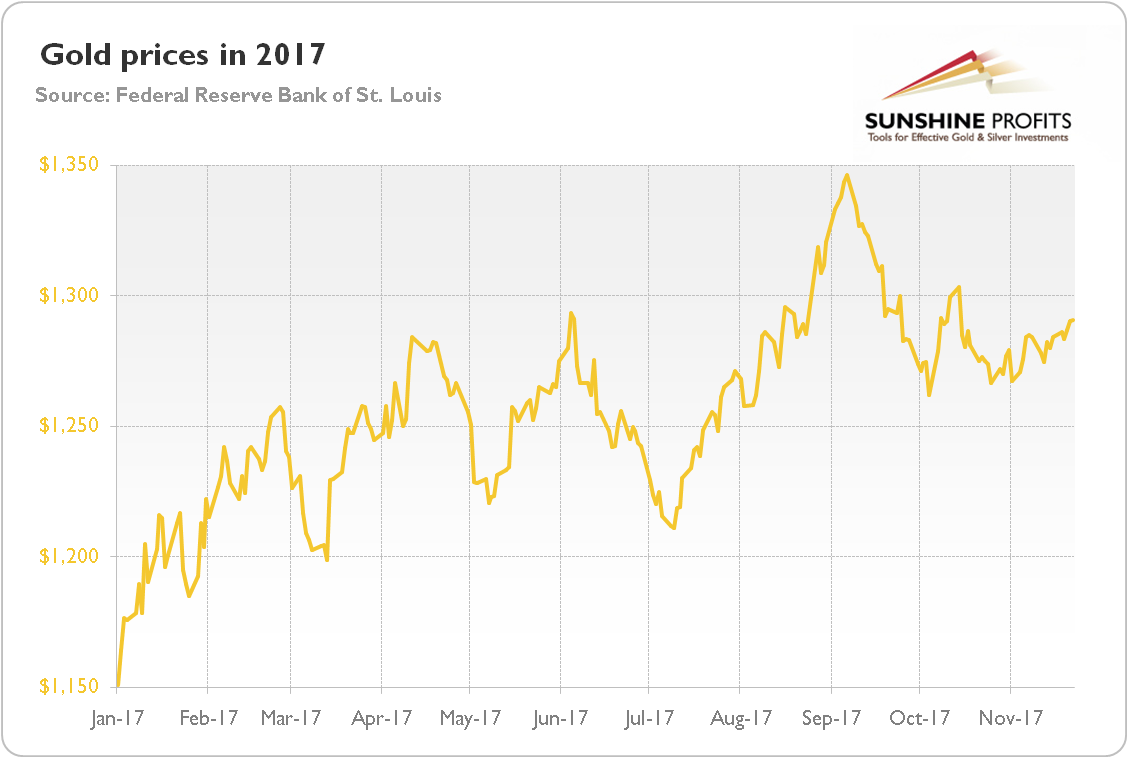
November was rather dull for the gold market – the price of the yellow metal increased more than 1 percent, but it remained within the recent tight range. Actually, gold prices have been stuck in one of the narrowest trading ranges for years. How will the golden vehicle finish the final lap of the year? Will it finally jump above $1,300 or will it bottom, just as 2015 and 2016?
To answer this question, let’s analyze the most important long-term fundamentals of gold. First, as the chart below shows, the U.S. dollar weakened in November due to the increased uncertainty about the prospects of tax reform.
Chart 2: Gold prices (yellow line, left axis, London P.M. fix) and the U.S. dollar index (red line, right axis, broad trade weighted index) year-to-date.
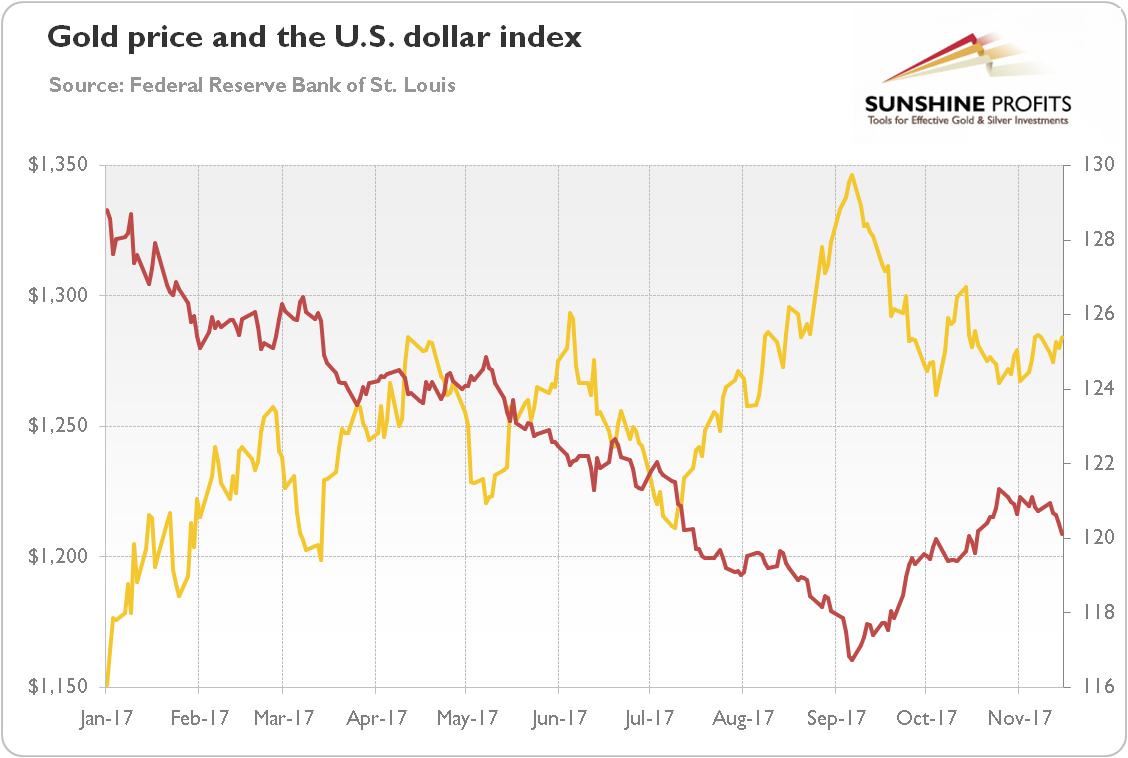
The medium-term trend of the greenback does not look encouraging, but there was a rebound in September. And we bet that the U.S. dollar is likely to strengthen when the tax reform bill passes, as it implementation will reduce uncertainty and could unleash spending.
And one can see, there is also a significant negative correlation between gold and the U.S. real interest rates (here reflected by the 10-year inflation indexed Treasuries).
Chart 3: Gold prices (yellow line, left axis, P.M. London Fix) and the real interest rates (red line, right axis, yields on 10-year Treasury Inflation-Indexed Security, in %) year-to-date.
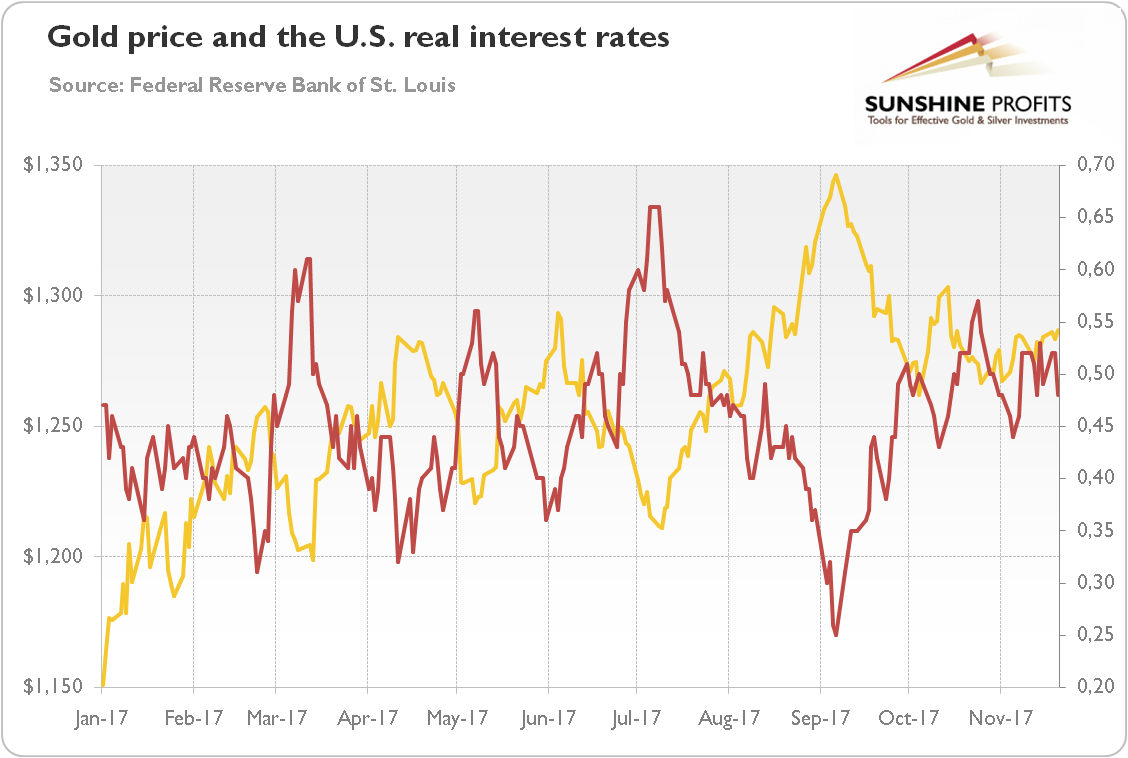
We expect that with steady growth in the GDP and still subdued inflation, the real yields should increase over time. The rising real interest rates will be a major headwind for the gold prices. The key thing here will be inflation rate – or actually inflation expectations.
Although we believe that inflation will rise slightly next year, the end of the year is not likely to witness significant inflationary pressure. The next chart shows that investors’ expectations about future inflation actually decreased in November.
Chart 4: The monthly averages of U.S. spot inflation expectations derived from 10-year Treasuries (red line) and the forward inflation expectations derived from 5-year and 10-year Treasuries (blue line) year-to-date.
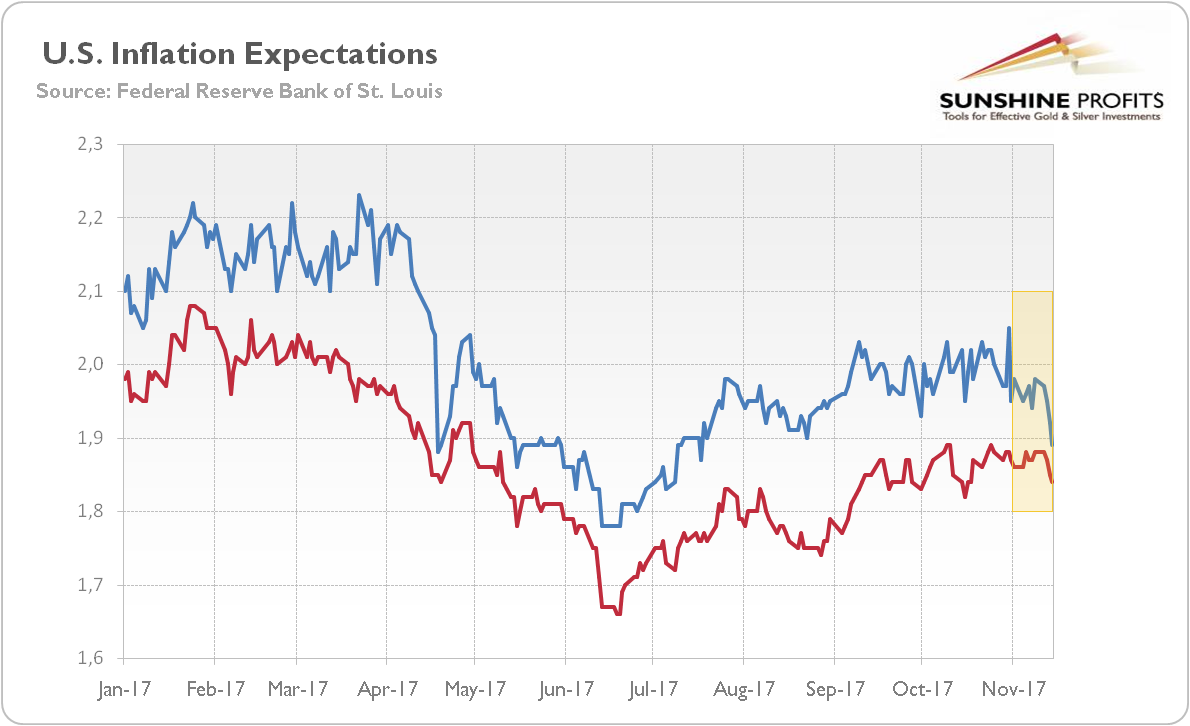
This is not good news for the gold market. Not only because the inflation-hedge demand for gold will not increase, but also because soft inflationary expectations translate into higher real interest rates. However, inflation is not subdued enough to change the Fed’s stance. The U.S. central bank is likely to raise interest rates in December. And gold investors should be prepared for a few more upward moves in 2018. We claim that investors are too skeptical about the Fed’s tightening cycle next year and have not yet discounted fully the upcoming hikes. And if inflation surprises and raises its ugly head, the Fed might adopt a more hawkish course of action, especially given all the pending personal changes in the FOMC.
Hence, investors should remember that the rise in inflation does not have to be bullish for the gold market – a lot depends on the Fed’s reaction to it and the effect on the real interest rates.
Importantly, although the long-term interest rates increased in November, the shorter term interest rates increased even more. In consequence, the yield curve flattened, as one can see in the chart below.
Chart 5: Spread between 10-Year Treasury Constant Maturity and 2-Year Treasury Constant Maturity (green line, left scale, in percent) and the price of gold (yellow line, right scale, London P.M. Gold Fixing).
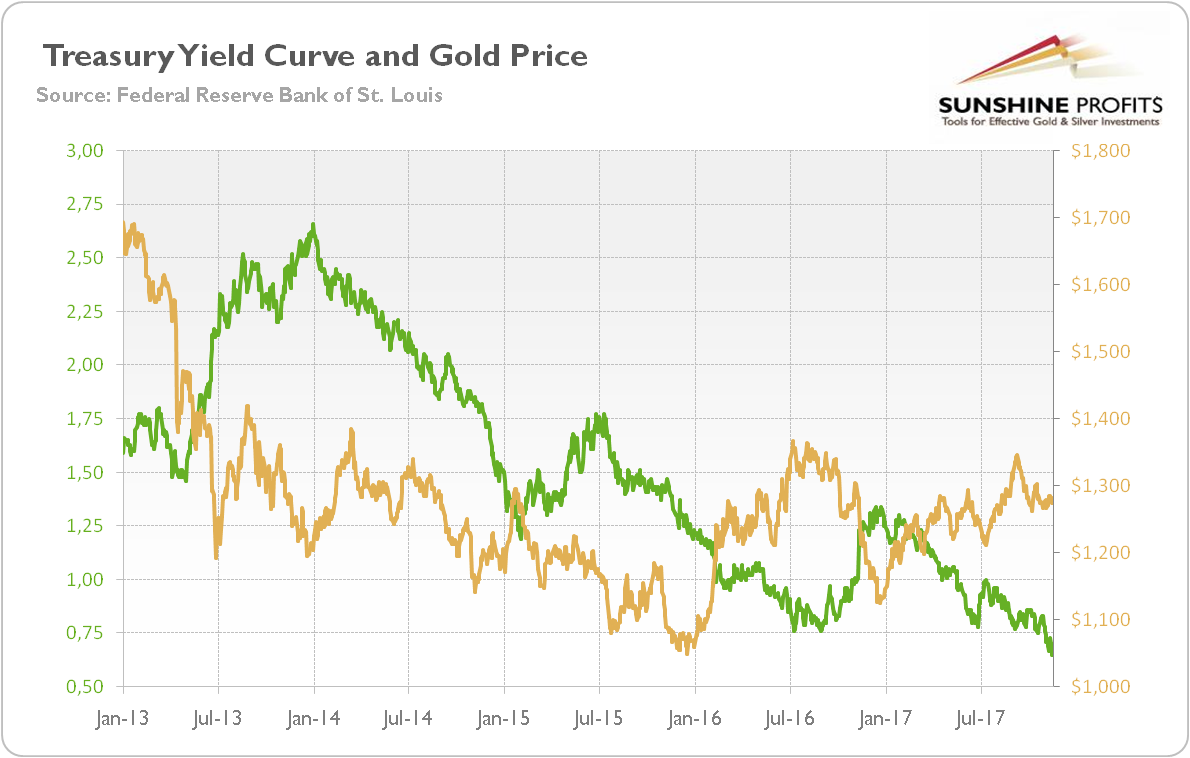
Actually, the difference between 10-year and 2-year yields narrowed to the smallest level in 10 years. A flattening yield curve could be supportive of gold, as it used to be a leading indicator of a potential weakening economy. However, the signal was distorted by global central bank actions in the aftermath of the Great Recession. The reason behind the curve flattening is the surge in the 2-year yield, which is more sensitive to the Fed’s tightening. Hence, the decrease in yield spreads caused by the Fed’s tightening will not support the gold market.
Last but not least, let’s analyze the risk aversion among investors in the last month. As the next chart shows, both the CBOE Volatility Index and the credit spreads spiked in the first half of November.
Chart 6: The market volatility reflected by the CBOE Volatility Index (green line, right axis) and the credit spread reflected by the BofA Merrill Lynch US High Yield-Option Adjusted Spread (red line, left axis) over the last twelve months.
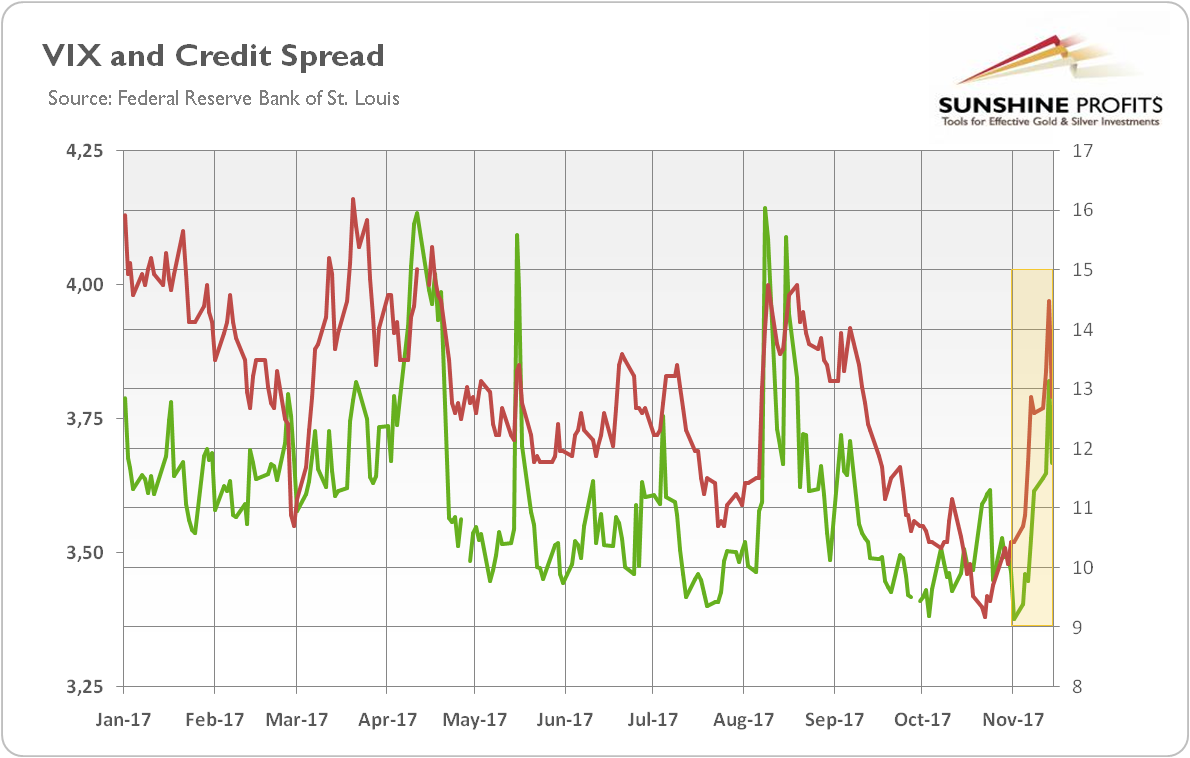
The rise in VIX happened as stocks fell to multi-lows, while the rise in the credit spreads was caused by withdrawal of bond sales by junk-rated companies due to the uncertainty about the tax reform and whether the U.S. government will introduce bonds having a maturity of more than 30 years. The price of gold was certainly supported by these changes, so the likely reversal – we are already witnessing it – creates a downside risk for the gold market.
To sum up, although real interest rates increased, gold slightly gained in November due to weakness in the U.S. dollar and the rise in the fear at the markets. However, if the uncertainty about the tax reform eases, the price of the yellow metal might lose some of its support. A lot will depend on the December FOMC meeting, which might be a turning point for the gold market, and determine its future for a while. The hike at this meeting is already priced in, but investors will seek clues about the future course of actions. The latest FOMC minutes were rather dovish, as they showed worries about the subdued inflation, but we cannot exclude a hawkish surprise, given the solid growth rate. We believe that until the December FOMC meeting (or significant changes in the prospects of the tax reform), there is no short-term catalyst strong enough to push gold prices significantly higher or lower. Having said that, the outlook may change in 2018 – we will discuss it in the January edition of the Market Overview. Stay tuned!
If you enjoyed the above analysis and would you like to know more about the impact of the macroeconomic factors on the gold market, we invite you to read the December Market Overview report. If you’re interested in the detailed price analysis and price projections with targets, we invite you to sign up for our Gold & Silver Trading Alerts. If you’re not ready to subscribe at this time, we invite you to sign up for our gold newsletter and stay up-to-date with our latest free articles. It's free and you can unsubscribe anytime.
Thank you.
Arkadiusz Sieron, Ph.D.
Sunshine Profits‘ Gold News Monitor and Market Overview Editor
Gold News Monitor
Gold Trading Alerts
Gold Market Overview
