

Gold finally broke below the triangle pattern and confirmed multiple medium-term bearish signals that we previously saw. Gold is the flagship metal of the precious metals sector, so the above is an important indication for the short term. However, the most important development for gold and silver investors happened somewhere else.
USD’s Breakout
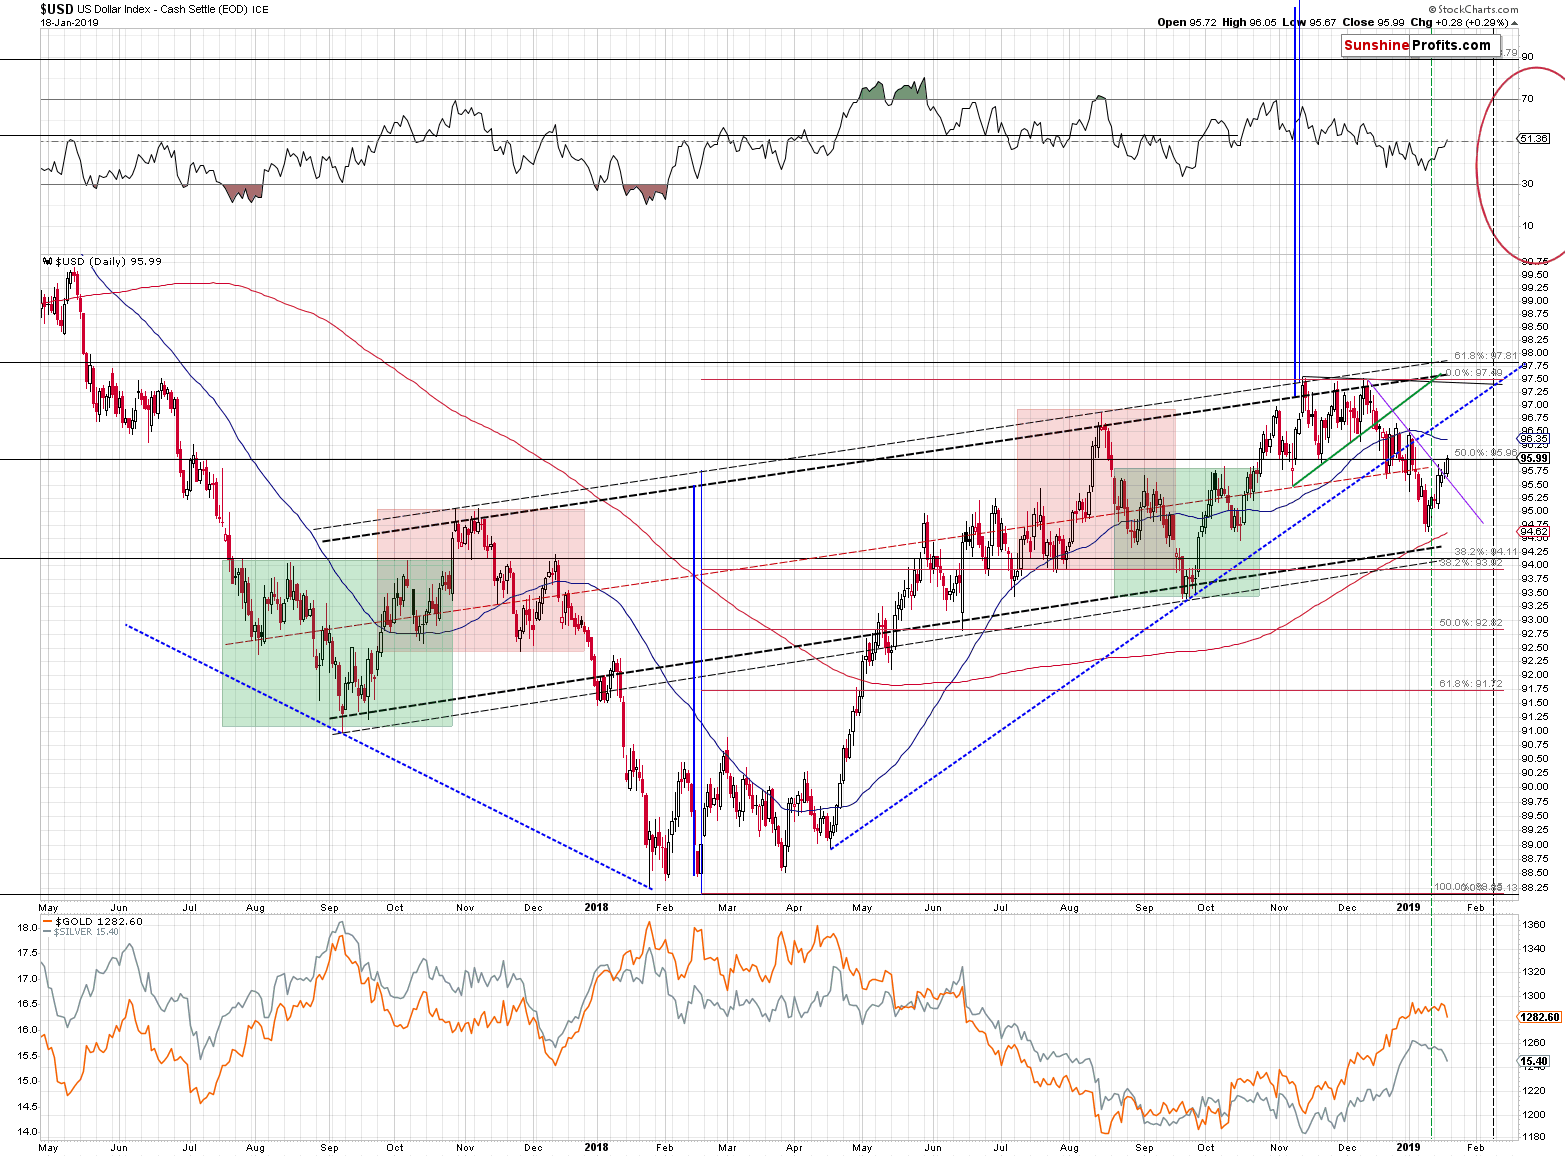
The USD Index broke above the declining short-term resistance line that we marked with purple. Even though the breakout is not yet confirmed, this changes the short-term outlook for the USDX to bullish. The USD has been weak on a short-term basis, despite bullish medium-term outlook and Friday’s breakout suggesting that the short-term trend has finally changed and that – perhaps – the medium-term rally has already resumed.
This, plus the likelihood that gold is now going to magnify USD’s bearish signals (i.e. USD’s rallies), has very bearish short term implications for gold, silver, and mining stocks.
The next triangle-vertex-based reversal is in early February (marked with vertical, dashed line), which is in tune with what we wrote on Friday about the likelihood of the possible reversal in early February.
Gold’s Dramatic Pause is Over
We previously wrote the following about the situation in gold:
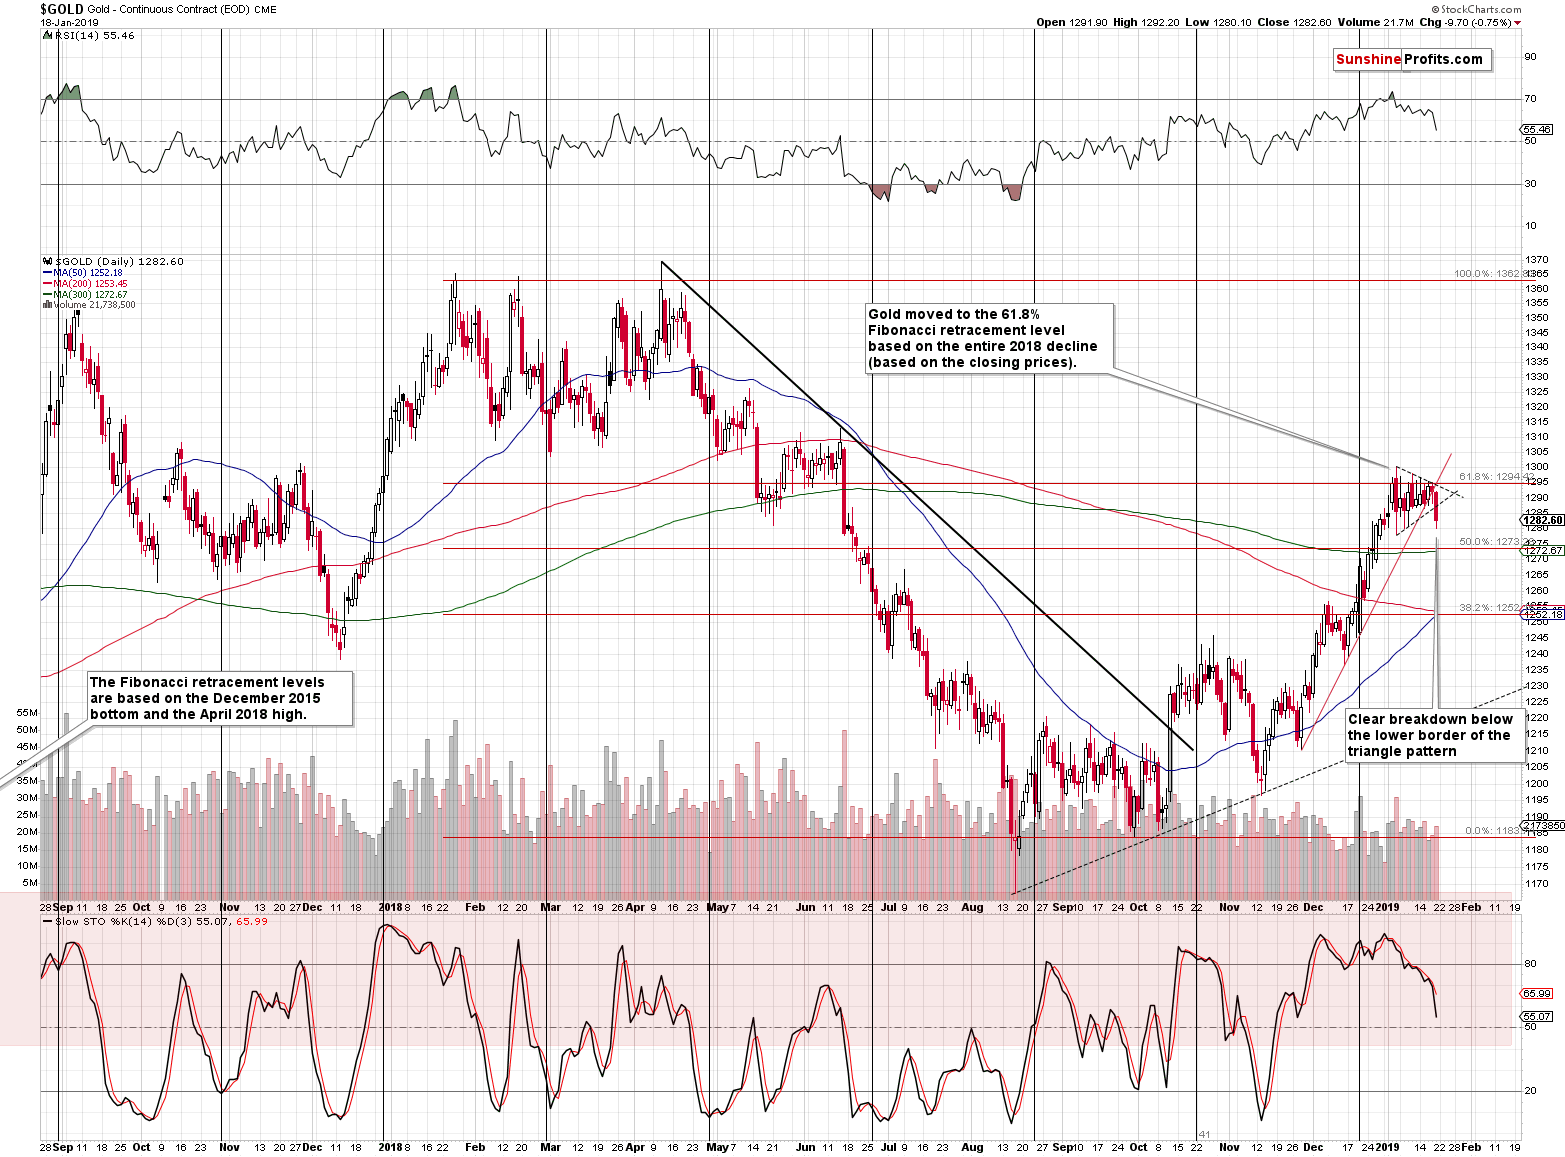
(…) Gold is moving back and forth within a triangular pattern and the fact that yesterday’s close was the second highest close of the year doesn’t change anything. The relatively low volume that accompanied the upswing (lowest daily volume of 2019) confirms it.
Gold received a lot of publicity and it was even Cramerized. And yet, the buying power appears to have almost dried up. Gold had a good reason to rally further, but it didn’t. If there are very few buyers left, who’s left to keep pushing the price higher?
Given positive news, gold was almost forced to rally and the fact that it was at its rising support level helped. But this rally was as weak as it gets. The volume was relatively low, there was no breakout and neither silver, nor mining stocks confirm the daily upswing.
The above lack of strength – unsurprisingly – resulted in price declines. Gold declined and broke below the triangle pattern and below the rising red support line. And it did so with only small help from the USD Index.
The gold volume was big in relative terms (bigger than what accompanied two previous days’ action), but not in absolute terms. The former suggests that the move was rather not accidental, and the latter suggests that the full strength of the bears is yet to come. The implications of Friday’s action are very bearish.
Before moving to silver, let’s take a look at the confirmations that we just saw from the MACD and PMO indicators.
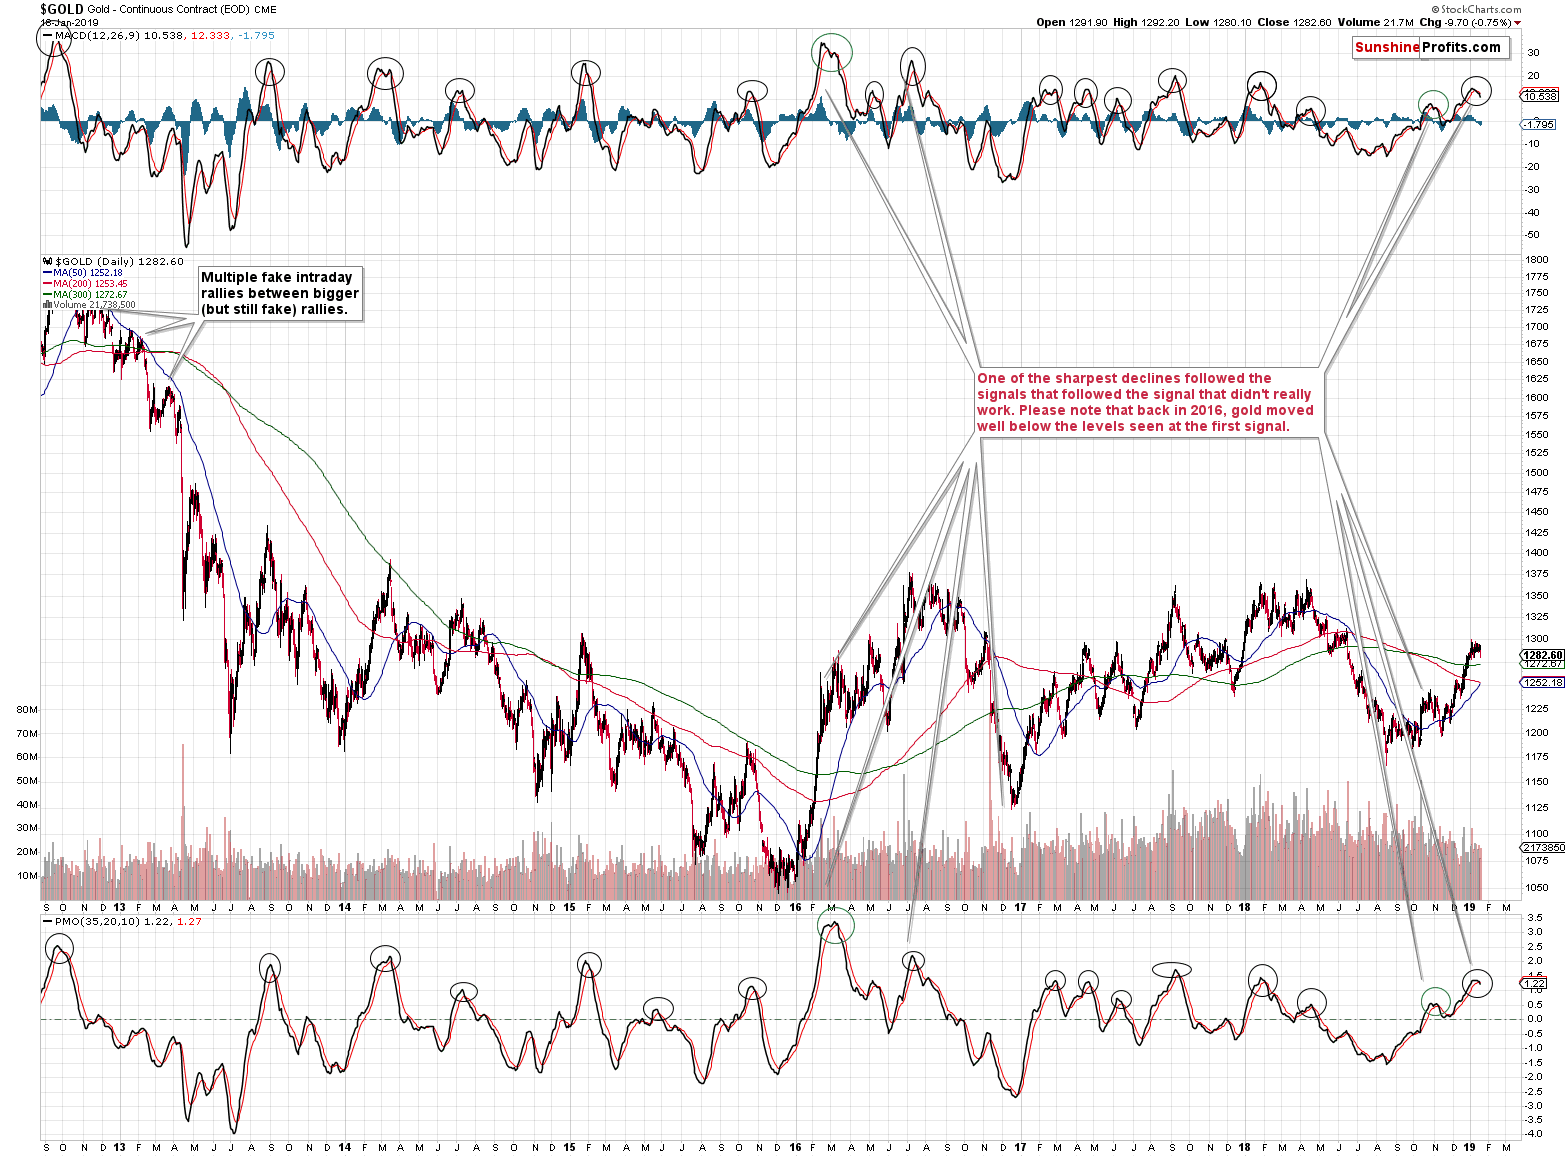
They are both very useful for detecting major tops in gold. They were extremely effective in the previous years. There were two cases when they didn’t indicate a huge decline. One of those cases was in 2016 and the second one was in late 2018. This is interesting because of two reasons:
- We just saw a double sell signal once again, which – being very effective in the previous years – is a strong bearish factor on its own
- We saw the signal after a decent rally that followed a fake signal, just like in 2016. That was the only serious outlier from the otherwise extremely effective set of signals and even the analogy to this outlier has bearish implications. The moment when we saw the double sell signal in mid-2016 was the confirmation of the top of the year and it was an indication of one of the biggest medium-term declines of the past years.
Implications of both are bearish and it seems that shorting gold is a much better idea than buying it – at least if one wants to profit in the next several weeks and months. While we can’t make any promises, in our opinion, there will most likely be a much better time to buy gold later this year. It’s not the time to ask how do I buy gold, but rather when do I buy it.
Having said that, let’s turn to gold’s sister metal – silver.
Silver’s Decline – Slowly, but Surely
At least for now.
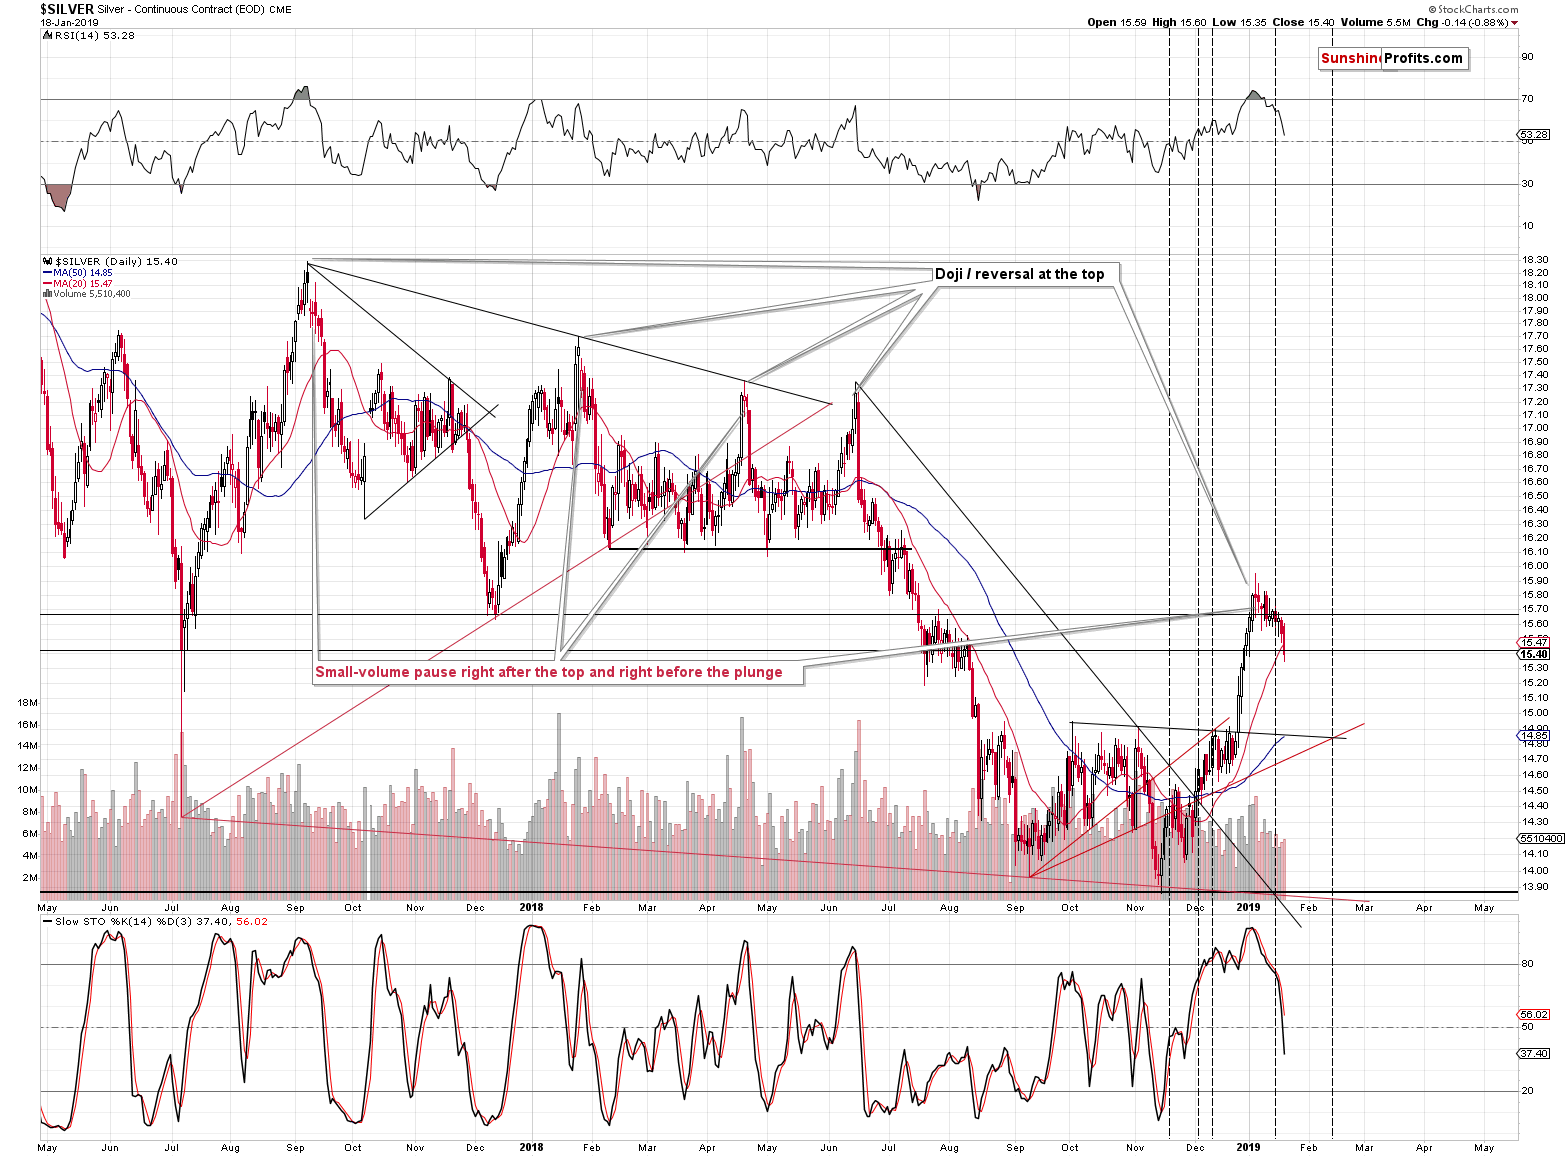
Silver didn’t plunge yet, but it declined and closed the week below the 2017 bottom in terms of the daily closing prices. Our comments on the shape of silver’s post-topping action remain up-to-date:
(…) Taking the previous four important tops into account, we see that two of them were not followed by an immediate slide, but rather by a consolidation. Both: September 2017 and January 2018 tops were first followed by a rather steady decline. The slide accelerated only after several days of the less volatile movement.
If something like what we’re seeing right now happened in case of half of the recent tops, then one shouldn’t view it as something odd, or bullish. It’s one of the normal ways for silver to form major tops.
Please note that silver outperformed gold right before the top, which confirms that it was the final part of the upswing. The fact that silver continues to perform like it usually does at and right after the tops simply confirms the above and adds to the credibility of the bearish signal. The tendency for silver to outperform right before an important price top is not only something that related to only the current situation – it’s one of the silver and gold trading tips that is likely to be useful for years to come (it’s been useful for many years already).
Silver declined in a more visible manner than gold, which is both: understandable, and likely to continue. Why?
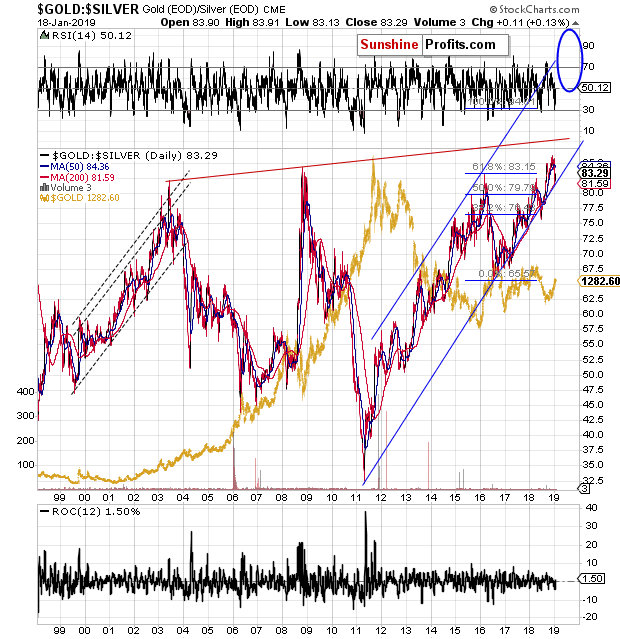
Because of the rising trend channel in the gold to silver ratio. The ratio just bounced off the lower border of the channel while RSI touched the 30 level. That was likely a short-term bottom and a verification of the move above the previous tops. The medium-term rally can – and is likely to – continue. The upside target based on the very long-term resistance created by previous long-term tops is at about 100 level. At the moment of writing these words (gold: $1,283.60; silver: $15.28), the gold to silver ratio is at 84, so the upside potential is significant.
Silver is likely to decline in a profound way because of both: its own tendency to decline very fast either immediately after the top is formed or after several days of slower decline, and because of the situation in the gold to silver ratio.
Can mining stocks confirm the above bearish indications?
Mining Stocks Lead the Way to New Lows
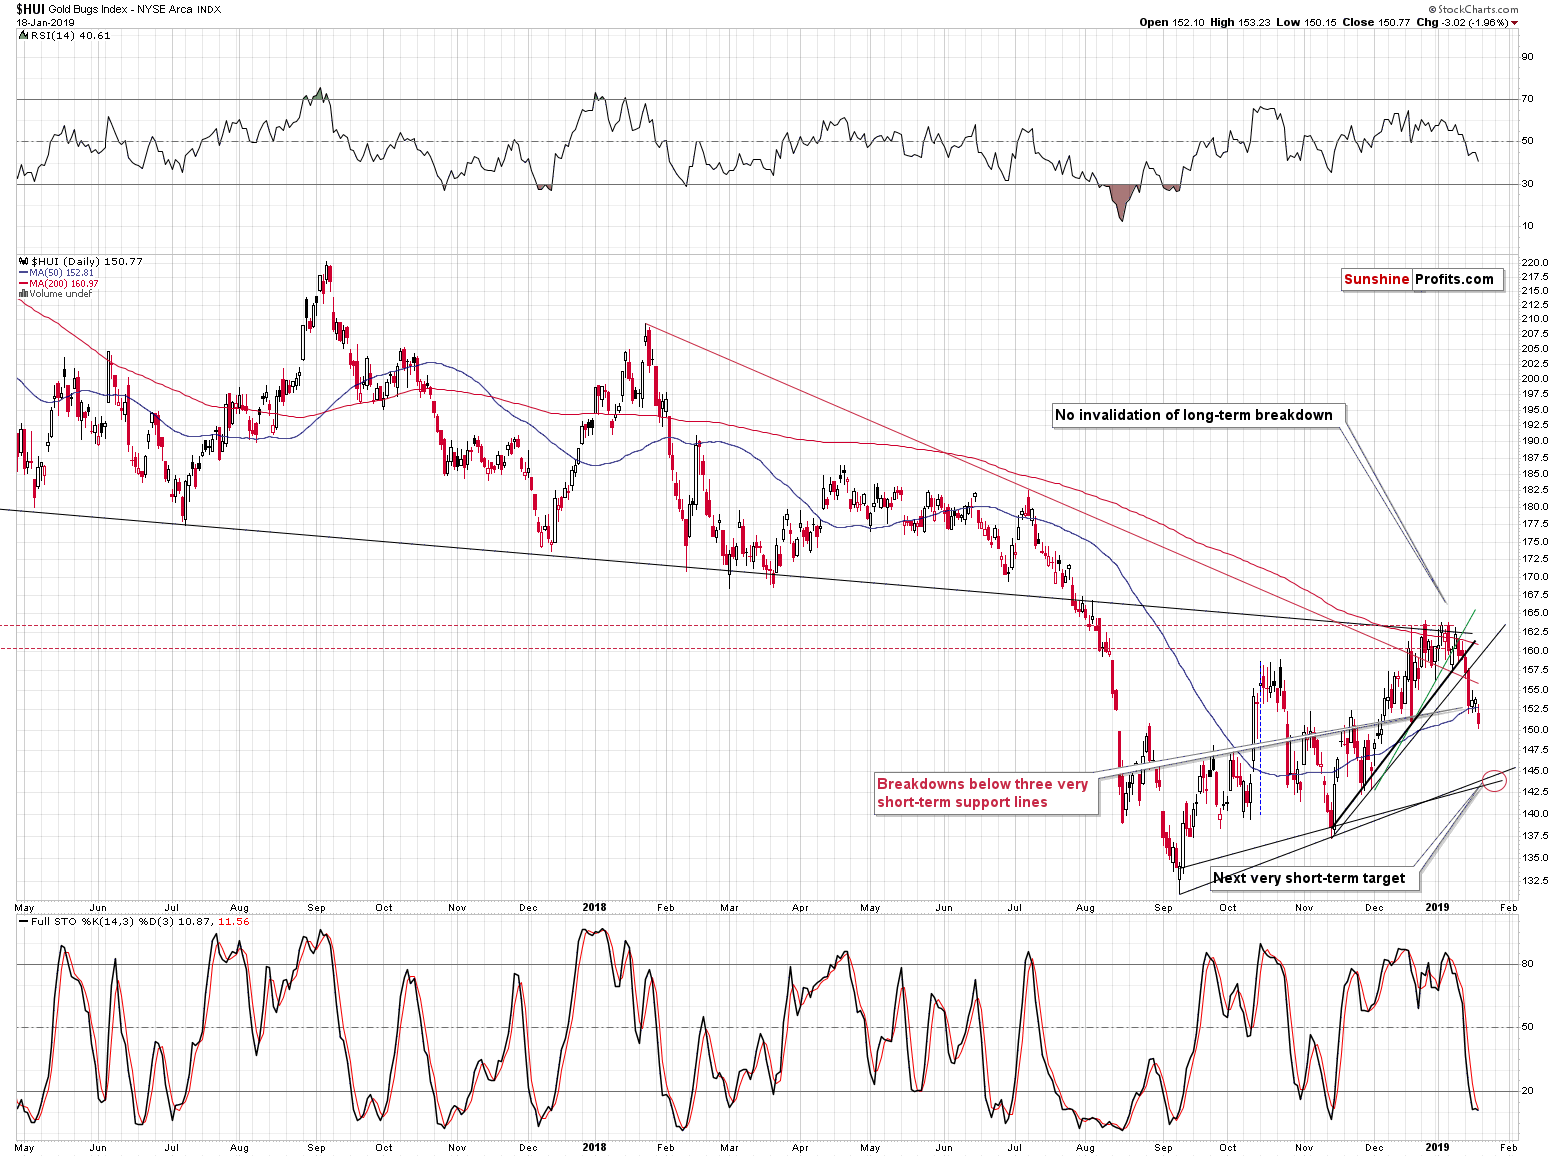
In short, yes. All short-term breakdowns below rising and declining support lines are now confirmed, and we even saw a move below the 50-day moving average. Gold miners’ low that we saw on Friday was below the late August 2018 high. If anyone had any second thoughts about whether gold stocks underperform gold or not, they have their final proof – gold’s late-August high is $1,221.
No market moves up or down in a straight line, so there will be periodical corrections, and some of them will be tradable. The next quick target for the miners is at about 143 – 144 for the HUI Index (proxy for senior gold mining stocks), but it seems that betting on a rebound is not justified from the risk to reward point of view. The possible move higher is not likely to be significant, but the following decline is very likely to be significant. One of the reasons is visible on the below chart.
A week ago, we described the above chart in the following way:
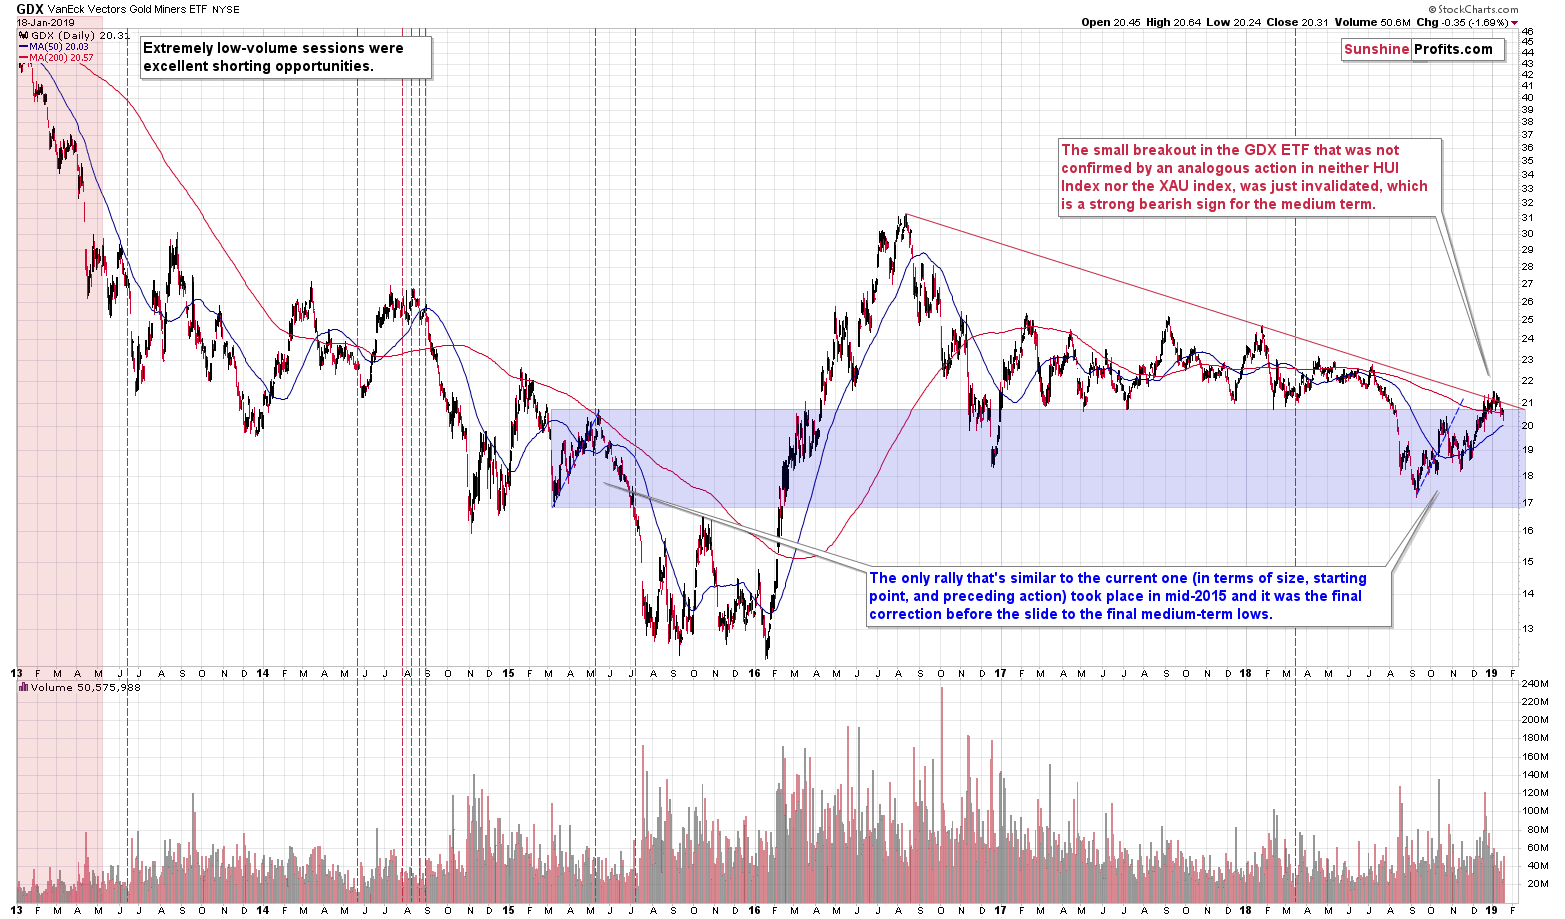
[The recent upswing in the miners] probably doesn’t look familiar, but it actually should. We saw almost identical corrective upswing in mid-2015. The previous rally started from a bit lower levels and ended a bit lower as well (we used the blue rectangle on the above chart to make the comparison easier), but the differences were tiny. The entire size of the upswing was extremely similar, and we marked it with a blue dashed line. Copying the previous decline to the 2018 bottom shows that the current upswing’s end (assuming that it ended) is very much in tune with where the rally should have ended based on the 2015 - now similarity. Moreover, both rallies ended when GDX moved a little above its 200-day moving average.
Why is this similarity important? Because that was the final corrective upswing before the slide to the 2015 lows. The decline that followed was more than twice as big as the size of the corrective rally. That’s very bearish on its own, but let’s keep in mind that in 2015 the USD Index was after a multi-month rally and this time it seems that its medium-term rally is far from being over. Consequently, the potential for the decline in the miners is even greater this time.
Given the short-term breakdowns and – visible above – invalidation of the small breakout above declining red resistance line, it's now very likely that the rally has indeed ended. Please take a look at the shape of the mid-2015 decline. There were barely any corrective upswings and those that did materialize were tiny. Given the above-mentioned similarity between 2015 and now, we might see something similar here, especially that there’s practically no serious support between the 2018 bottom and the early 2016 bottom.
There’s also something else that indicates lower prices in gold – its ratio with palladium.
Is Palladium the New Gold?
Palladium is now more expensive than gold. Some of my friends joke: “of course it is, after all, your wedding ring is made from it, so you knew that this would happen”, but my take is that it was the increased demand for gasoline-powered cars over the diesel-powered ones that caused palladium to truly shine while platinum continues to disappoint. This is especially the case given the relatively small size of the palladium market implies that its price is much more sensitive to the balance of the annual demand and supply.
Moving back to palladium’s link with gold, the moment when both metals’ cost per ounce is similar is quite specific. It’s easy to notice it, it looks interesting, so it gets media coverage. This publicity makes is a strong support and resistance level. After all, some will say that there’s no way that palladium could be worth more than gold and buy the latter by selling the former.
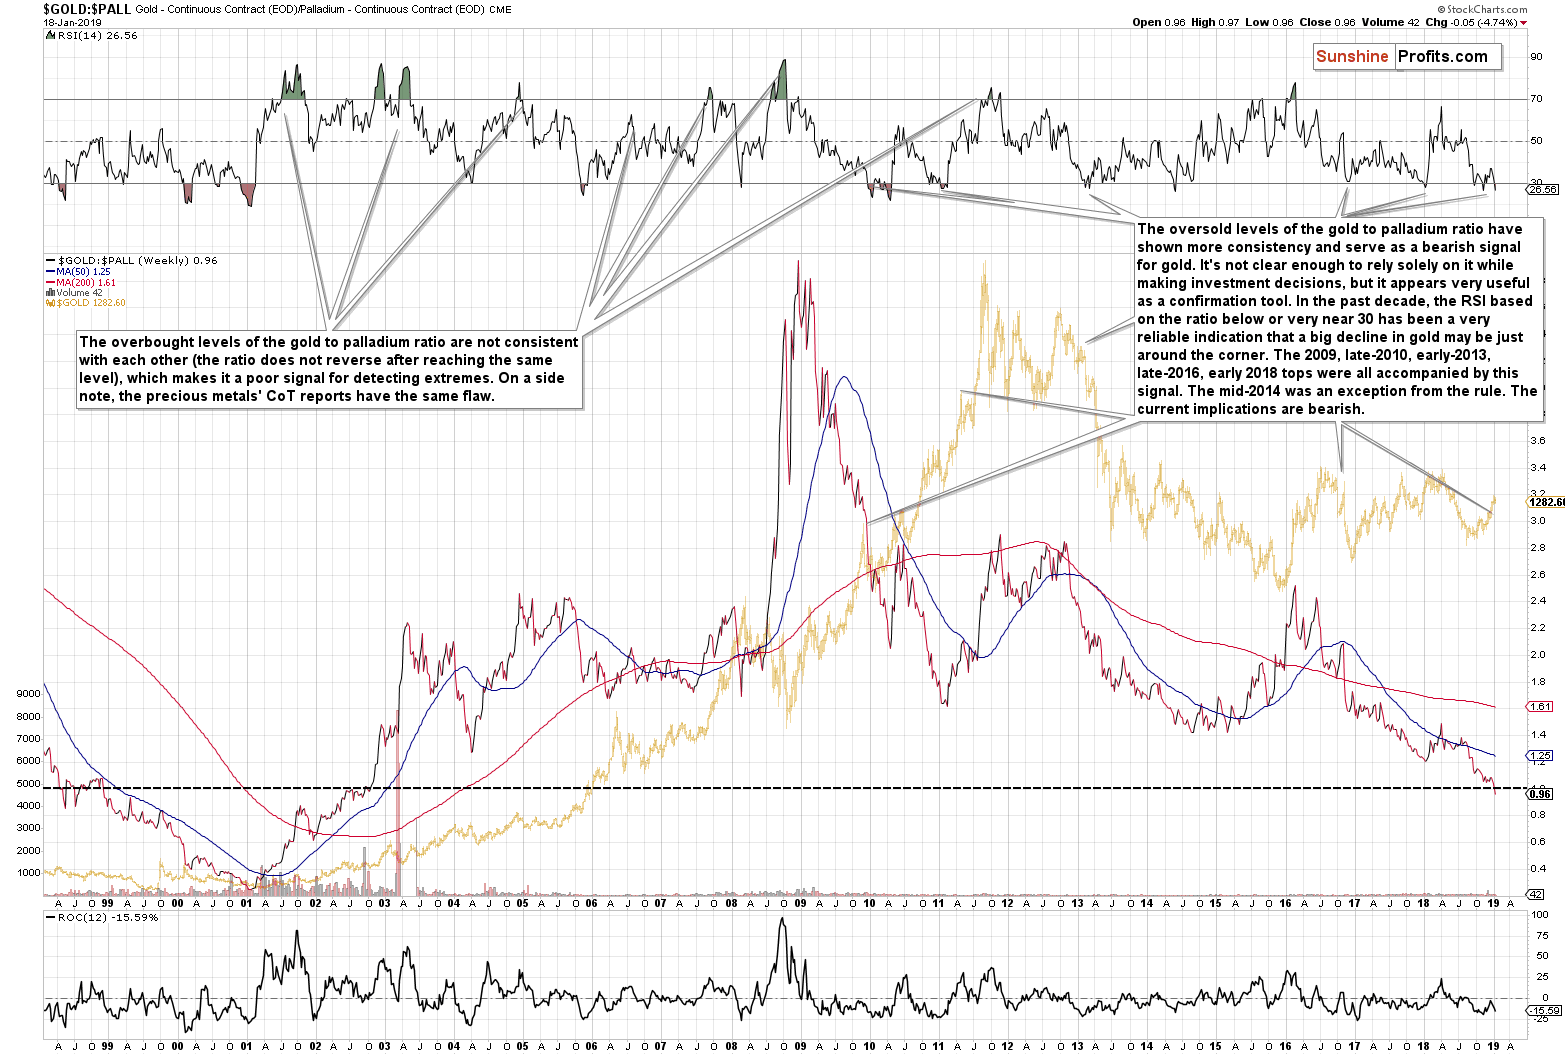
The above chart shows that this was indeed the case in 1998 and in 2002, when the gold-palladium ratio was trading close to 1. It stayed close to this level for weeks, before moving further. In 1998 the ratio moved to 1 from above it, so this situation is more similar to what we’re seeing right now. That was the time when gold started its final decline to THE bottom that was then followed by a multi-year rally. Based on many other signals this is exactly where gold market is right now and this serves as yet another confirmation.
Moreover, looking at the RSI indicator we see that oversold levels in it usually were bearish signals for gold, at least in the past decade. The RSI is visibly below 30, which is the very definition of it being oversold. The implications for gold are bearish also from this perspective.
Summary
Summing up, the bearish outlook for the following weeks has been confirmed by multiple factors, i.a. silver’s extreme outperformance and miners’ underperformance, gold’s performance link with the general stock market, gold getting Cramerized, and many more, but the above are now confirmed by also short-term signals. The USD Index broke above the short-term support line, gold broke below the triangle pattern and silver’s decline is gaining momentum. This all tells us that more weakness in the PM market is just around the corner. The number of signals confirming the above and the profit potential of this situation are enormous. It’s not the best time to prepare as the best time was many months ago. But it’s the final time when you can do something about this huge opportunity without regretting it in several weeks, months, and – perhaps – years.
Naturally, the above is up-to-date at the moment of publishing it and the situation may – and is likely to – change in the future. If you’d like to receive follow-ups to the above analysis (including the intraday ones, when things get hot), we invite you subscribe to our Gold & Silver Trading Alerts today.
Thank you.
Przemyslaw Radomski, CFA
Editor-in-chief, Gold & Silver Fund Manager
Sunshine Profits - Effective Investments through Diligence and Care
