

In yesterday’s analysis, we discussed how meaningful gold and silver’s pre-market decline was given a relatively small move in the USD Index. The implications were quite bearish for the PM market, especially that we had just seen a target being reached in gold stocks. And because mining stocks had just underperformed gold for the first time in weeks. Yet, before the day was over, the USD, gold and silver had all reversed and erased most of their daily moves. Does it make the outlook bullish again? Is gold still likely to reach $1,300 shortly?
No. The USD Index indeed reversed its course, but the precious metals’ initial reaction shows how vulnerable they are with regard to the rallies in the USD Index. This is not the kind of reaction that one wants to see when keeping a long position. It’s the one that is preferred while holding a short one.
Let’s take a look at the charts for details. This time, we’ll start with the USD Index (charts courtesy of http://stockcharts.com).
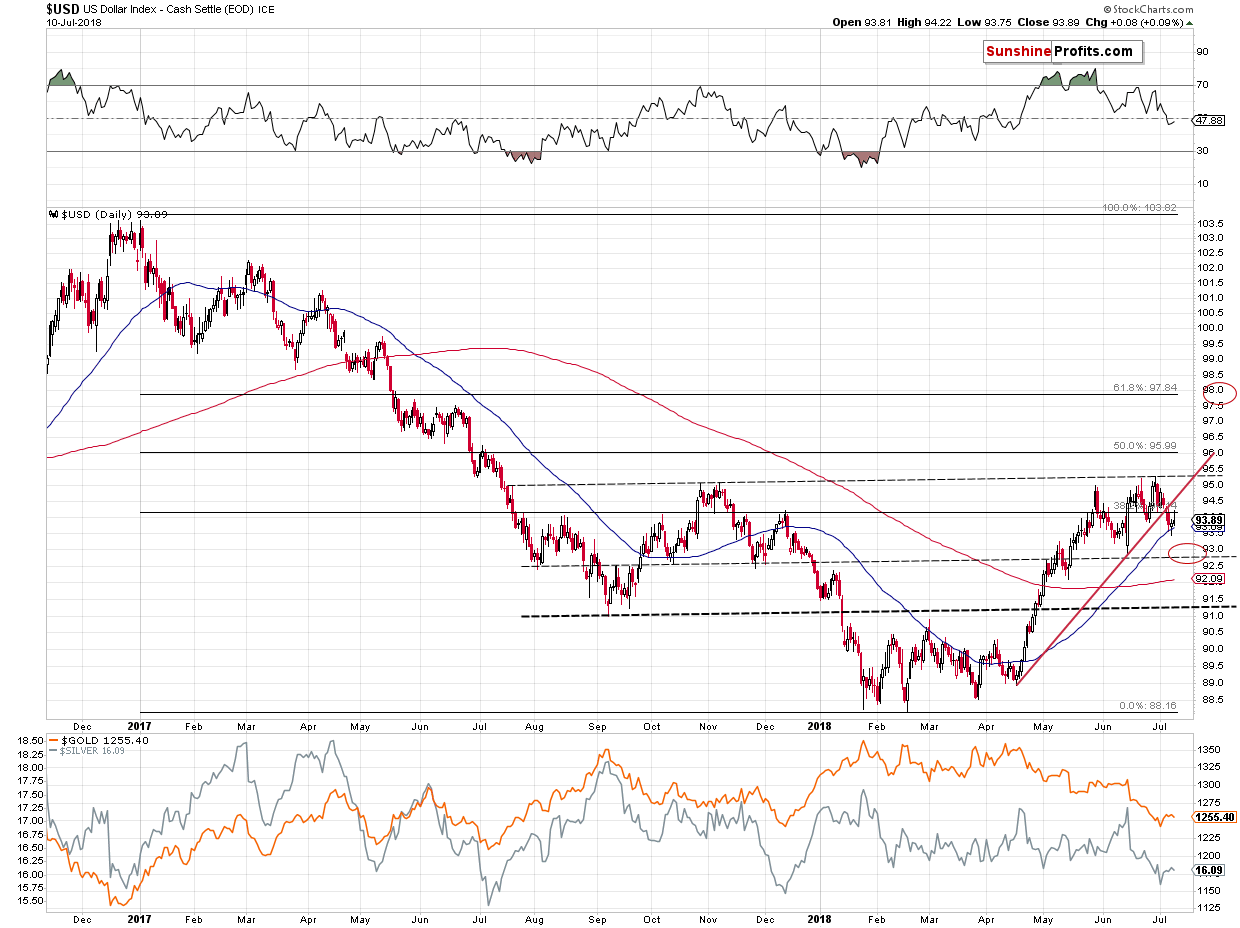
During a real, sizable upswing, gold usually reacts in a most profound way to the USD’s weakness in the initial part of the rally and the strength of the reaction diminishes as gold’s rally continues. A very weak reaction to the USD’s bullish signals is a sign that the rally is close to its end. Consequently, if gold was really to rally above $1,300, it should have rallied to $1,280 or so during the initial part of the rally as a response to USD Index’s decline.
Nothing like that happened.
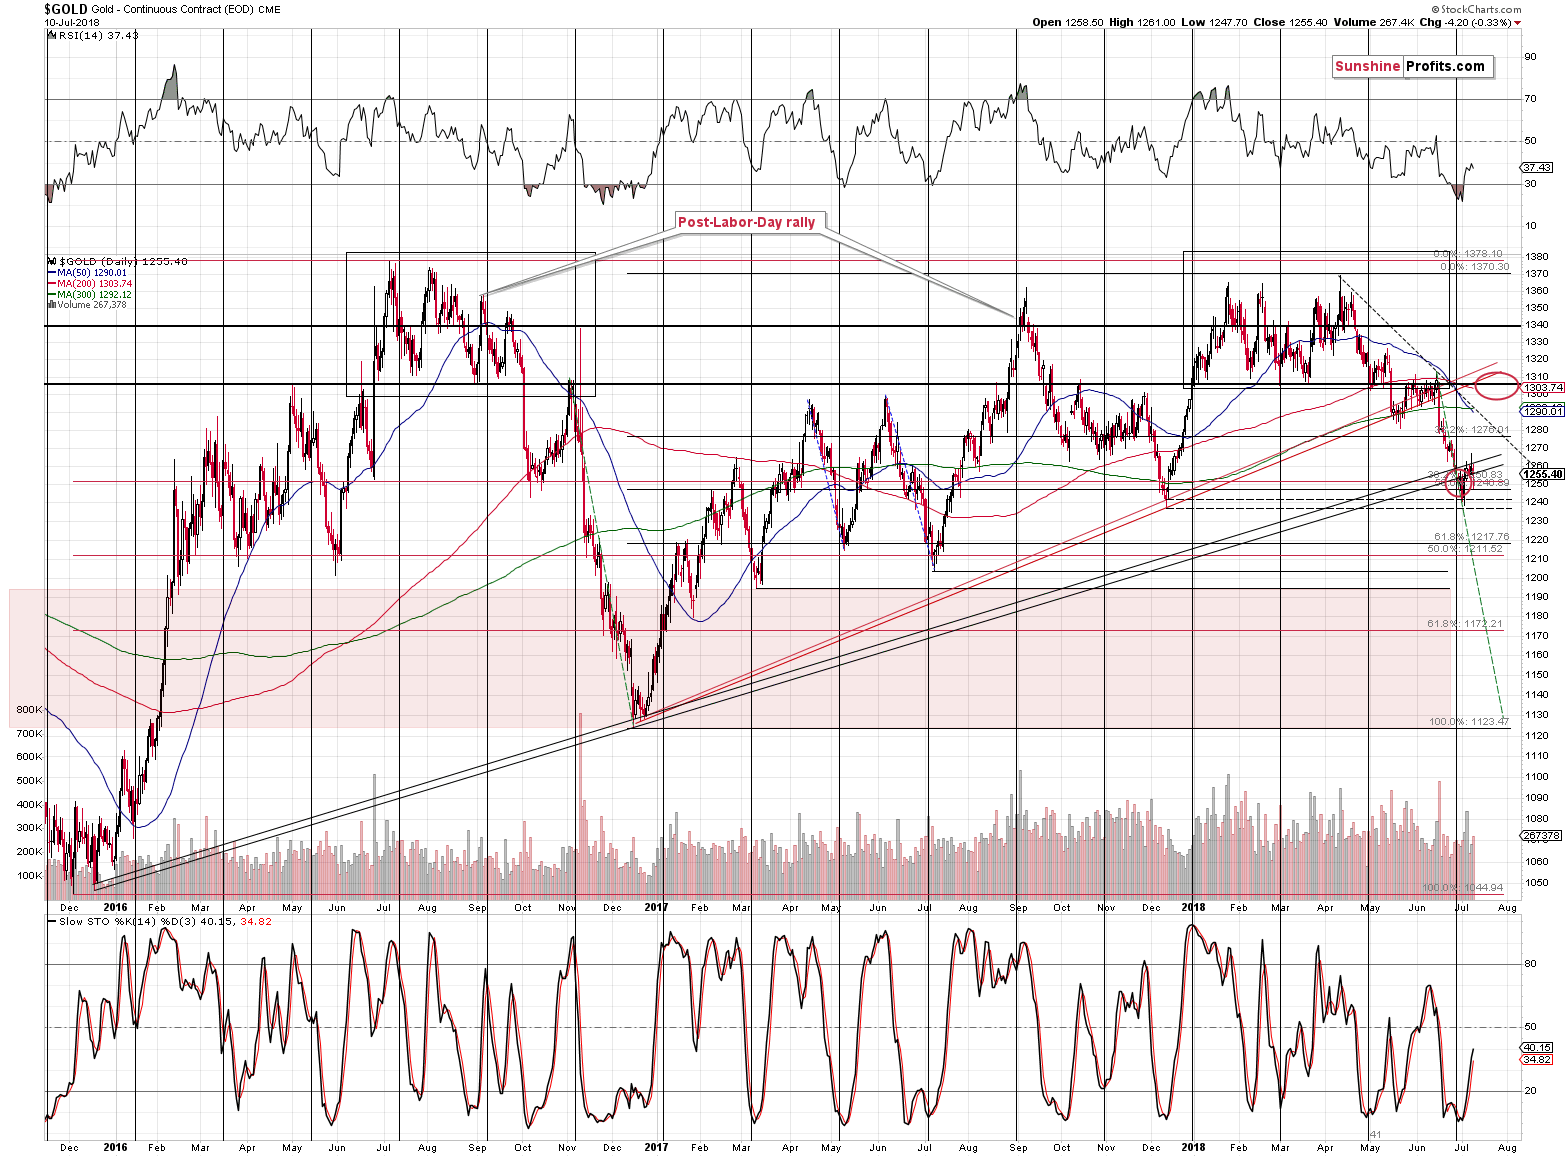
Instead, we saw a breakdown below the medium-term support line that was based on major bottoms (late 2015 and late 2016 price extremes). Gold was likely to rally based on multiple factors – and it did - but, instead of invalidating the breakdown and rallying to $1,300 (which seemed quite realistic given the previous oversold situation in terms of the RSI indicator), gold just moved back to the rising support line and verified it as resistance.
In other words, we had many signs confirming a bullish forecast for gold, but perhaps what was likely to happen based on them has already happened. We saw a rally, but gold was not strong enough to even invalidate a breakdown, let alone rally back to the June highs.
On a short-term basis, we see that yesterday’s decline took place on volume that was higher than Monday’s move up, which is a bearish sign. That’s one of the reasons that confirms that taking profits off the table and closing our previous short-term long position in the precious metals market was indeed a good idea.
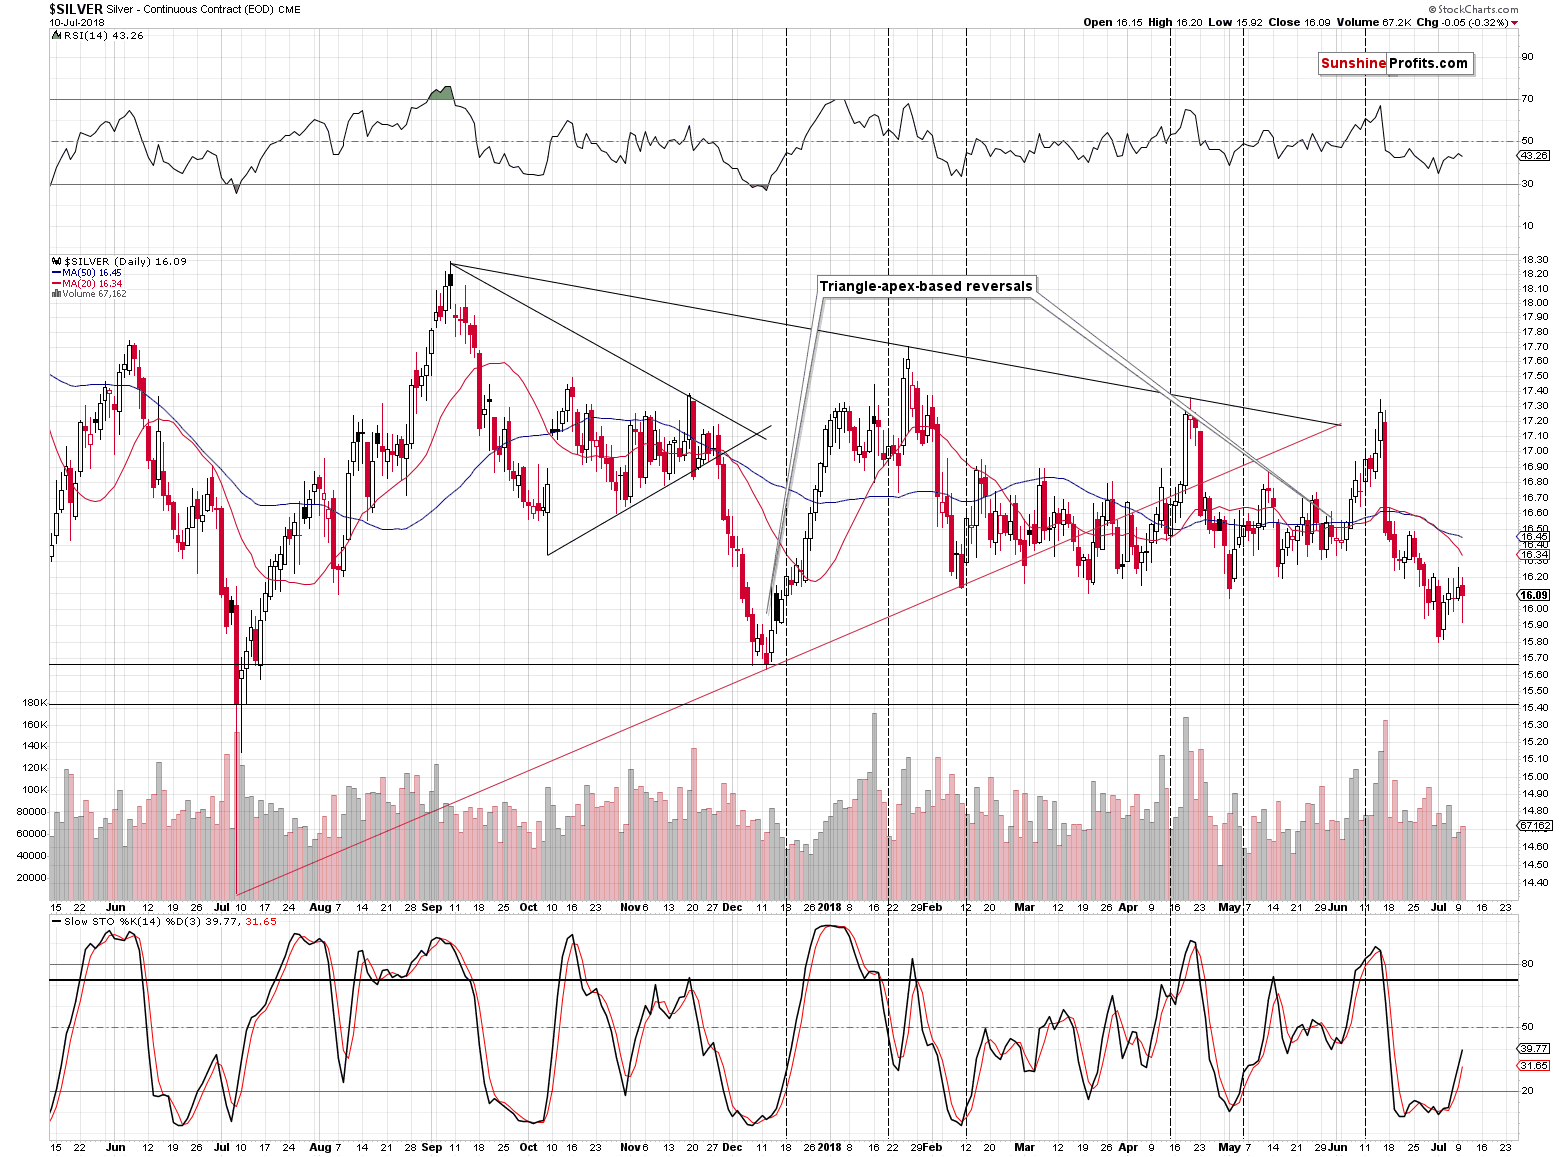
Silver moved back up after the overnight decline, but it closed the session below the previous day’s closing price. What’s really important is that silver closed the day below the previous lowest close of the year ($16.13). This means that – in analogy to gold – silver broke below an important support level (previous 2018 lows) and the recent rally was just a verification of the breakdown.
In general, it’s one of the best trading techniques (here: for shorting) when a market is after a breakdown and then it confirms it by moving back to the previous support and verifies it as resistance. That’s what just happened in gold and what happened in silver.
Both precious metals had good technical reasons to rally back above the mentioned support/resistance levels – but they didn’t manage to do so. This indicates that the short-term outlook can no longer be described as bullish.
The most important confirmation, however, comes from the analysis of gold stocks and their ratio to gold.
Gold Stocks and their Ratio with Gold
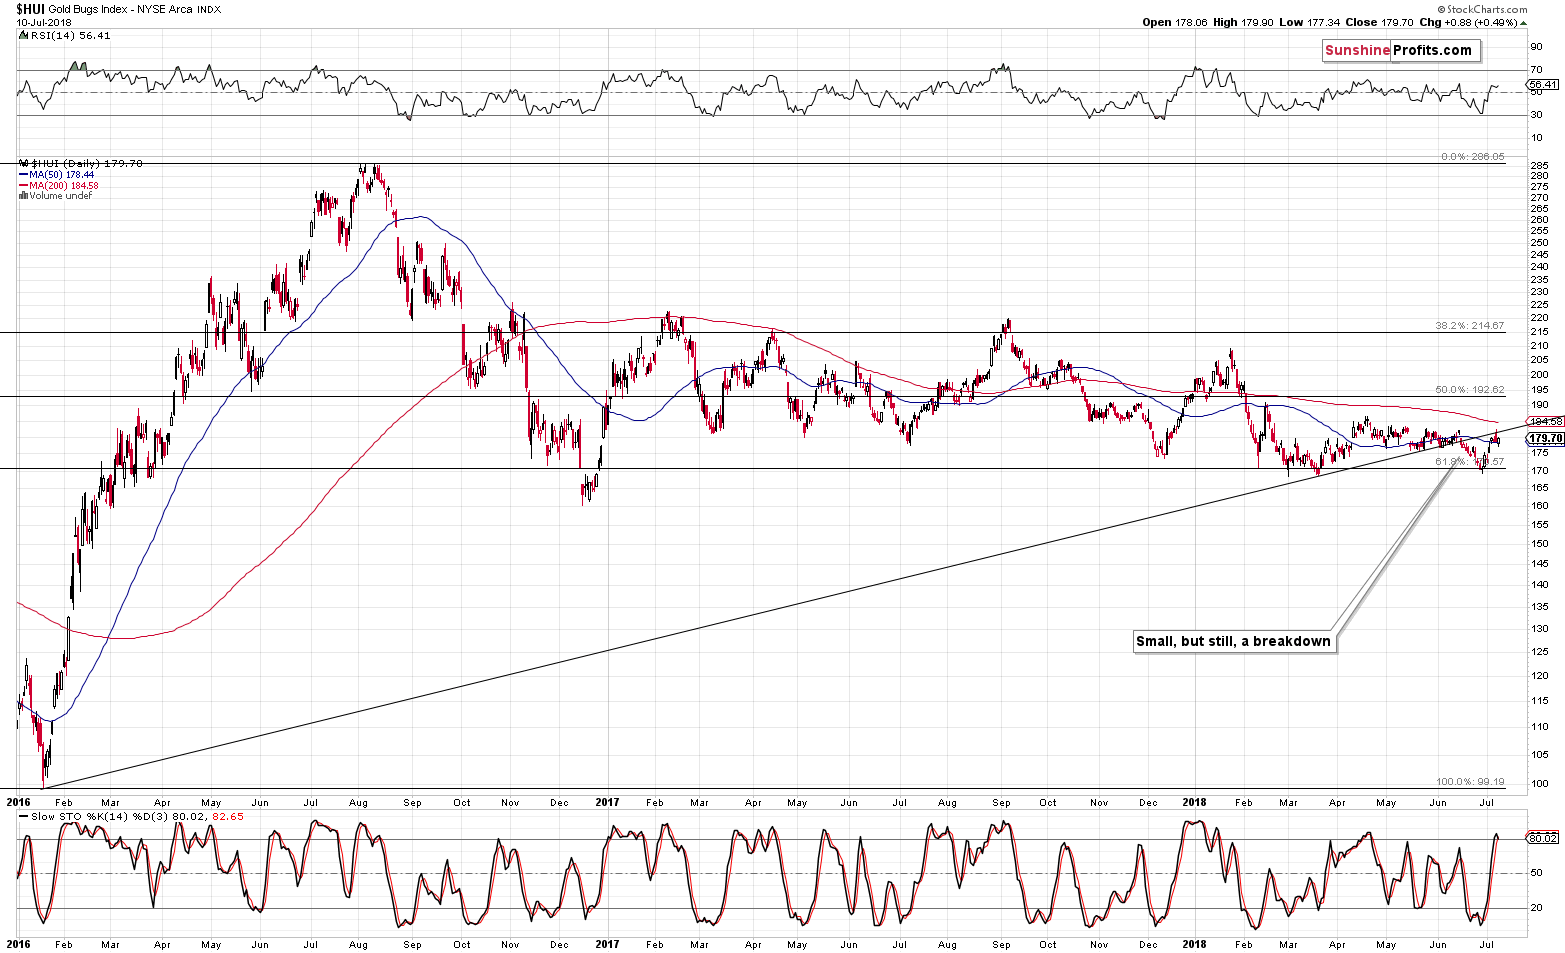
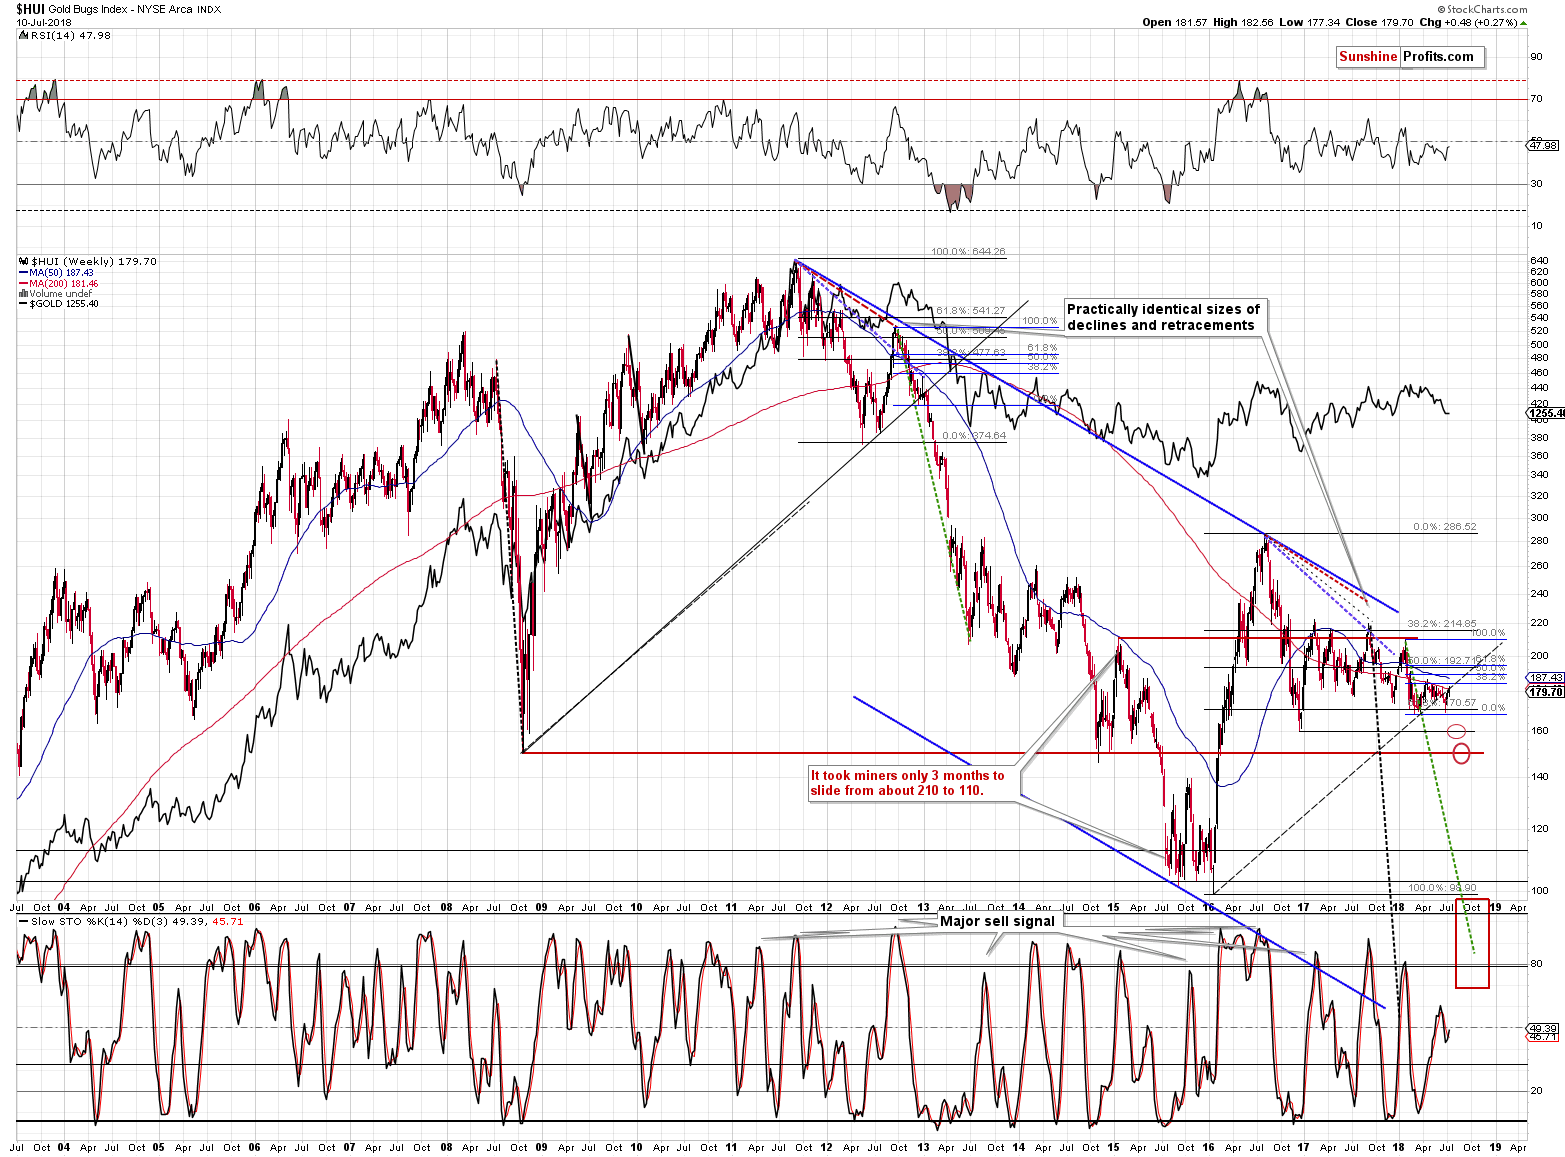
The HUI Index just moved to its June high and – more importantly – to its rising medium-term resistance line, below which it broke a few weeks ago. From the technical point of view, the breakdown was simply verified – the above chart (on its own) has no bullish implications. It has bearish ones.
After the breakdown, the rising line became a natural price target for a short-term rally and it was just reached. Combined with the previously mentioned underperformance in the miners relative to gold it seems quite toppy.
But wait, there’s more.
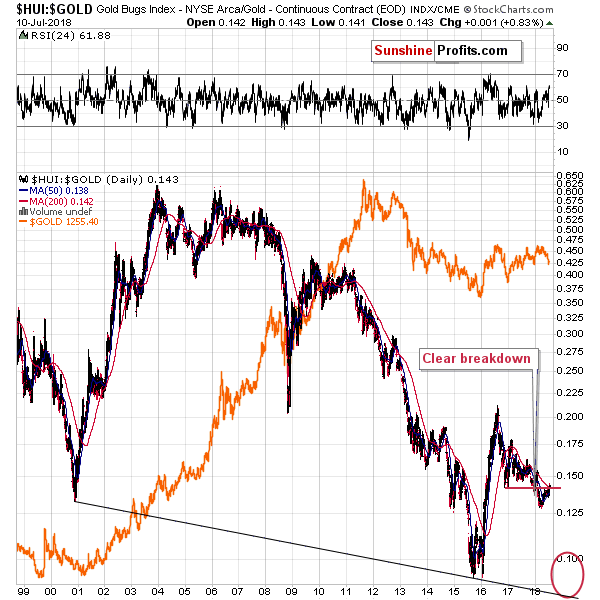
Remember the key breakdown that we saw earlier this year? The gold stocks to gold ratio broke below the long-term support created by the late-2016 low, which was a very important sign pointing to a medium-term decline in the precious metals market.
This breakdown was just verified as the ratio just moved back to the late-2016 low, tried to move above it, and failed. The long-term signals, support lines, breakdowns etc. are more important than the short-term ones, so the above is an important issue.
The implications are bearish for the entire precious metals sector in general. The above indicates that the days of the gold stocks' outperformance relative to gold are over and that we saw an important turnaround in the PM market in general.
Combining all the three mentioned mining-stock-based factors creates a quite strong bearish case for the PMs on its own and these are not the only bearish factors that are currently in play, not to mention the multiple medium-term factors pointing to lower PM values.
There’s also a subtle bearish sign from the Japanese yen.
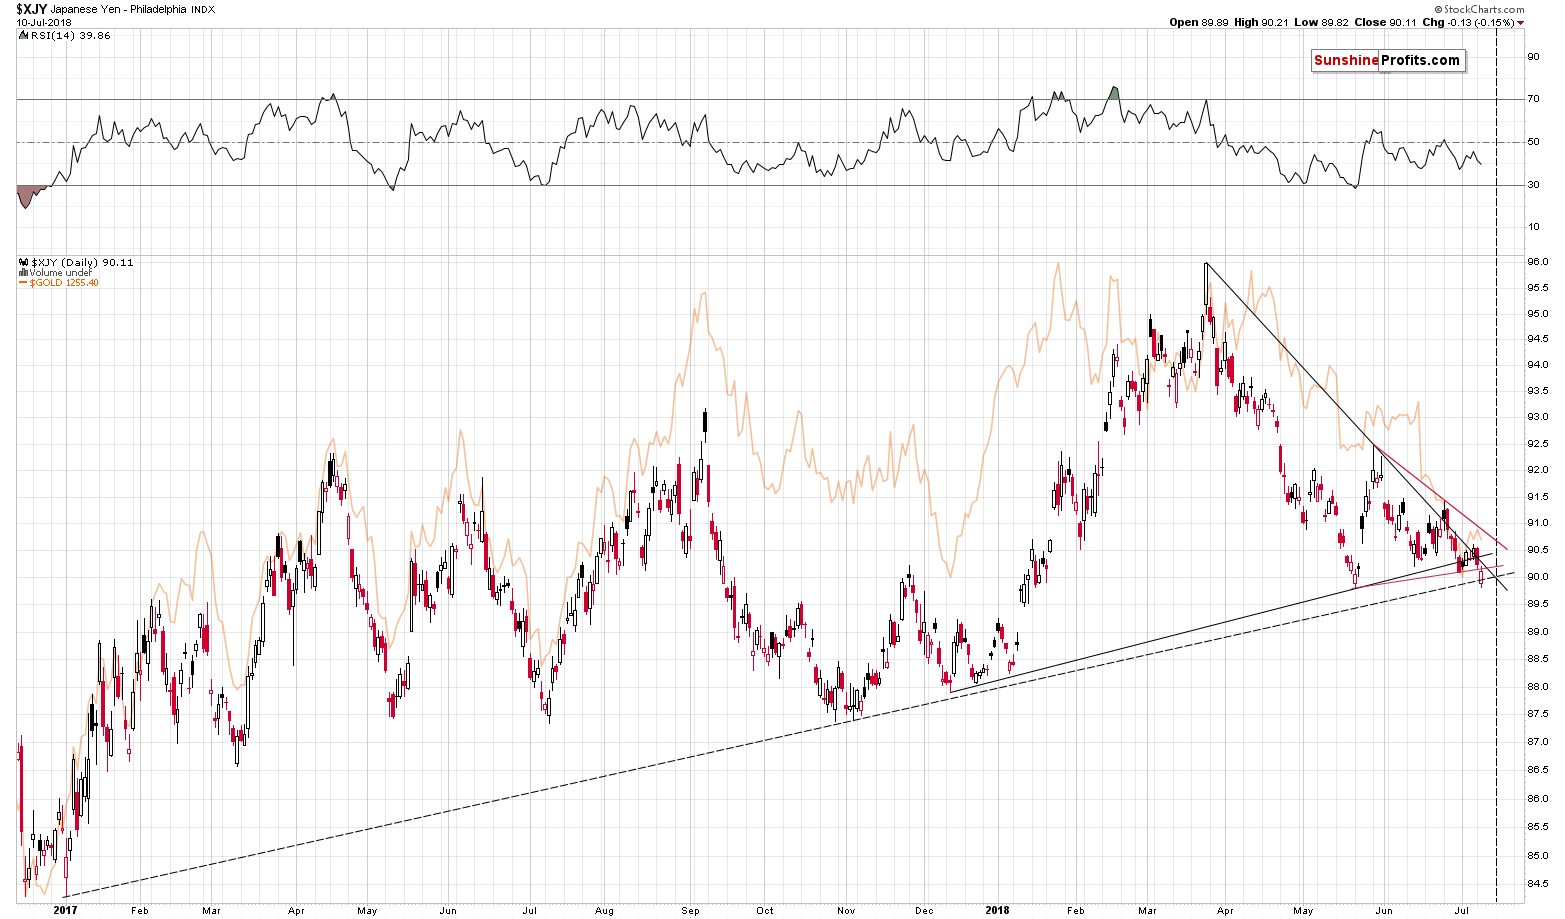
The price of gold quite often moves in tune with the Japanese currency. The latter just broke below several support levels, which has very bearish implications going forward. Based on the closing prices, there was no breakdown below the rising medium-term support line, but there was a breakdown below the triangle marked in red. Therefore, the outlook and thus the implications for the PMs deteriorated to some extent.
Naturally, a breakdown below the medium-term line would have been an even more profound sign, but given today’s pre-market move lower in the yen, it seems that we might see it shortly anyway. The implications for the precious metals market are already bearish and it seems that they may become much more bearish shortly.
Summary
Summing up, due to several developments, the outlook for the precious metals market in the short term is no longer bullish, but bearish. The mining stocks’ underperformance on Monday, the HUI reaching its target, the HUI to gold ratio at a critical resistance, the relative strength of gold vs. the USD, the partial breakdown in the Japanese yen all point to lower precious metals prices.
 Details available to Subscribers only.
Click here to subscribe.
Please note that the above is based on the data that was available when this essay was published, and we might change our views on the market in the following weeks. If you’d like to stay updated on our thoughts on the precious metals market please join our subscribers today..
Thank you.
Sincerely,
Przemyslaw Radomski, CFA
Founder, Editor-in-chief, Gold & Silver Fund Manager
Gold & Silver Trading Alerts
Forex Trading Alerts
Oil Investment Updates
Oil Trading Alerts
