

And so it happened. After a breakdown that might have appeared accidental as it was triggered mostly by one company’s decline, we saw a weekly close below the key 61.8% Fibonacci retracement level in the HUI Index. There was no analogous breakdown to new lows in gold and silver, but what happened in these markets on a relative basis was even more significant.
Let’s move right into the charts, starting with the confirmation of the breakdown in the HUI Index (charts courtesy of http://stockcharts.com).
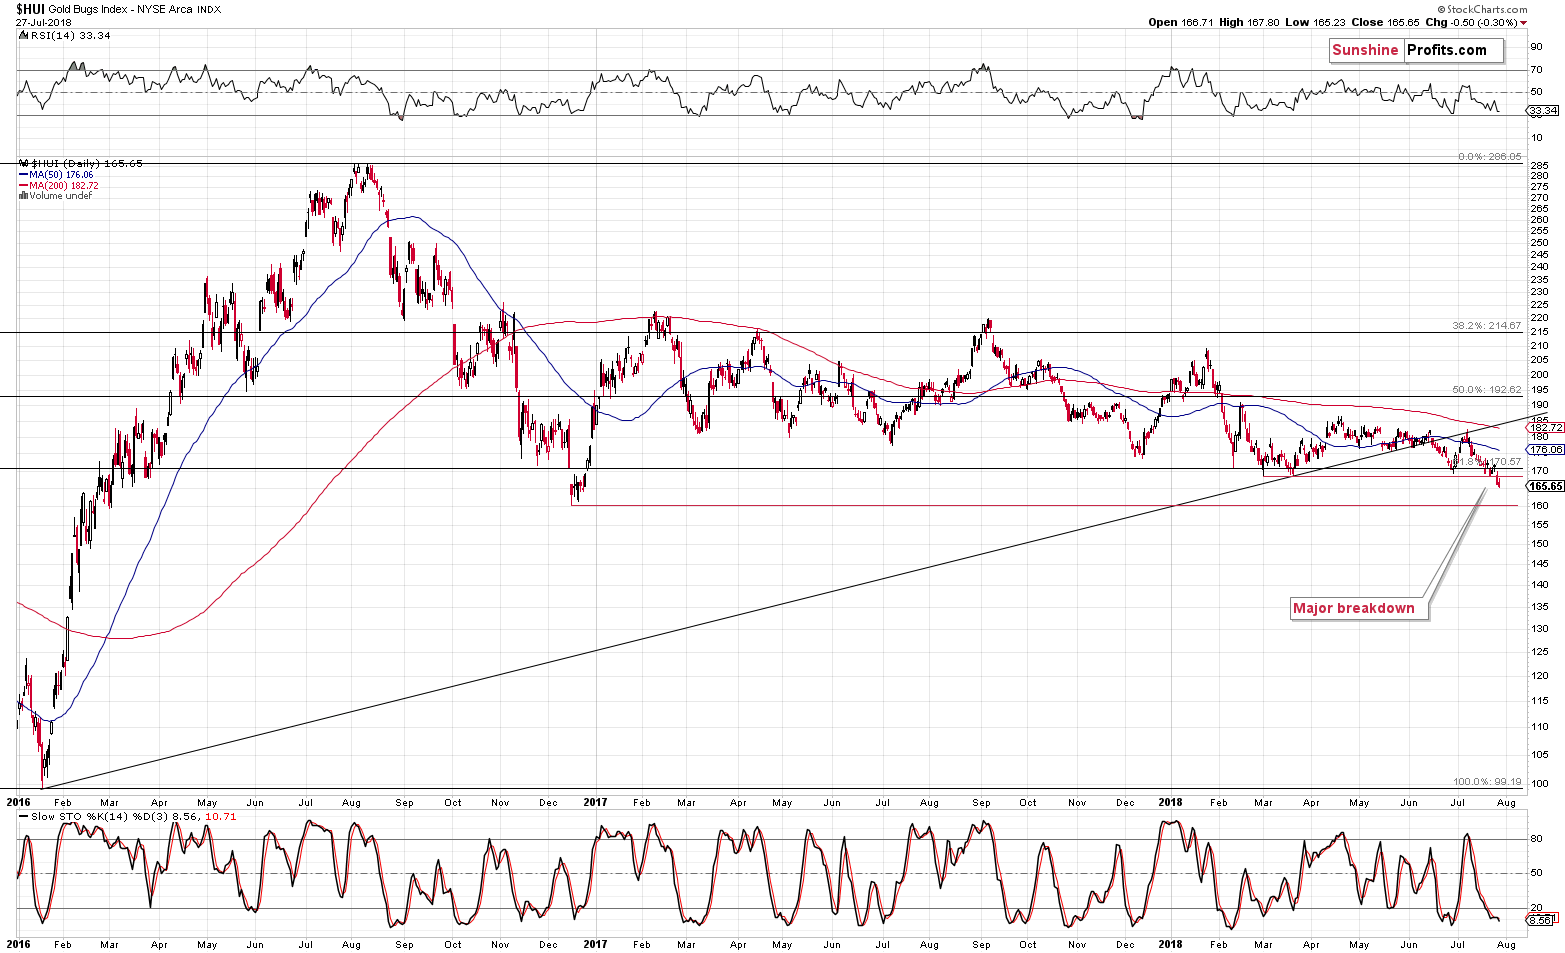
Theoretically, it takes three consecutive trading days to confirm a breakdown, but since weekly closing prices are generally more important than the daily ones, we can say that the move was practically confirmed. This is especially the case since gold actually provided a reason for gold stocks to rally by moving higher in the middle of Friday’s session. Gold miners didn’t perform well even despite that. This tells us that the breakdown was no accident – it shows true weakness and emphasizes that the way in which the precious metals market wants to move in the following weeks is down.
Speaking of the gold stocks’ underperformance, let’s take a look at the relative chart.
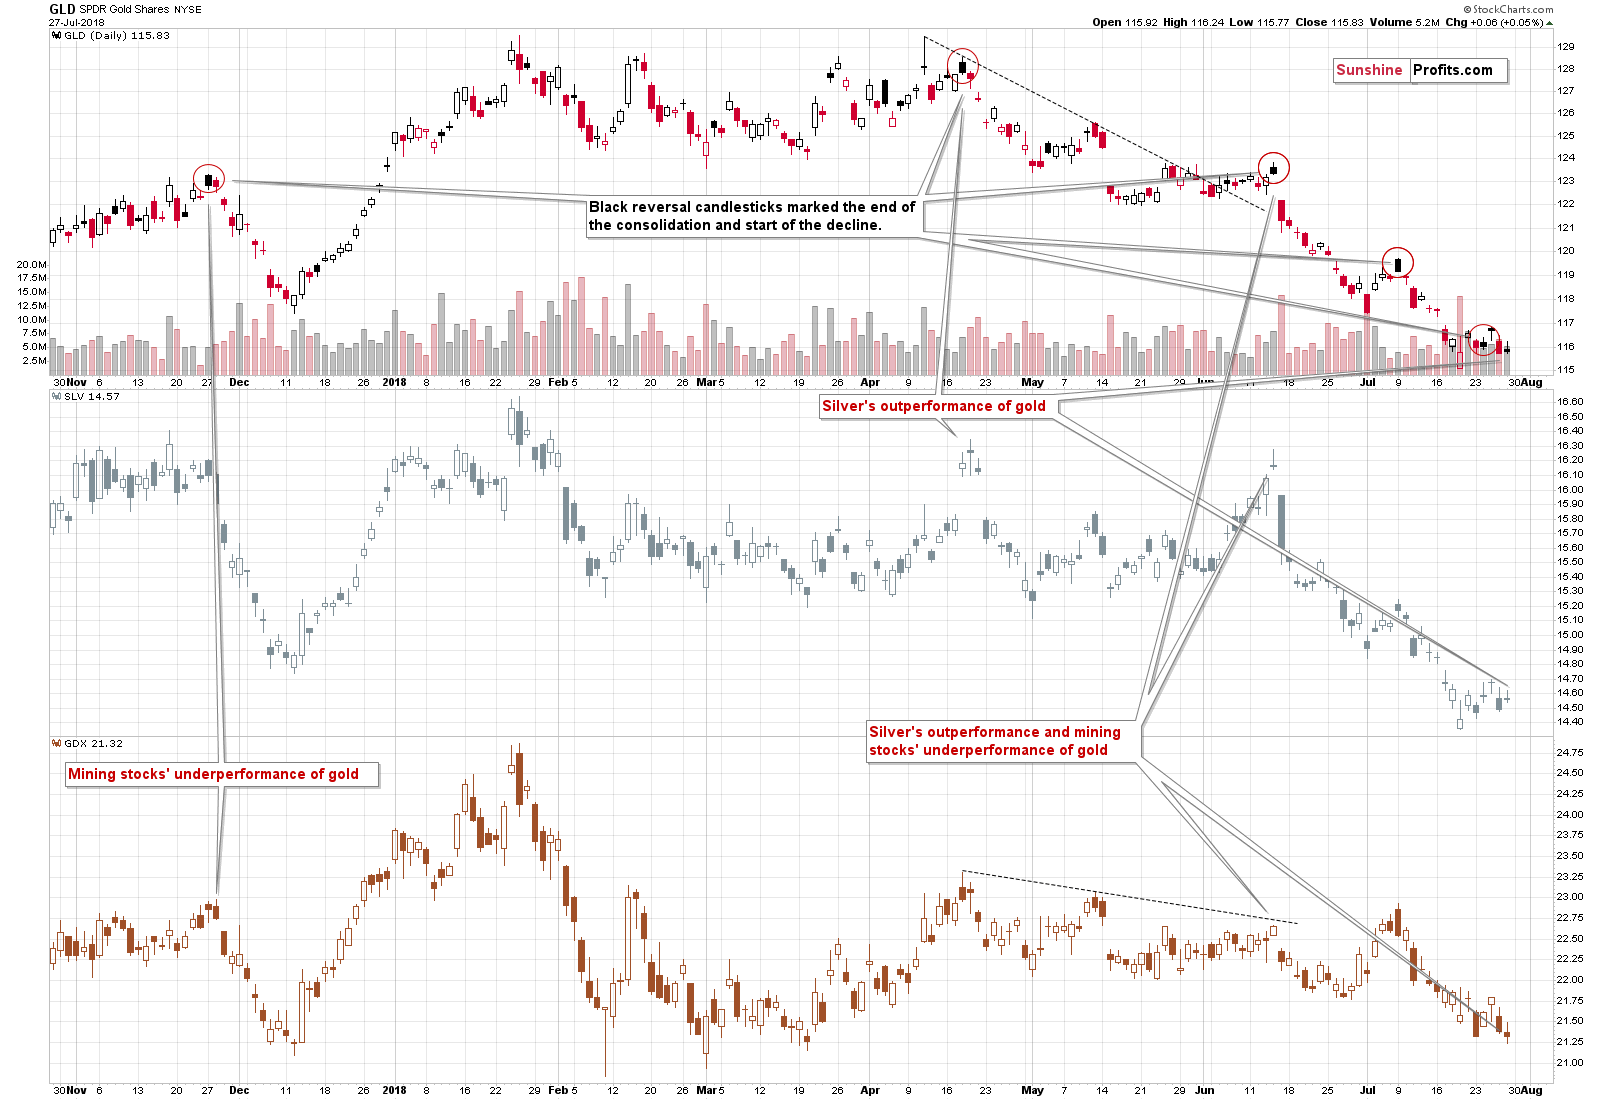
Gold stocks underperformed and silver outperformed gold. This is a classic pre-slide combination that we’ve seen multiple times in the recent and distant past. We marked some of the similar cases on the above chart. The Friday’s price moves were not huge by themselves; but comparing one rally to the other makes the differences significant. GLD moved slightly higher (0.05%), while SLV moved higher more visibly (0.55%) and GDX didn’t rally at all. It declined by 0.33%.
This is simply a bearish combination for the short term – the marked analogies confirm it.
Having said that, we would like to discuss the issue of the current seasonality.
Gold’s Summer Seasonal Patterns
We’re in the middle of the summer and precious metals are after a decline. It’s natural to attribute this to the regular gold summer doldrums phenomenon – the time during the year when not much happens to the price of gold (or it declines) as traders and investors go on vacation. And it is indeed the case sometimes (often enough for the “summer doldrum” phrase to be quite popular), but let’s keep in mind one important thing about it. It’s just a fancy name for seasonality. Giving it an additional name doesn’t make it more important.
The key thing about seasonality (based on our extensive research) is that it’s particularly useful when there is no strong trend or any other strong indications. In other words, seasonality is a gentle force that sets the overall tone for the trading patterns, but is unlikely to overcome other substantial market forces. For instance, seasonality can be compared to average waves on a medium-sized lake and a strong up- or downtrend can be compared to a big wave generated by a speeding motorboat.
For instance, based on the last 30 years or so, gold has – on average – not done anything during April. It was the most boring month of the entire year. And yet, in 2013, we saw a $200+ decline in gold in just a few days – and it happened in April. Why didn’t seasonals prevent this? Because that’s not how they work.
Let’s take a look at the gold stocks’ and gold’s seasonality.
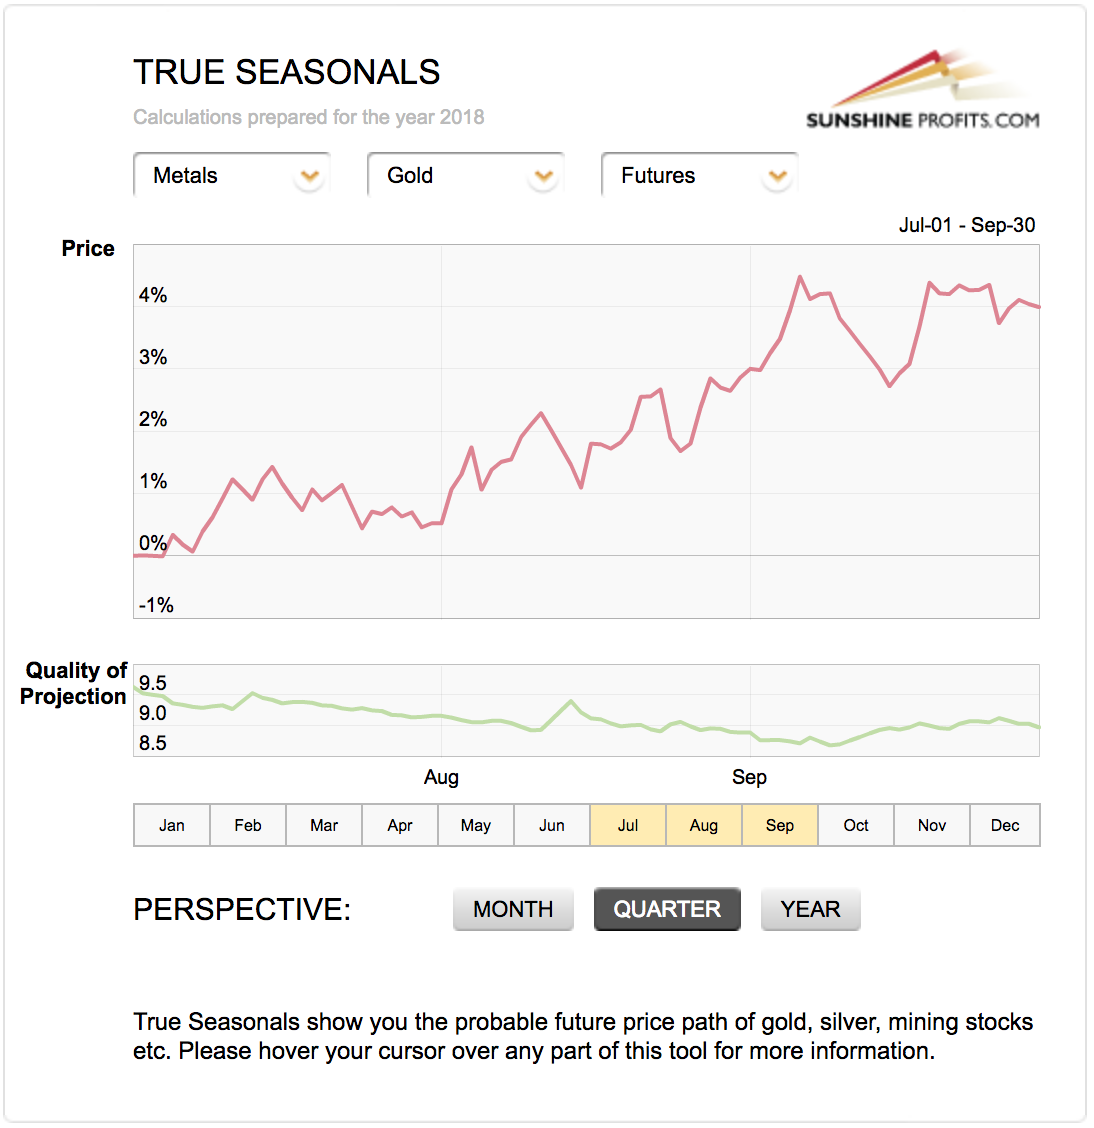
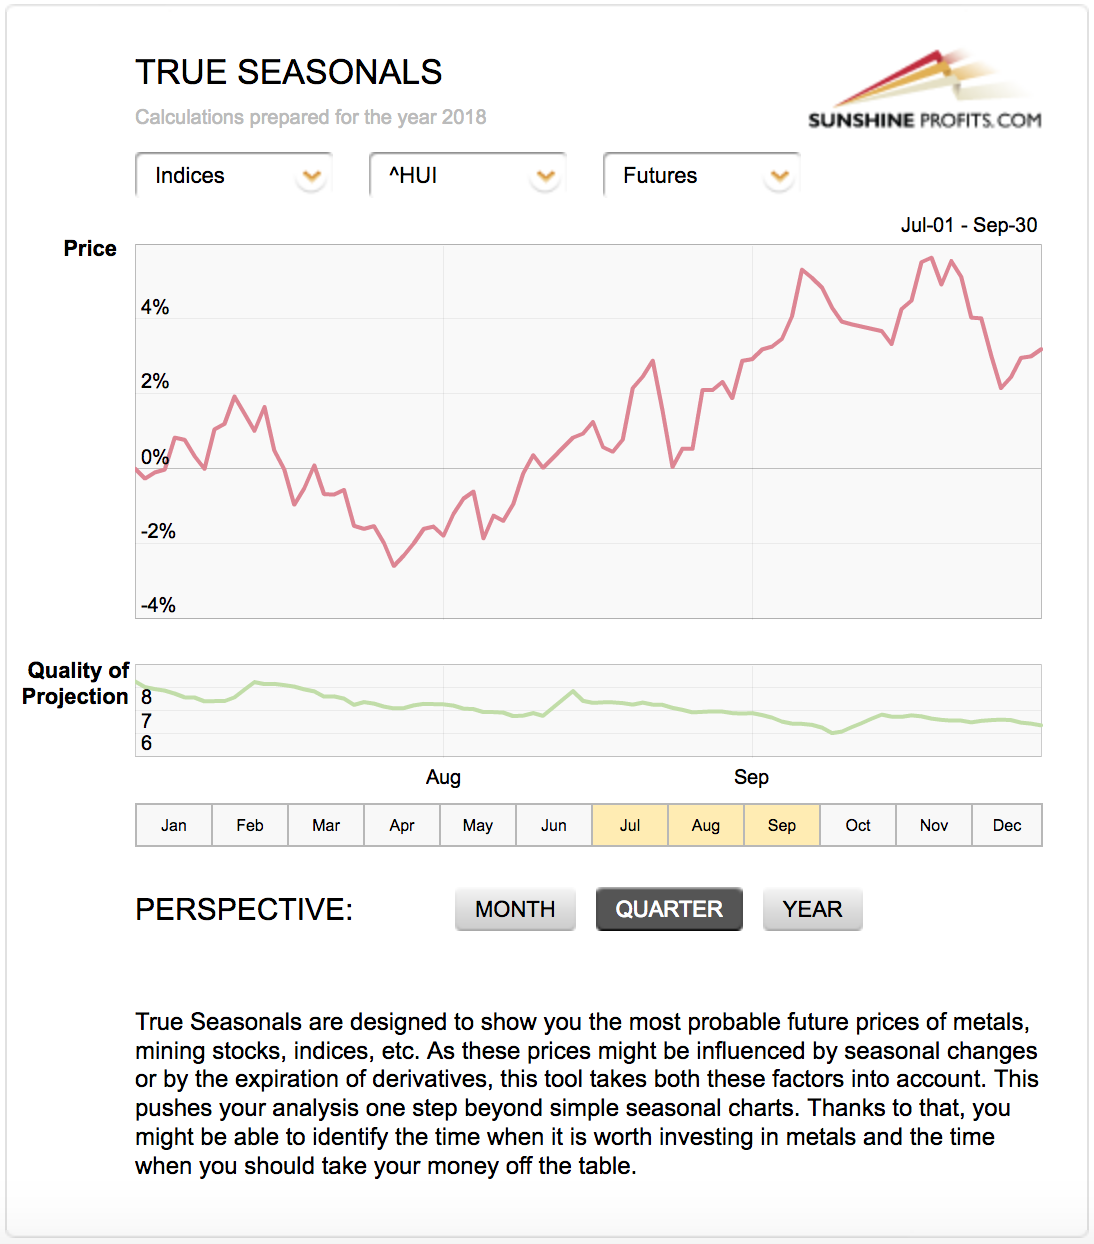
Based on the last several years and including the effect of expiring derivatives, we get a picture in which gold was supposed to do nothing (with an upward bias) and in which gold stocks were supposed to move higher in the first half of July and then to decline for the rest of the month.
Gold miners did exactly that and gold didn’t follow its own pattern, but more or less followed the gold miners’ pattern. The True Seasonality pattern worked to the extent to which it was in tune with other factors and didn’t work when it wasn’t. The overall trend was lower, so both followed it, it didn’t matter that gold’s True Seasonality pointed to overall higher prices.
The gold stocks’ seasonality may seem like the thing that one should focus on, but it’s not that simple. For instance, seasonality would have one believe that the HUI index would rally in February this year, especially in its early part. The HUI declined by about 25 index points and the most volatile part of the move took place in the early part of the month. Seasonality and its upgraded form – True Seasonality – are useful tools (particularly for confirming other signals), but are no crystal balls, especially when other strong factors are in place. We are in such a situation right now, so betting on a rally in gold in the coming weeks, just because the yellow metal is currently in the summer doldrums, is not really justified.
We were also asked to comment on the fact that gold positions indicated by the CoT reports pointed to a bullish outcome in the following weeks. We will not go into the details today, because we already discussed it thoroughly last Wednesday. The long-story-short version is that the data shows that the CoT numbers are reliable only during major upswings and during sideways trading patterns. They are not reliable – and the same goes for the RSI indicator – during big medium-term downswings and in the case of any epic moves. Well, in case of the RSI, we can always use the version based on weekly or monthly prices instead of daily ones, but in the case of the CoT numbers, we don’t have as much versatility. Moreover, when trying to predict major moves (or at least when one doesn’t want to be hurt by them), it’s necessary to look at the market from a broad perspective, not only from the medium- and short-term ones and the current signal that we have from the CoT is of a short-term nature (more details are available in the mentioned July 25th analysis).
Consequently, if there are good reasons to believe that the precious metals market is in a major decline or in a very big move in general (and there are many of reasons for both right now), it doesn’t seem prudent to attribute too much significance to the CoT report’s readings.
Platinum’s Breakdown Update
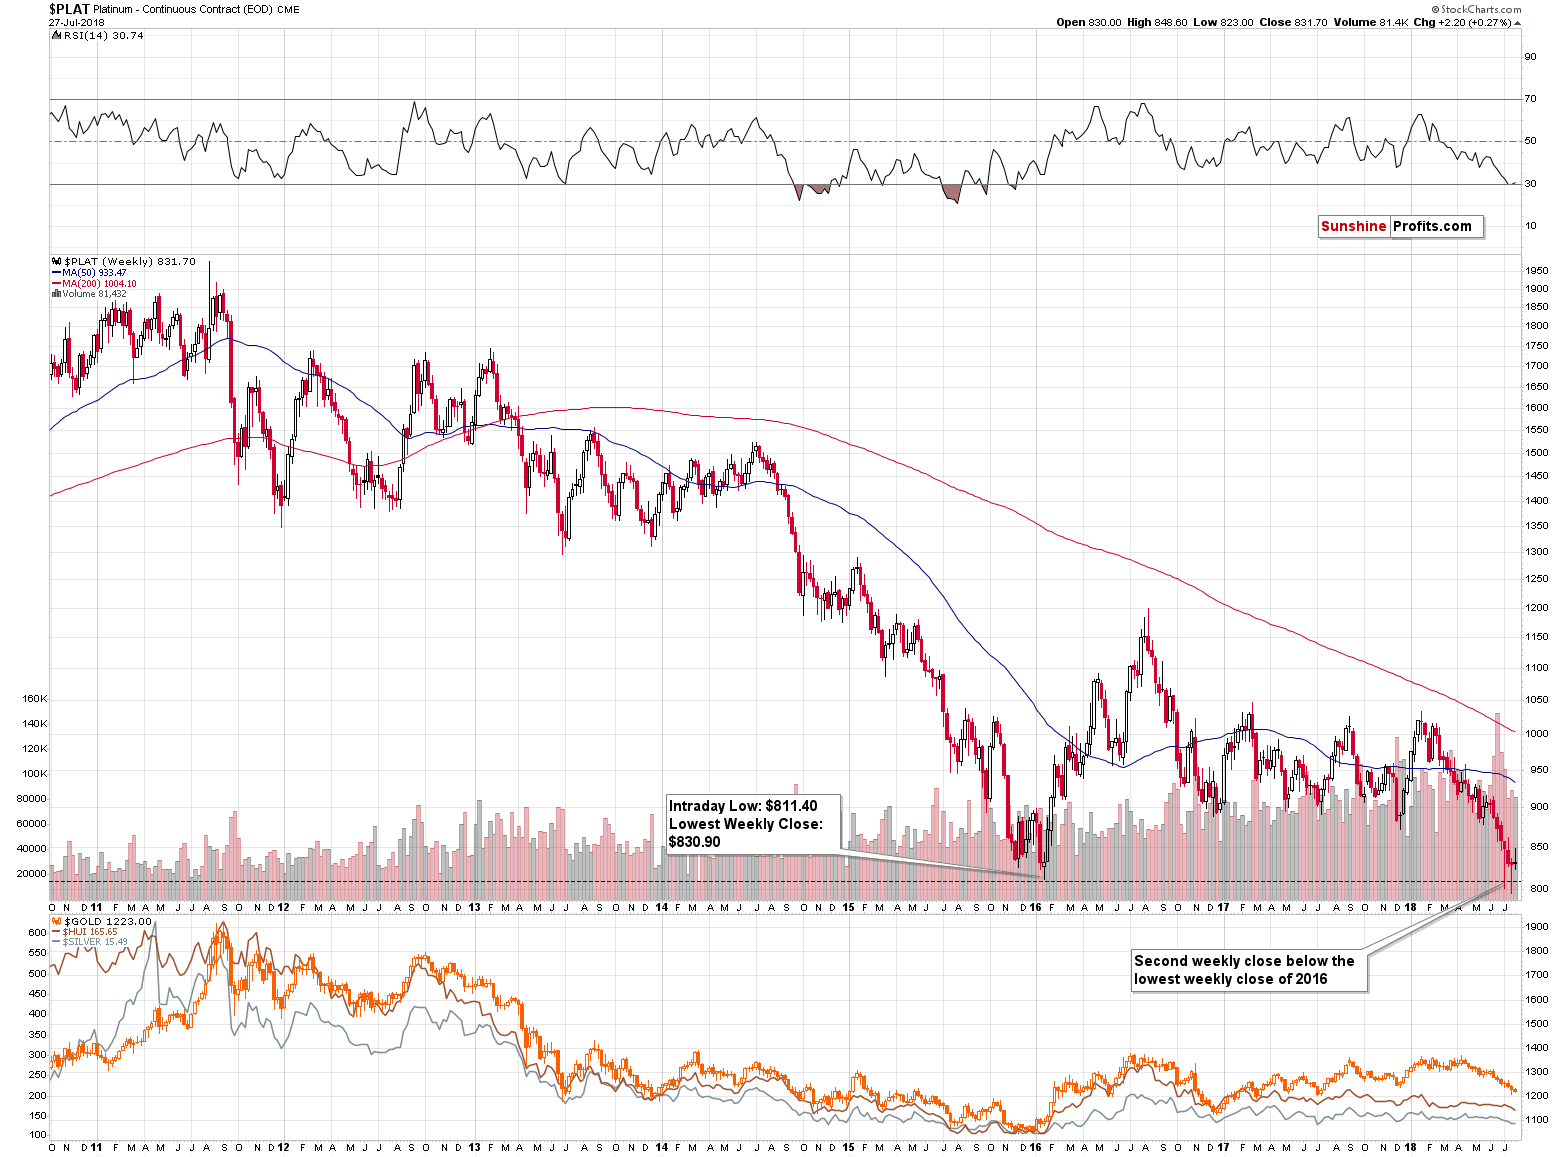
In the previous two weeks we saw platinum close below the lowest closing price of 2016 and we wrote that the breakdown below them was almost confirmed. The previous week ended a bit above the 2016 low, so technically the breakdown was invalidated. But, we don’t really view it as invalidated. We don’t view it as confirmed either. The reason is that instead of a powerful rally, we saw a “rally” by just $2.20, which is next to nothing. Last week’s closing price and it’s position relative to the critical support seems more unclear than anything else. Consequently, we view this as a “jury is still out” situation.
This week is likely to provide us with a decisive move in either direction and the implications are likely to indicate the direction in which platinum will move in the next few weeks, likely taking the rest of the PM sector with it. At the moment of writing these words, the price of platinum is down by $2, while gold is basically flat and silver is up by $0.03. There is a very tiny bearish indication and we should wait for a more significant one before saying that the implications of the above chart are strongly bullish or bearish. At this time, we continue to view them as bearish based on the previous 2 weeks, but not strongly bearish. Consequently, platinum investment doesn’t seem to be really justified, but the outlook for this metal alone, based on the above chart is not yet extremely bad.
Summary
Summing up, the outlook for the precious metals sector is extremely bearish and based on the gold stock’s breakdown and Friday’s relative performance of gold, silver and mining stocks, it seems that we will not have to wait too long before the next big downswing starts.
The market is providing us with hints, but only a few investors are willing to listen. This is an opportunity of a decade (to profit on the upcoming slide and then to buy aggressively close to the final bottom) but most investors are either uninterested in the precious metals market at all (who can blame them after a several-year-long sideways trading pattern?) or are insisting on viewing everything as bullish regardless of what the facts are. Such investors confirm that “a man convinced against his will, is of the same opinion still”.
We hope that your profits increase in the coming weeks and months instead of being damaged by the upcoming price slide. If you’d like to have our assistance in that process, we invite you to join our subscribers, who have already made sizable gains on this decline. The full version of the analysis, on which the above is based includes our updated trading strategy along with clear profit-take price levels. As our subscriber, you’ll get immediate access to them.
 Details available to Subscribers only.
Click here to subscribe.
Please note that the above is based on the data that was available when this essay was published, and we might change our views on the market in the following weeks. If you’d like to stay updated on our thoughts on the precious metals market please join our subscribers today..
Thank you.
Sincerely,
Przemyslaw Radomski, CFA
Founder, Editor-in-chief, Gold & Silver Fund Manager
Gold & Silver Trading Alerts
Forex Trading Alerts
Oil Investment Updates
Oil Trading Alerts
