

Quickly after the volatile plunge, gold reversed and it's moving higher in today's pre-market trading. The $64,000 question is whether this is a correction within the decline, or did the huge rally just resume after a pullback. Which proposition will reassert itself?
In short, the former is much more likely. The decline seems to have only begun.
Let's take a look at the charts for details, starting with the big picture. On Monday we wrote the following about gold's long-term charts:
Zeroing in on Gold
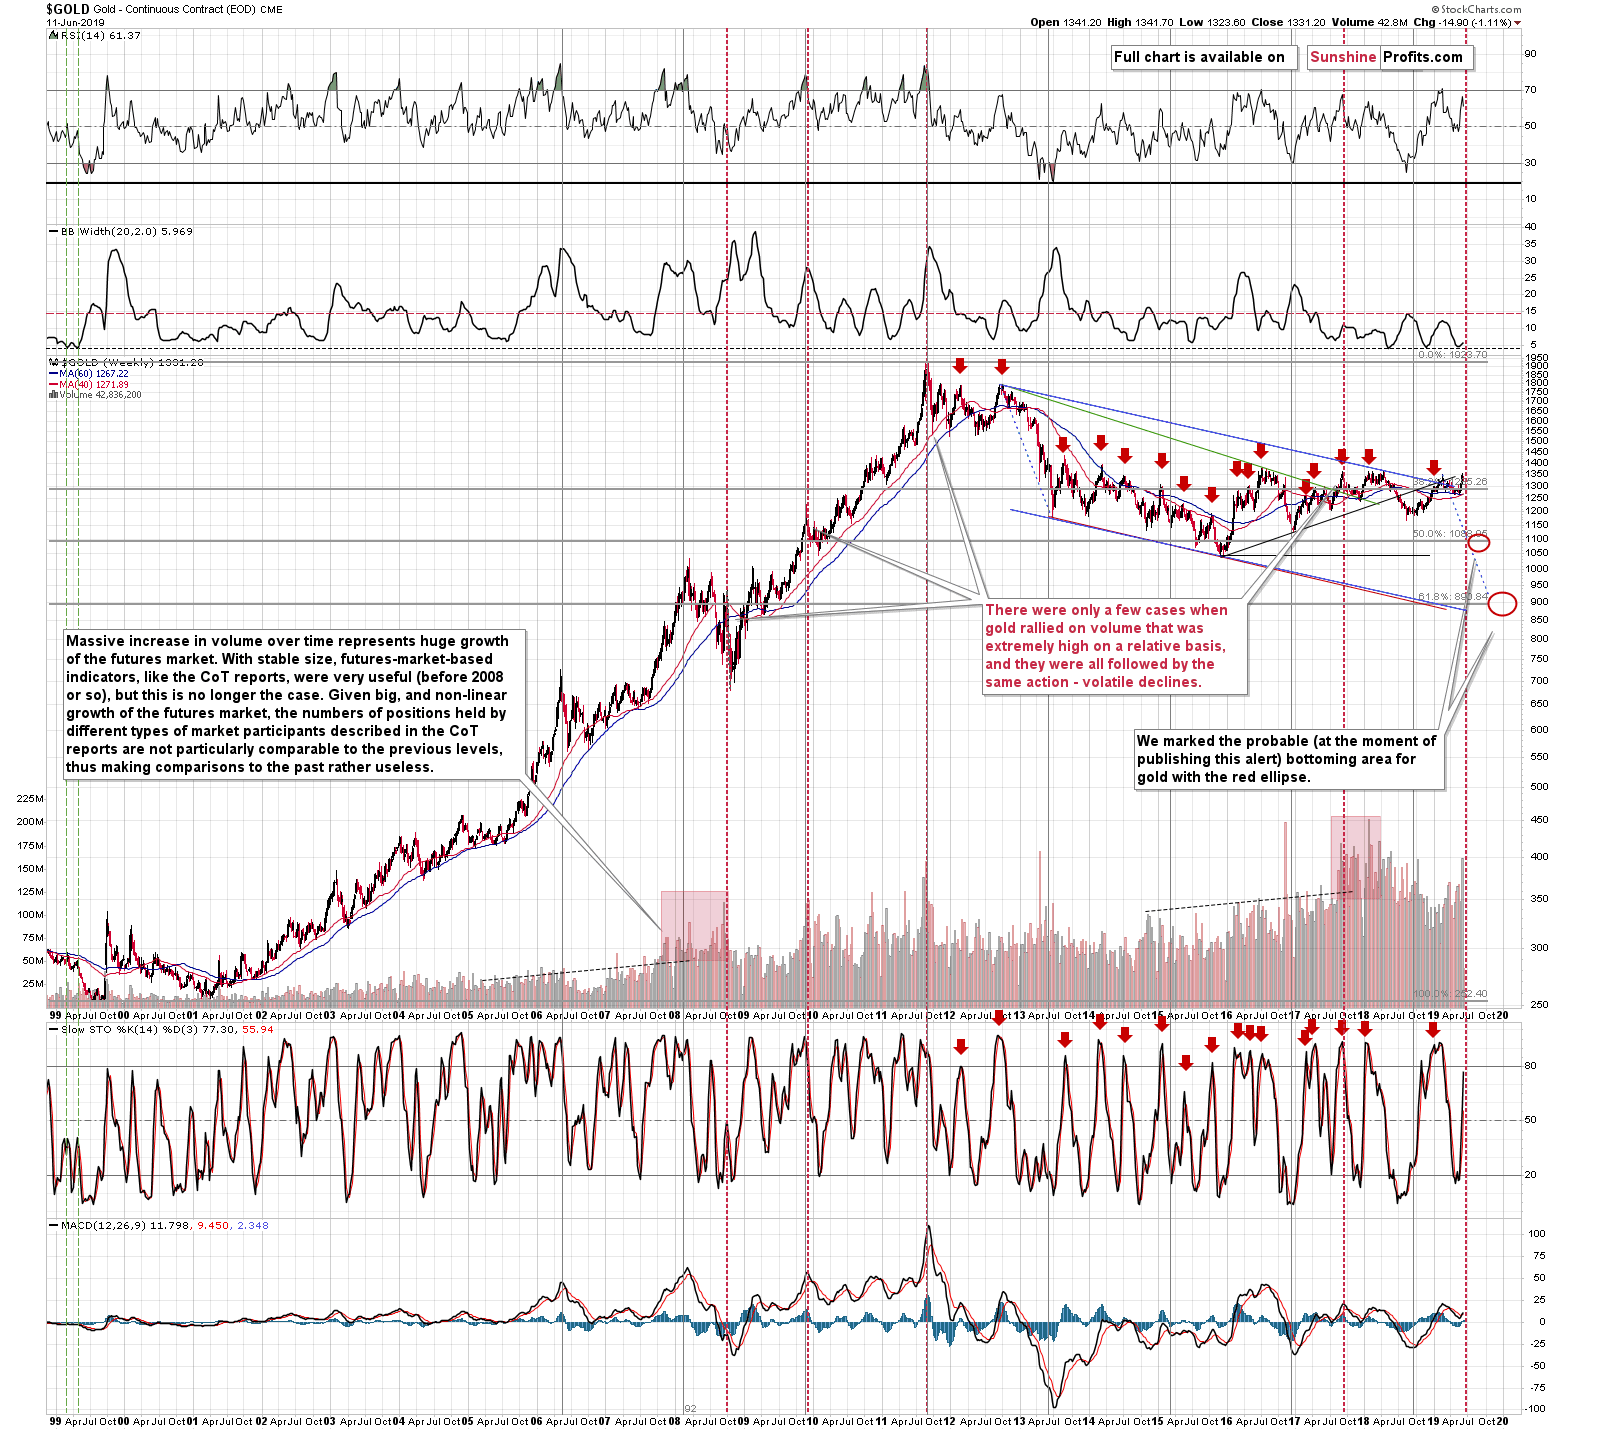
It is rare when gold rallies on extremely huge volume during the week and it is extremely rare when this happens after weeks during which the volume was relatively low. The relativity requirement is more important than it appears at the first sight. The futures market grows in general and the volume increases - this is the case in most futures markets, not only in case of gold futures that the above chart represents. So, by looking at absolute volume levels only, we would not know if what we see is really an anomaly or a normal consequence of the above-mentioned trend. This process is rather gradual, so if we see rapid increases in volume, not slow ones, it suggests that something extraordinary has happened. That's what makes volume spikes so important.
The volume spikes represent different situations when we see them during gold's declines and when we see them during gold's rallies. It's rather obvious why it's best to compare apples to apples, so it's no surprise that in order to check what happened in cases that are similar to the current ones, it's best to focus on the huge-volume weekly rallies.
We marked these similar cases with red vertical lines. There were four cases that were very similar when looking at gold from the broad perspective. There was one more in the more recent past that is clearer once we zoom in. The four above-mentioned cases are:
- the late 2008 top that was almost immediately followed by a huge decline
- the late 2009 top that was followed by a notable decline that took a few months
- the 2011 top - no comment is necessary here
- the mid-2017 top - one of the most important tops of the recent years that was followed by several-month-long decline
Since all similar cases point to the same outcome, the implications are obvious. History tends to rhyme, so gold is likely to slide in the following months, not to mention weeks.
Speaking of weekly declines, let's zoom in a bit, and quote what we previously wrote about the chart below:
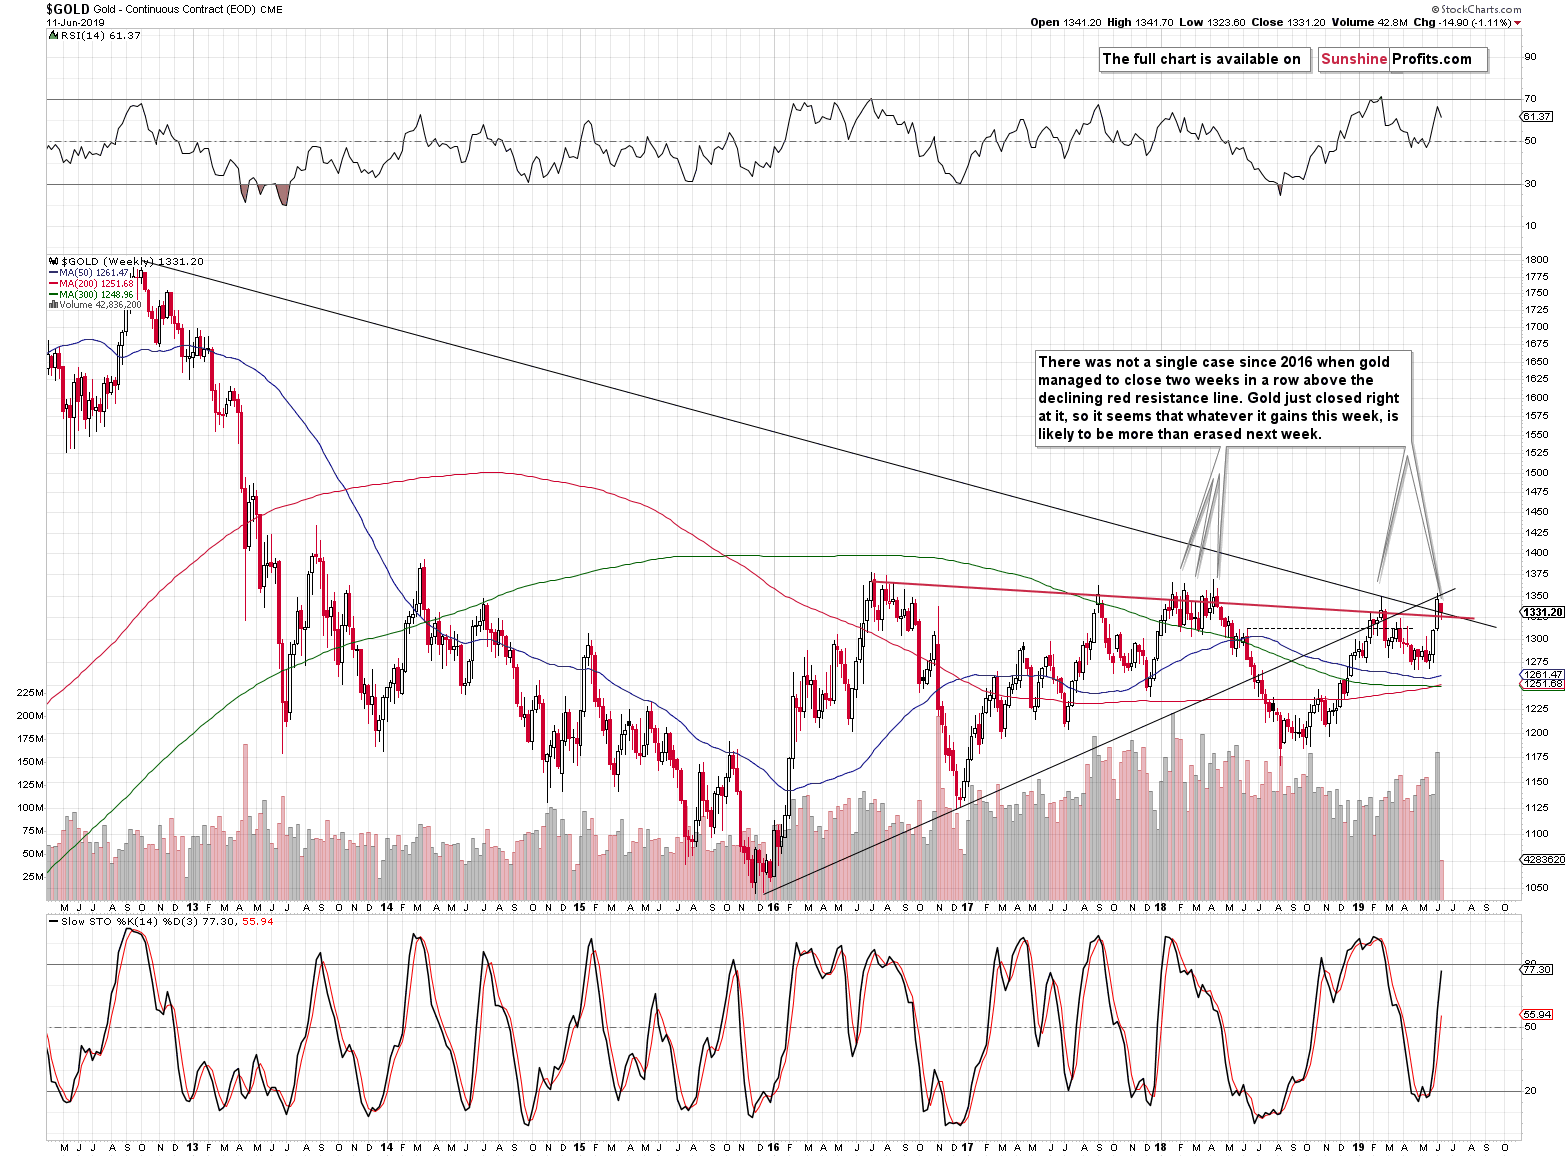
Gold is approaching its long-term resistance created by the previous highs. There is one very interesting rule regarding this resistance. No matter how volatile or promising the rally above the red resistance line was, it was always (in the last couple of years) invalidated in the following week. Given today's pre-market rally in gold, it seems that we might see a weekly close above it. This means that the next week would quite likely include the invalidation of the current breakout and the beginning of another slide lower.
The above remains up-to-date. Since the previous week has indeed resulted in gold's close above the declining red resistance line, we are now likely to see breakout invalidation.
Just a few paragraphs above, we wrote about another huge-volume spike that would be visible on the next chart. It's the January 2018 spike. Its volume was higher than that of the mid-2017 spike, but overall the former seems more significant on a relative basis. Anyway, the January 2018 spike... Resulted in declines anyway. Not right away, but this was the end of the rally, so the bearish implications thereof remain intact.
Gold declined almost immediately after we published the above, but the key point is whether the current decline is similar to any of the analogous past situations in terms of its size. Absolutely not. The declines that followed the action that was most similar to what we saw last week, were much bigger (tens to hundreds dollars bigger) than what we have seen so far this week.
And we still have full three sessions before the week ends, so it's still likely that gold will move back below the red support / resistance line from the second chart.
The big-picture analogy is not the only thing that suggests that yesterday's reversal and today's pre-market move higher are not bullish. We can say the same thing based on the way gold previously declined from about $1,350. This is the kind of insight exploring self-similarity yields. It's at its most powerful when joined by other gold price prediction techniques.
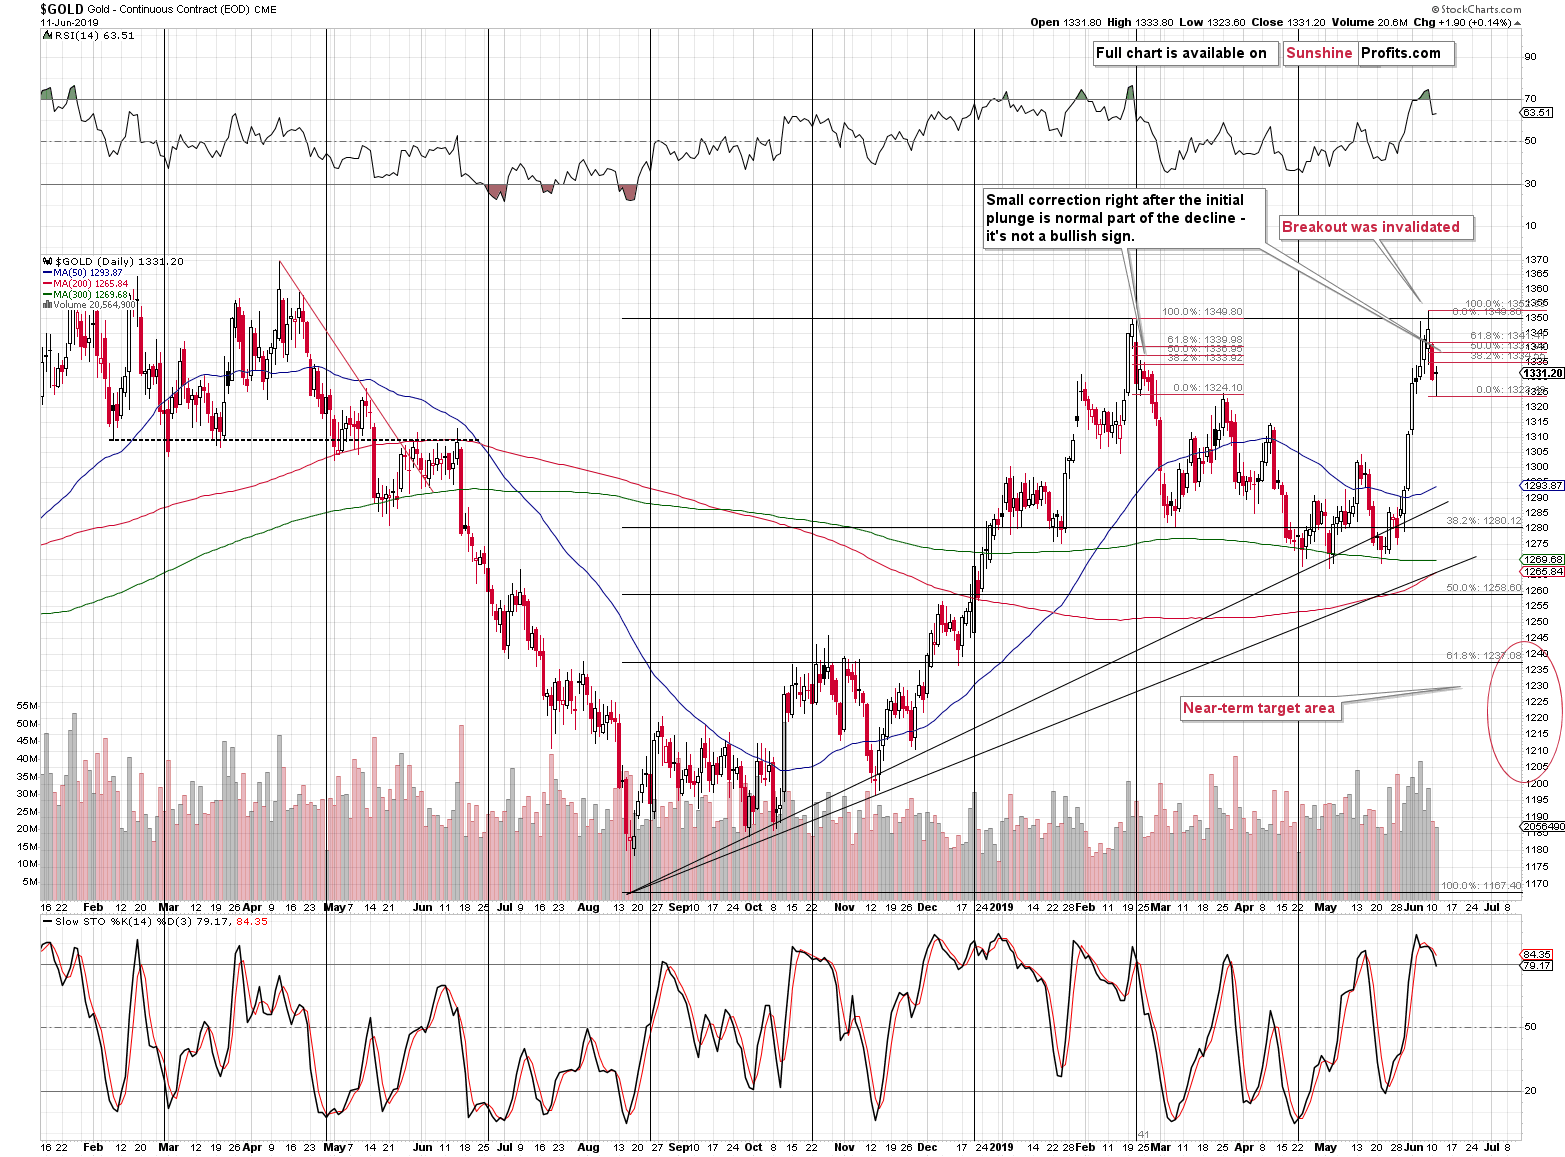
In late February, gold corrected almost half of the initial decline before moving much lower. If the history was to repeat itself to the letter, we could see gold move to a bit below $1,340. But, a move to the 61.8% Fibonacci retracement would still not change much - technically, unless gold breaks above it, the correction will be relatively normal.
Of course, we can't rule out a situation in which gold makes a double, or even a triple top as it did in April 2018, but based on the long-term volume analogy, it's likely to slide in the upcoming weeks anyway.
Turning to Silver and Mining Stocks
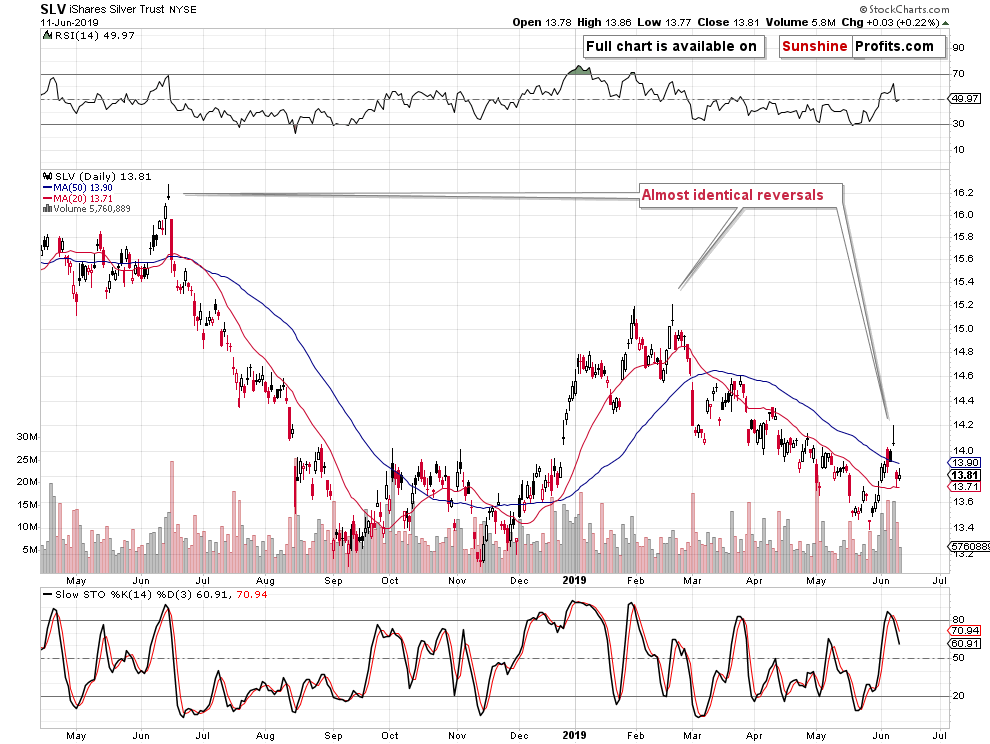
Right before Monday's plunge, we warned about the extremely bearish implications of the gravestone doji reversal candlestick. Unlike yesterday's supposedly bullish reversal in gold, Monday's reversal in the SLV ETF took place on huge volume. Yesterday's volume in gold was weak, which suggests that even today's pre-market upswing is likely to be a fake move.
Now, what else can we glean from the above? It can tell us a pause right now is quite normal, and that shorting the precious metals market on Friday most likely meant shorting it right at its top. In late February, we have seen a corrective upswing both in gold and in silver. Both happened after the SLV ETF reached its 20-day moving average. And what happened next? Silver paused for a couple of days, moving a bit higher and then the real plunge happened. This downswing erased the entire previous rally and then some in just a few days.
The other similar situation - from June 2018 - was followed by less sharp, but ultimately bigger decline. Unsurprisingly, there was also a few-day long pause in silver in late June 2018. It was nothing more than a pause within the decline and the same seems likely for the current small upswing.
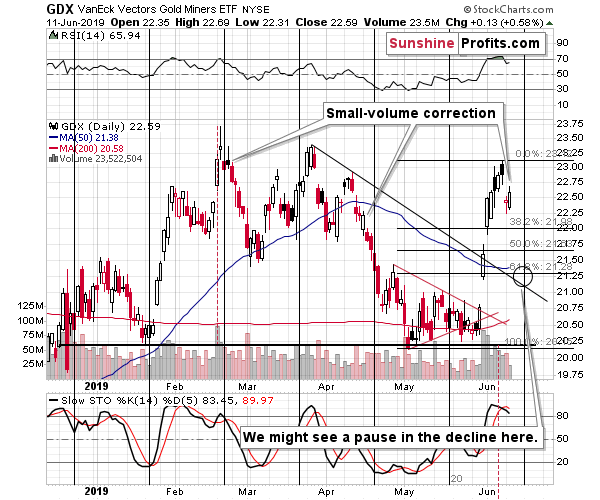
The volume on which mining stocks moved higher yesterday was relatively low, which suggests that this is not the true direction in which the miners want to move. Given today's pre-market upswing in gold, we shouldn't be surprised if miners move back close to their recent June high, but we shouldn't expect more than that.
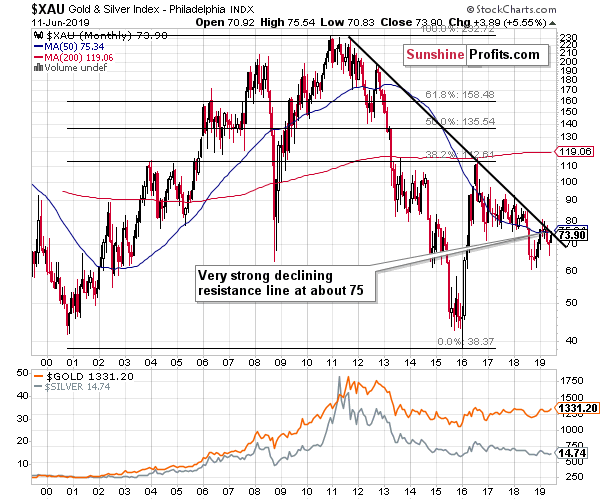
The very strong long-term declining resistance line kept the XAU Index - another proxy for gold stocks and silver stocks - kept the rally in check last week and it seems that the same will be the case this time. This line is based on four major tops and it worked earlier this year as well. It was broken, but very temporarily and sharp declines followed shortly. If we don't see powerful declines right away, then the above is the likely follow-up action. The outlook will most likely remain bearish for the following weeks anyway.
Haphazard Betting on the USD Breaking Down?
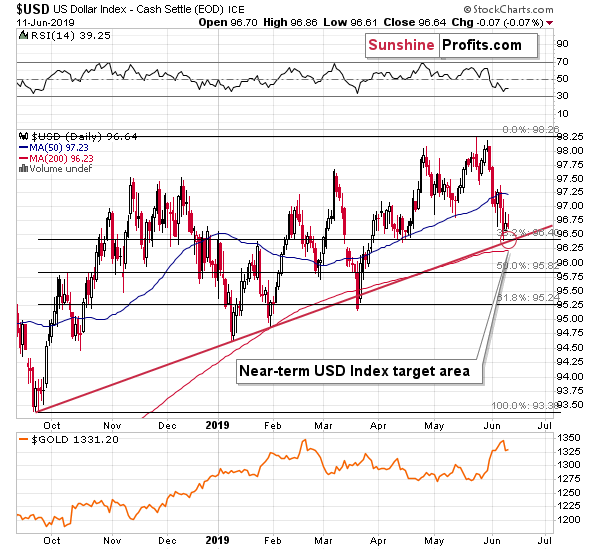
In today's pre-market trading, the USD Index moved a bit lower - only 0.12 above Friday's low. This move may be responsible for the pre-market upswing in gold. Gold declined after USD Index failed to break below the rising red support line. And now the USD Index moved very close to it, so traders probably assumed that the USDX might break down below it after all and thus that gold could rally - and they bought without waiting for the latter to materialize first.
But the reality is that the line remains unbroken and since it was able to withstand even the extraordinarily bad employment numbers on Friday, it's likely to hold also this time. Consequently, we're likely to see higher values of the US dollar in the following days and weeks and the implications for the precious metals market remain bearish.
Summary
Summing up, it seems that we have just seen a major top in the precious metals market. We had a series of factors that were positive for the precious metals market and negative for the USD Index, but it seems that what could have happened based on them, has already happened. Based on the resistance levels that were reached, and relative performance of gold, silver, and mining stocks, we are very likely to see lower prices this week and in the weeks ahead. Gold and silver moved higher in today's pre-market trading but this is more or less in tune with how gold and silver performed right after gold topped at almost the same price levels in February. Consequently, it seems normal, not bullish.
Today's article is a small sample of what our subscribers enjoy on a daily basis. To keep informed of both the market changes and our trading position changes exactly when they happen, we invite you to subscribe to our Gold & Silver Trading Alerts today.
Thank you.
Przemyslaw Radomski, CFA
Editor-in-chief, Gold & Silver Fund Manager
Sunshine Profits - Effective Investments through Diligence and Care
