

Although EUR/USD broke above the upper line of the declining trend channel yesterday, we didn’t notice currency bulls’ strength earlier today. Is this calm before the storm or rather the first sign of their weakness?
In our opinion the following forex trading positions are justified - summary:
- EUR/USD: short (a stop-loss order at 1.2250; the initial downside target at 1.1510)
- GBP/USD: short (a stop-loss order at 1.3773; the next downside target at 1.3000)
- USD/JPY: none
- USD/CAD: none
- USD/CHF: none
- AUD/USD: long (a stop-loss order at 0.7410; the initial upside target at 0.7725)
EUR/USD
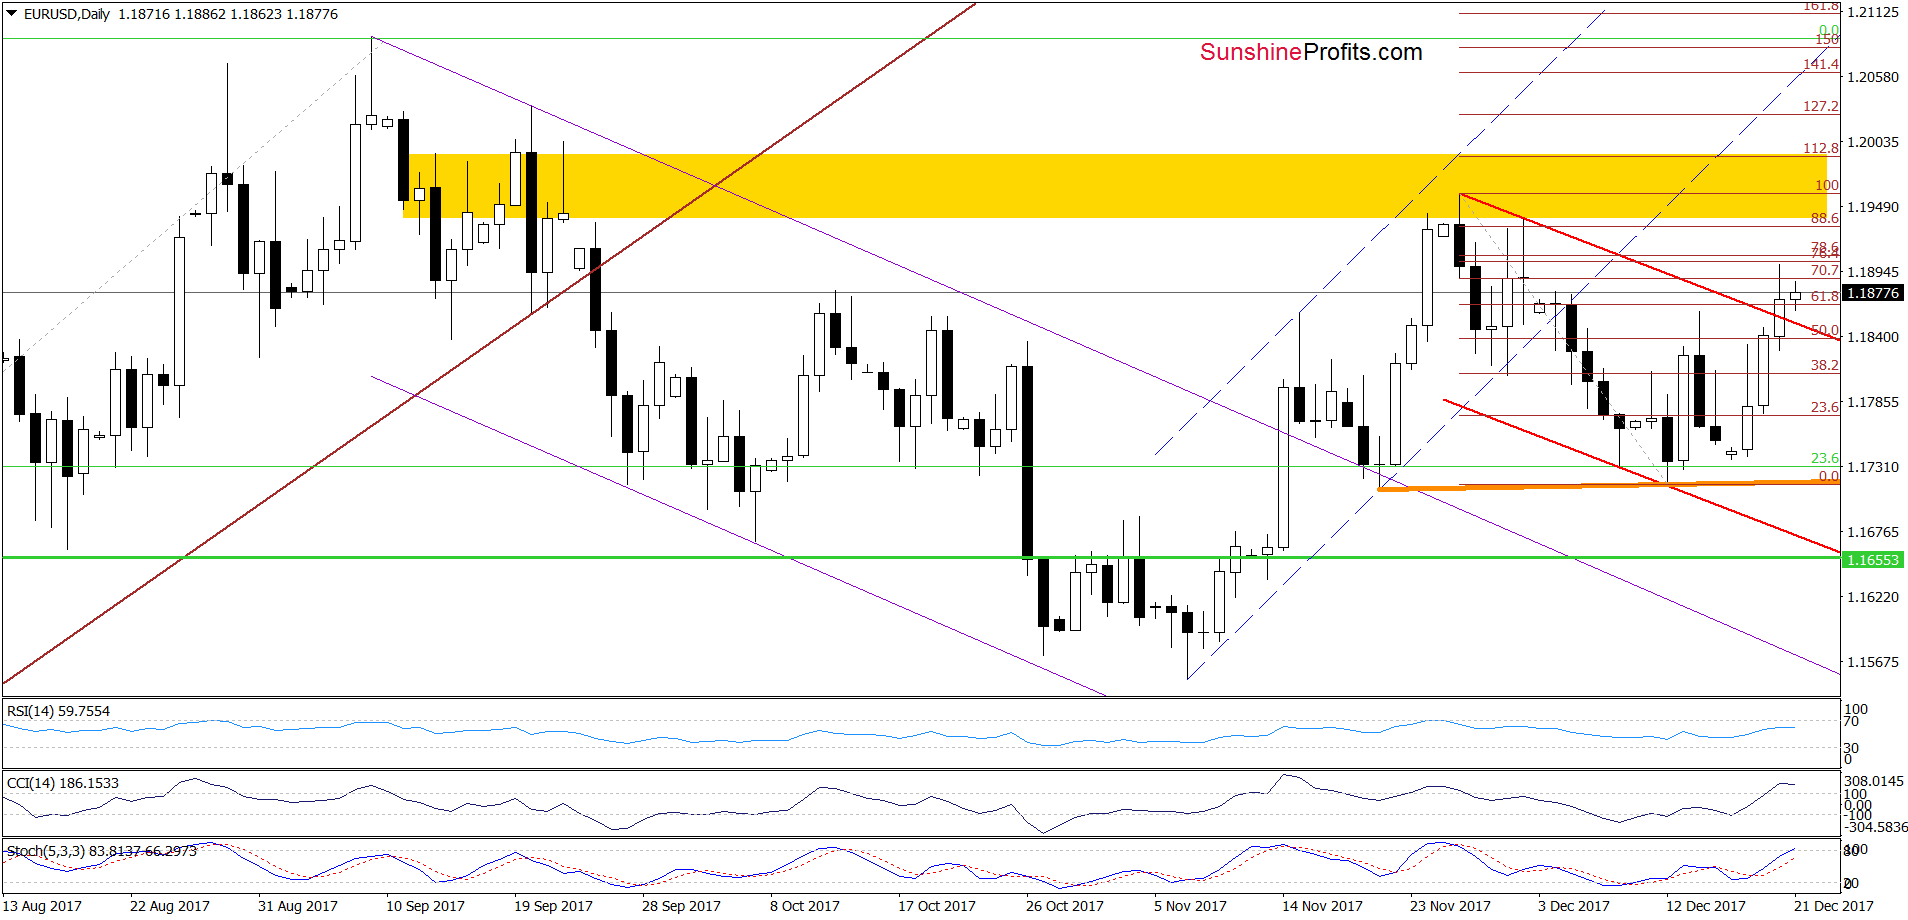
Looking at the daily chart, we see that although EUR/USD broke above the upper border of the red declining trend channel, the combination of the 76.4% and 78.6% Fibonacci retracements (based on the entire recent downward move) stopped currency bulls, triggering a pullback. Earlier today, the exchange rate wavers between this resistance area and the previously-broken upper line of the declining trend channel, but considering the current position of the daily indicators, we think that another move to the downside is just around the corner.
If this is the case we’ll see a test of the upper red line or even an attempt to invalidate yesterday's breakout. This scenario is also reinforced by the broader picture of the pair.
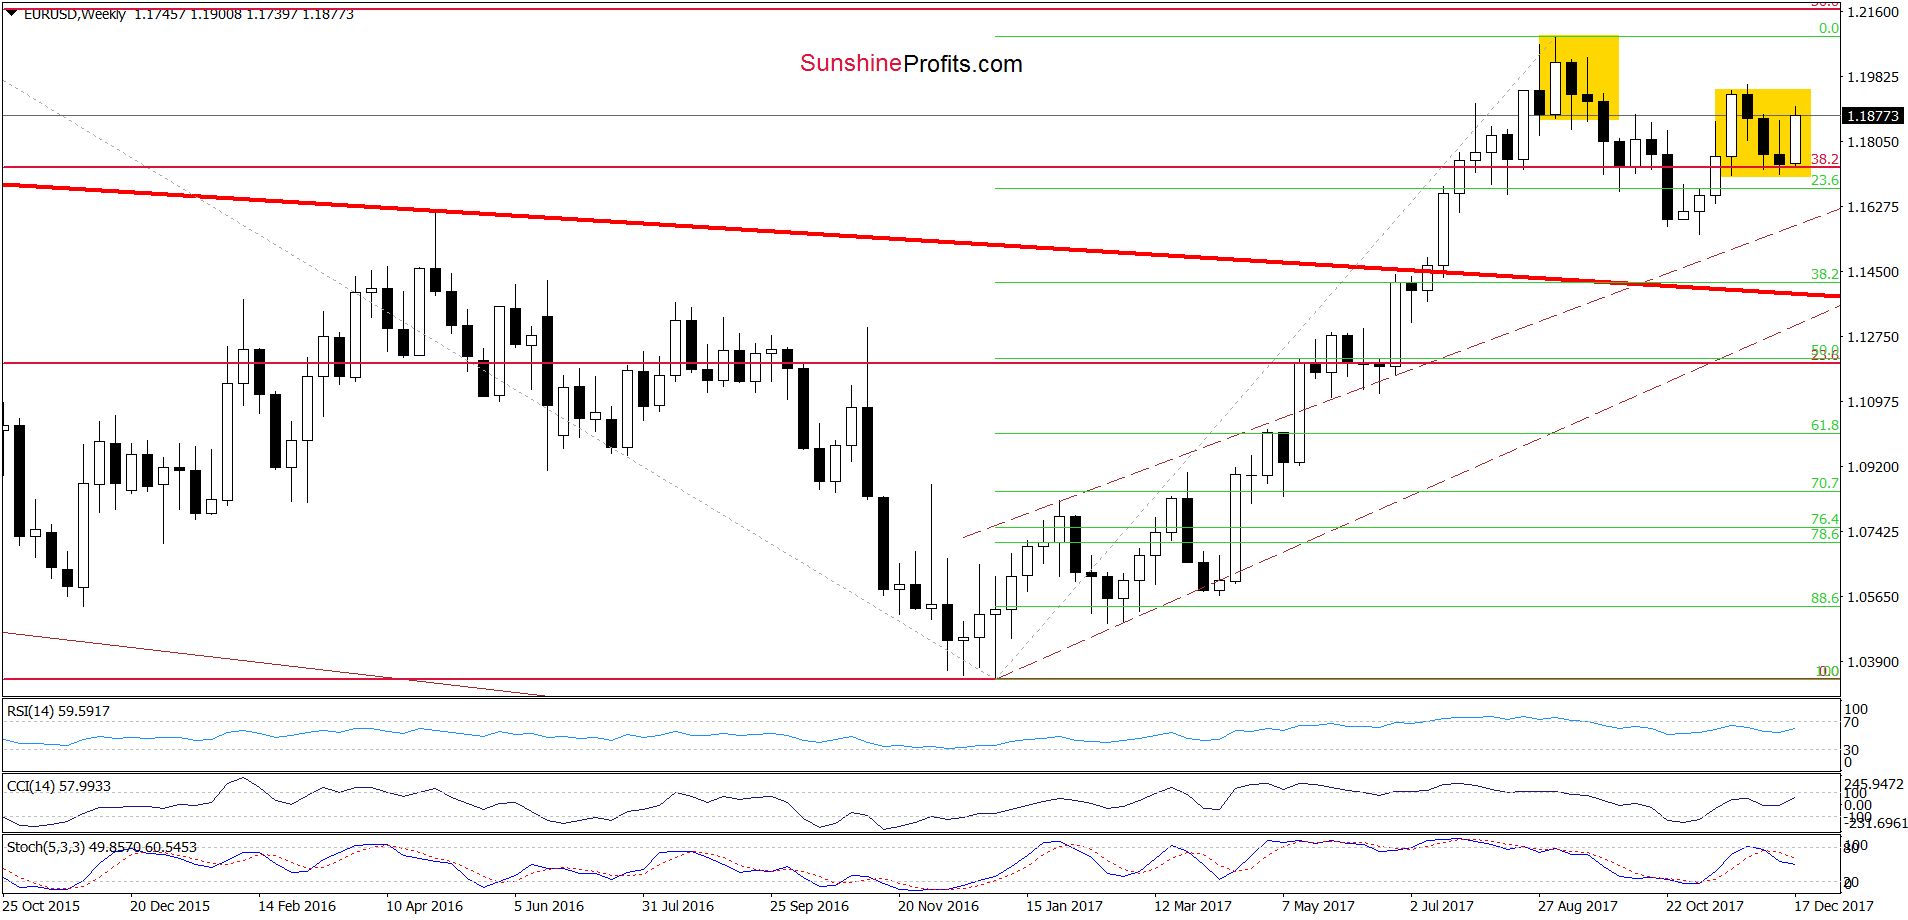
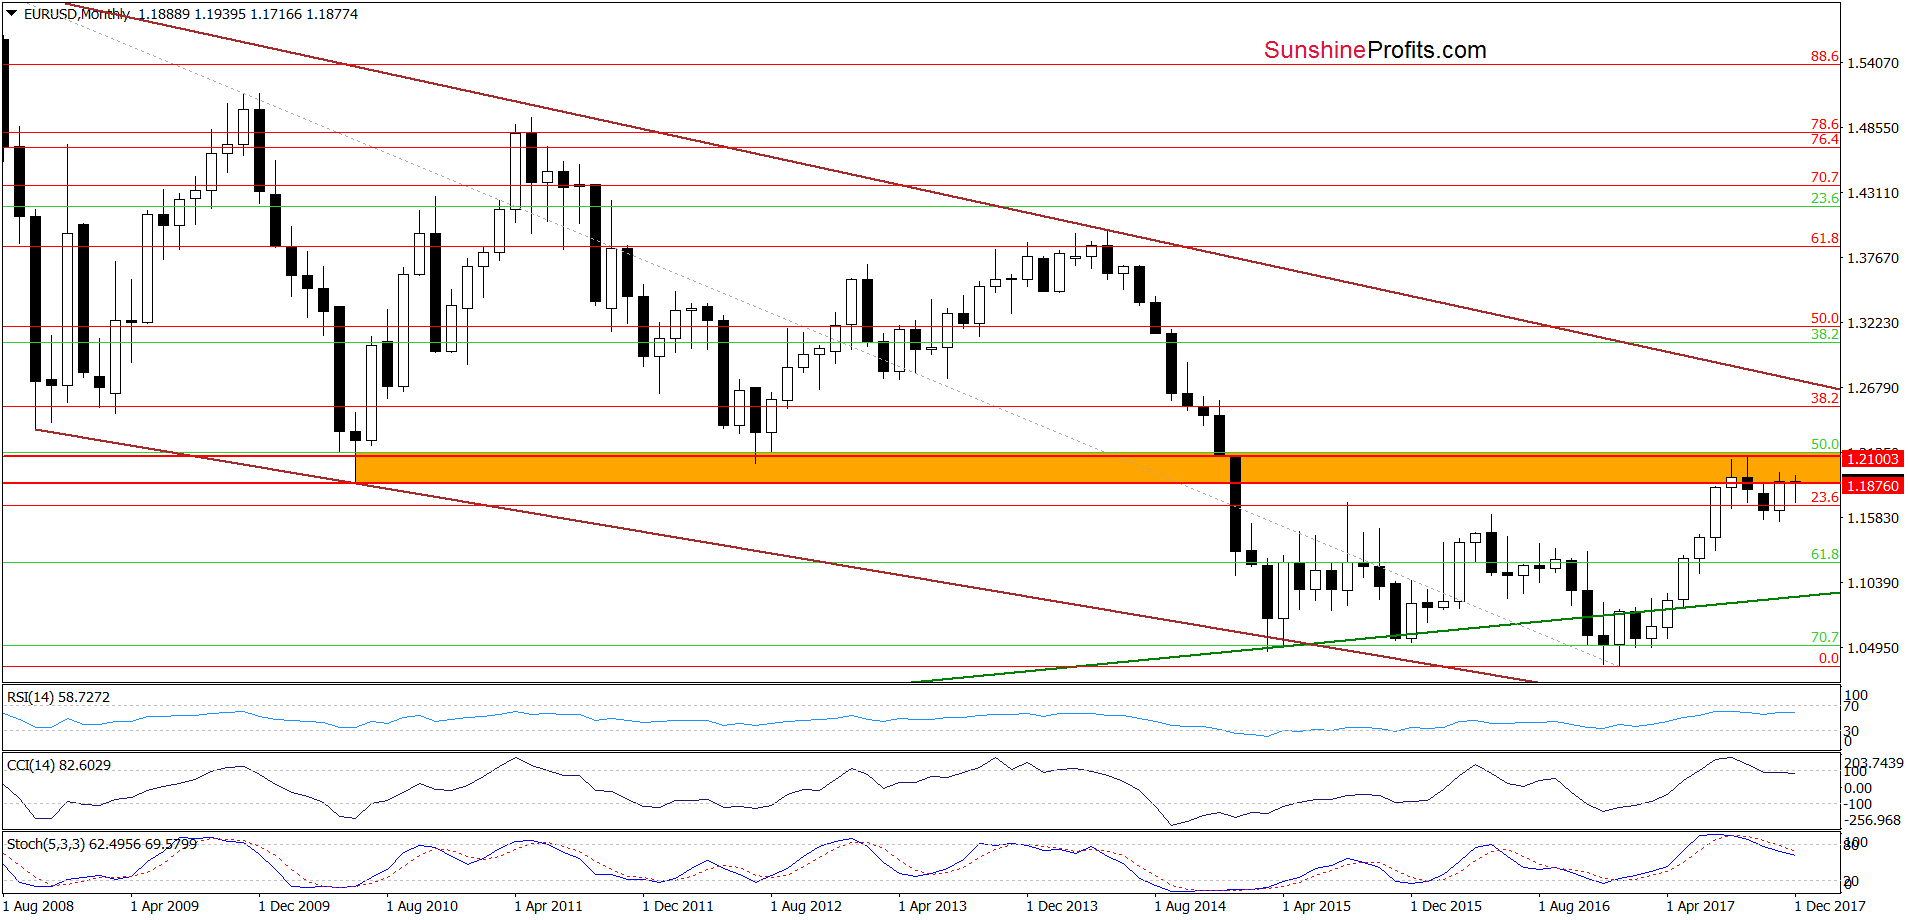
Looking at the weekly and monthly charts, we see that the sell signals generated by the indicators remain in cards, supporting currency bears and lower values of the exchange rate in the following weeks.
Trading position (short-term; our opinion): short positions (with a stop-loss order at 1.2250 and the initial downside target at 1.1510) continue to be justified from the risk/reward perspective. We will keep you informed should anything change, or should we see a confirmation/invalidation of the above.
USD/CAD
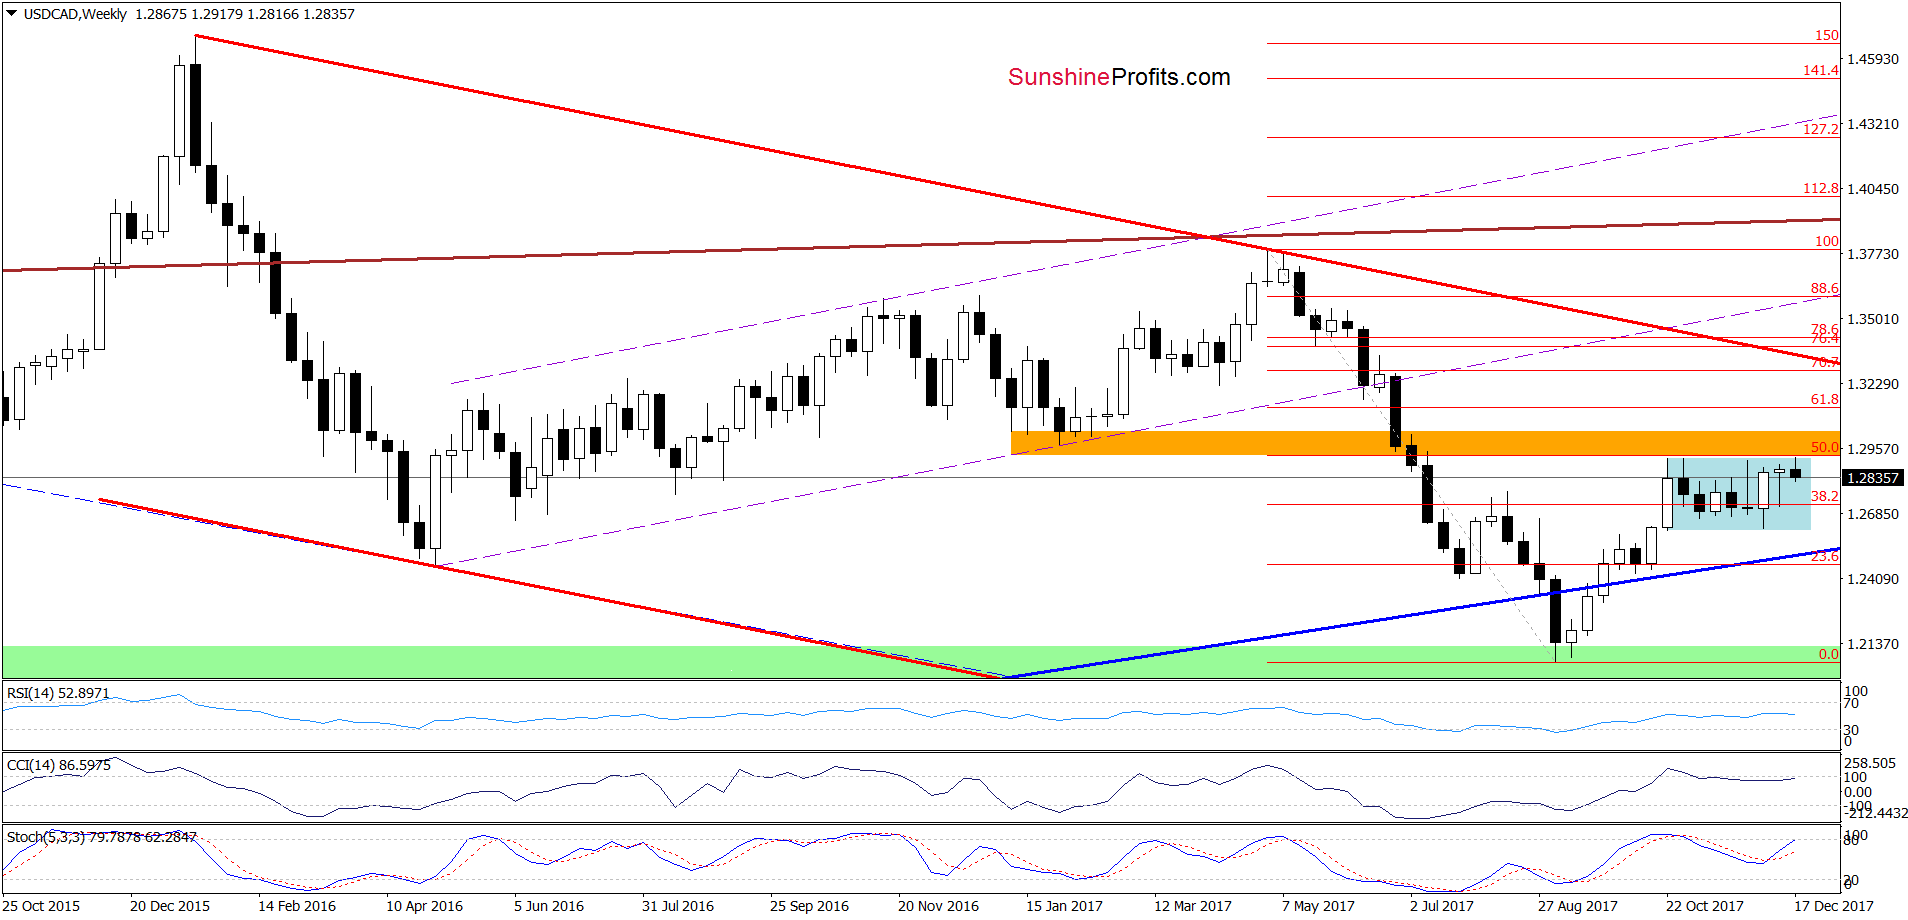
From the medium-term perspective, we see that although USD/CAD moved higher this week, the upper border of the blue consolidation together with the orange resistance zone triggered a pullback.
How did this drop affect the very short-term picture? Let’s check.
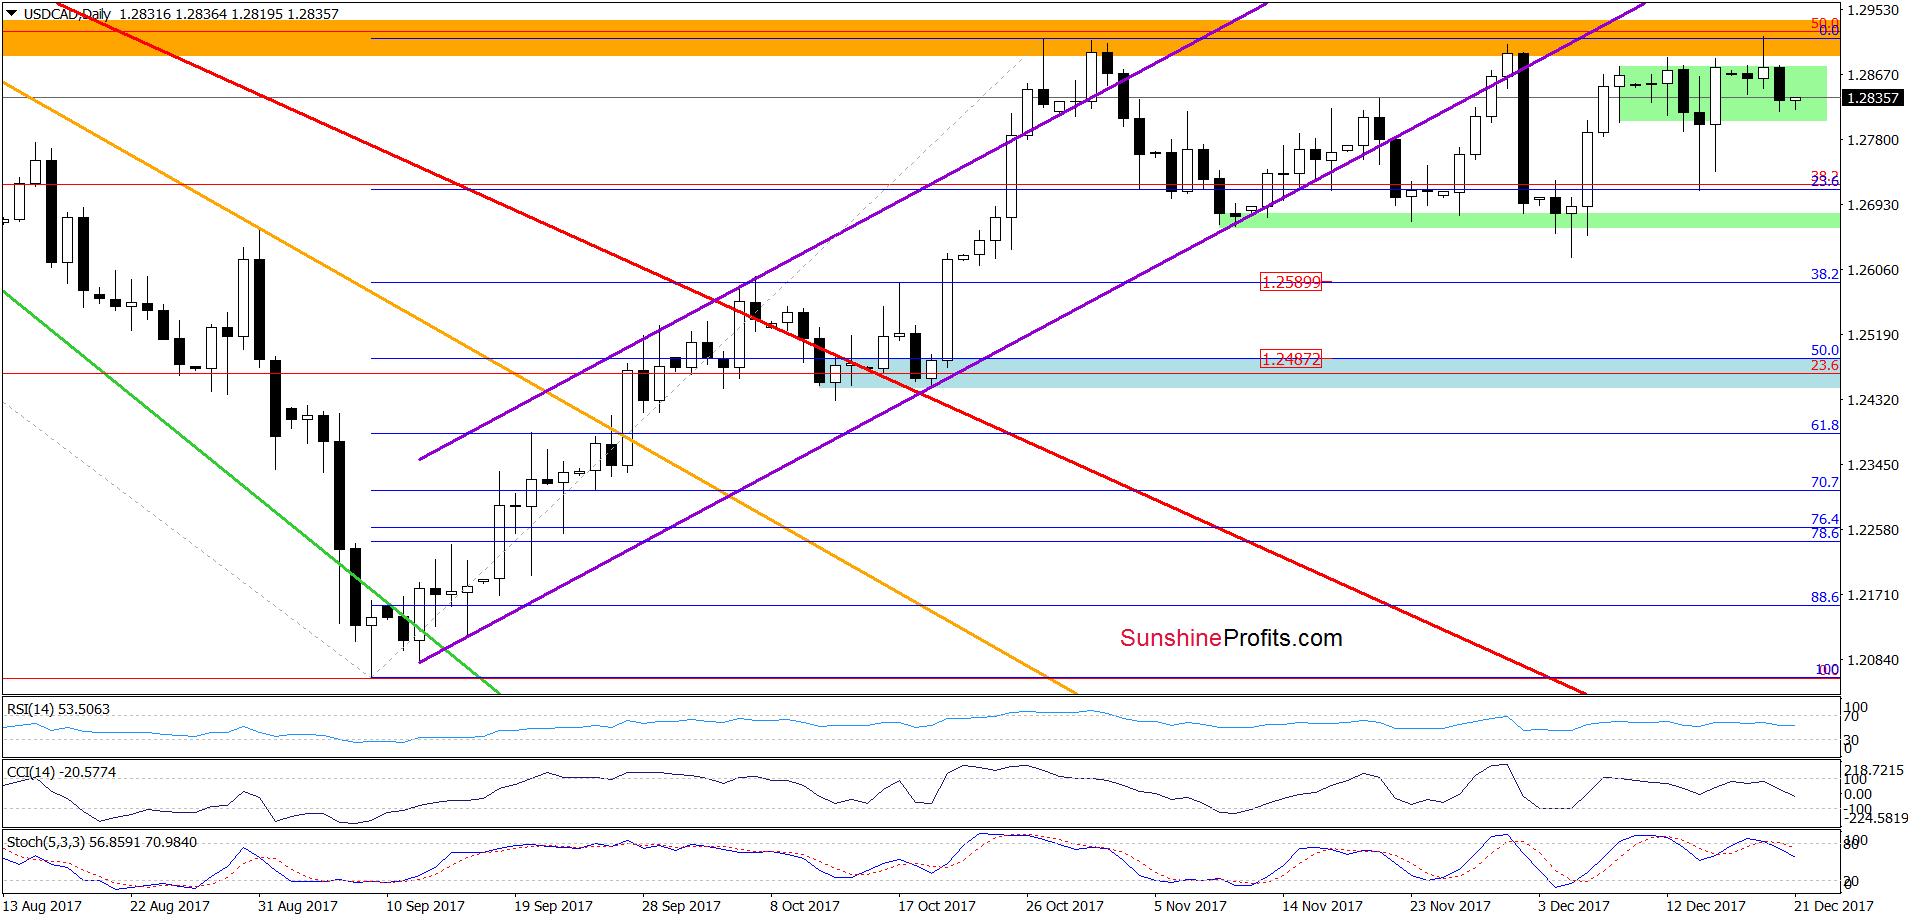
Quoting our last commentary on this currency pair:
(…) although currency bears pushed the exchange rate under the lower border of the green consolidation, their opponents triggered a sharp rebound, which erased all earlier losses. This is a positive development, however, the current position of the daily indicators and the proximity to the resistance area (created by the previous peaks) suggest that the space for gains is limited and another reversal is just around the corner.
On the daily chart, we see that the situation developed in line with the above scenario and USD/CAD moved lower after an invalidation of the tiny breakout above the upper line of the green consolidation.
What does it mean for the exchange rate? We think that the best answer to this question will be the quote from our Wednesday alert:
(…) If we see a decline from current levels, we think that the pair will test the last week’s lows in the following days.
Trading position (short-term; our opinion): no positions are justified from the risk/reward perspective at the moment. We will keep you informed should anything change, or should we see a confirmation/invalidation of the above.
USD/CHF
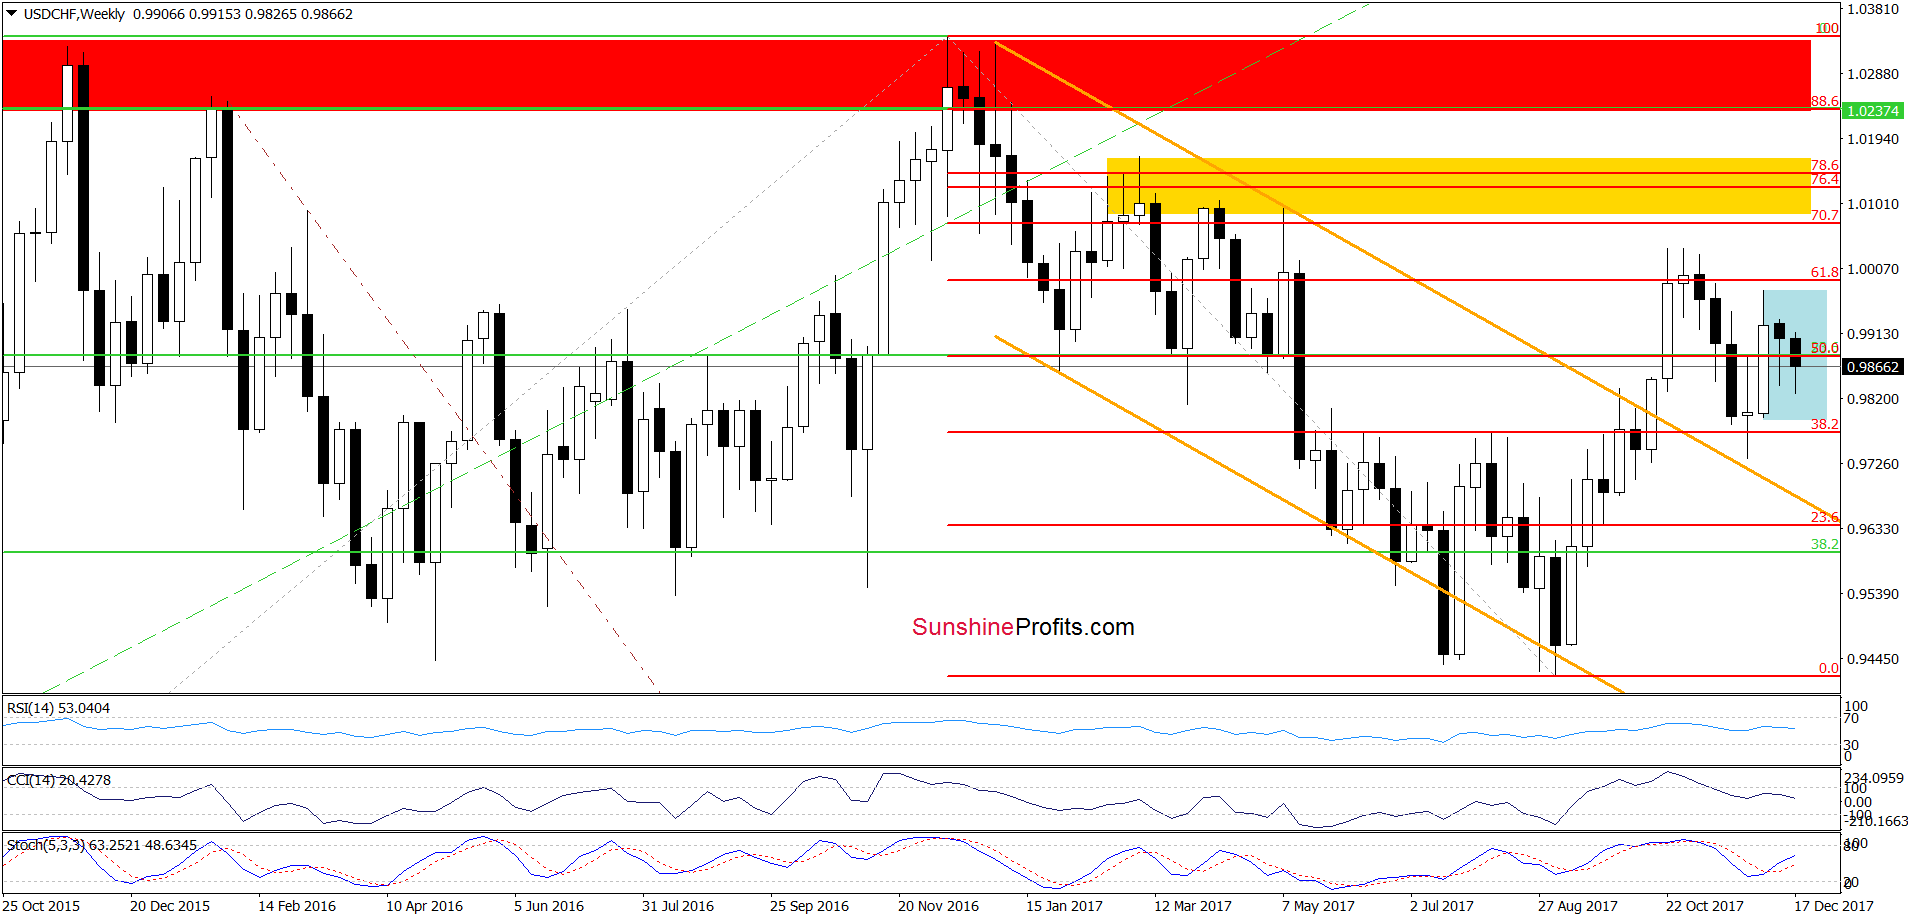
Looking at the weekly chart, we see that the overall situation reains almost unchanged as USD/CHF is trading around the 50% Fibonacci retracement in the blue consolidation, which makes the medium-term perspective a bit unclear.
Will the short-term picture give us more clues about future moves? Let’s check.
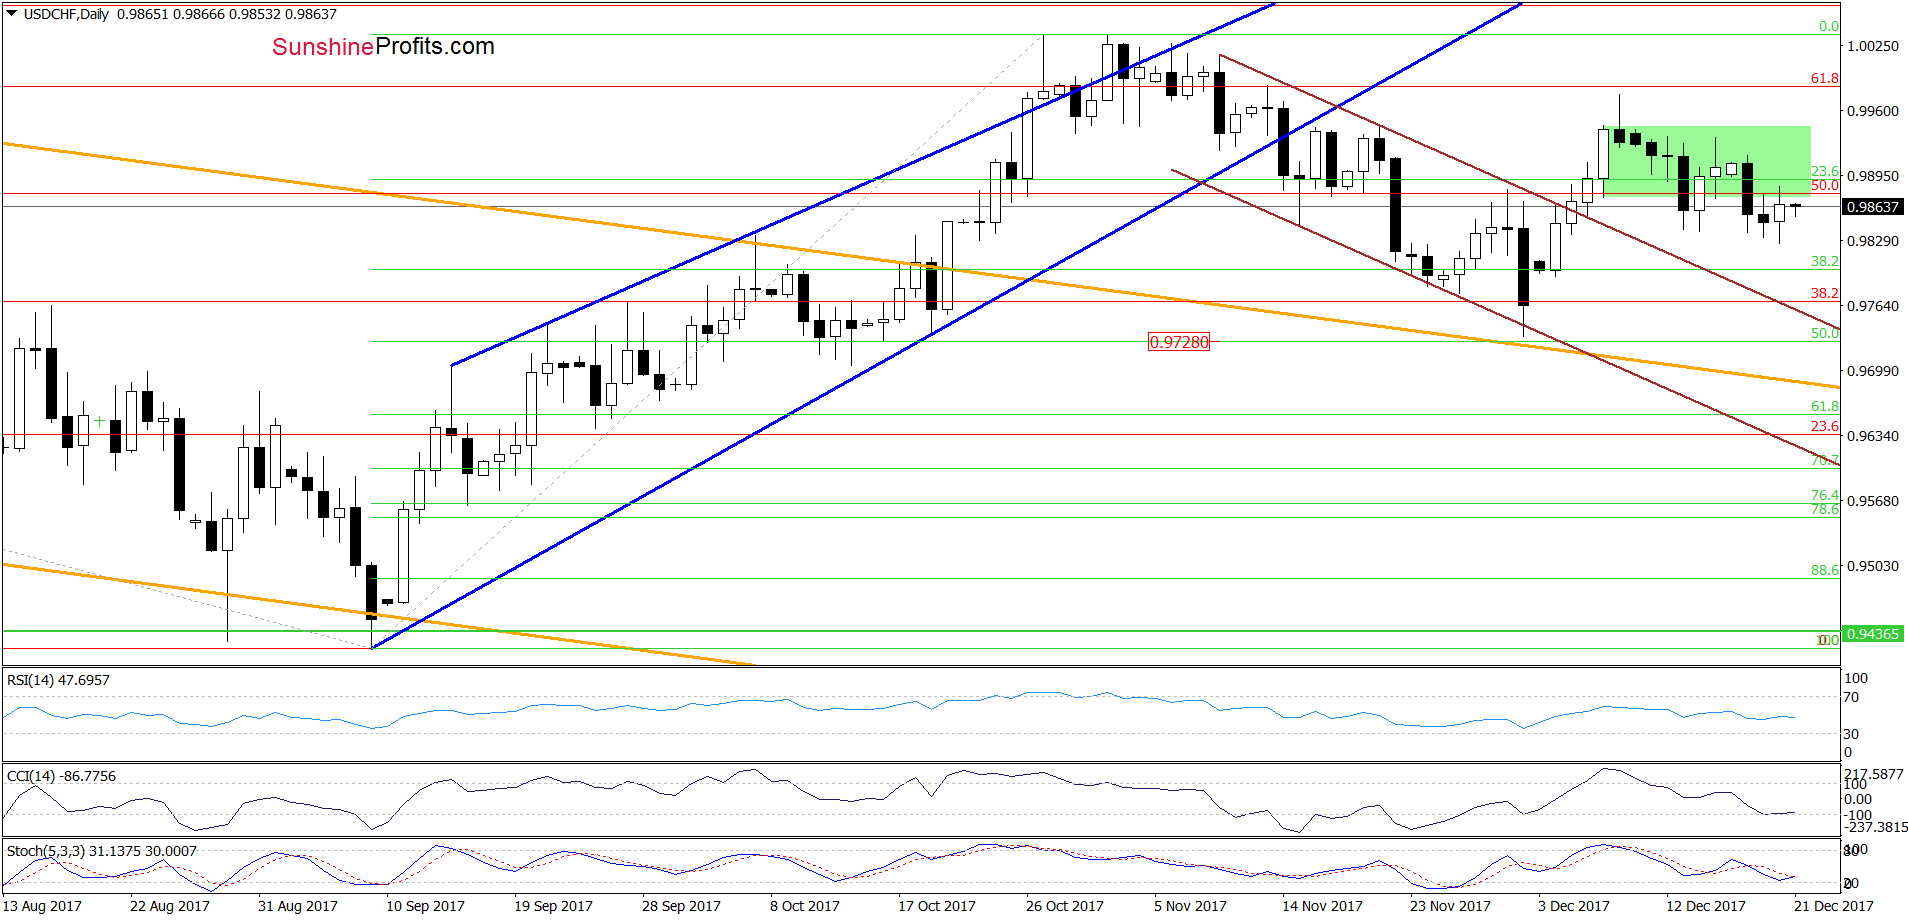
From today’s point of view, we see that although USD/CHF broke below the lower line of the green consolidation on Monday, currency bulls erased some of this decline in the following days. As a result, the exchange rate came back to the lower line of the green consolidation, which looks like a verification of the earlier breakdown at the first sight.
Nevertheless, looking at the current position of the daily indicators (the CCI and the Stochastic Oscillator generated the buy signals), we think that currency bulls will tr to push the pair higher in the coming days. If this is the case, we’ll likely see a test of the upper border of the green consolidation in the coming days.
Trading position (short-term; our opinion): No positions are justified from the risk/reward perspective at the moment. We will keep you informed should anything change, or should we see a confirmation/invalidation of the above.
Thank you.
Nadia Simmons
Forex & Oil Trading Strategist
Przemyslaw Radomski, CFA
Founder, Editor-in-chief, Gold & Silver Fund Manager
Gold & Silver Trading Alerts
Forex Trading Alerts
Oil Investment Updates
Oil Trading Alerts

