

In the previous week EUR/USD and USD/JPY created potential reversal patterns on the daily charts. Will they work and we’ll see a realization of our scenarios?
In our opinion the following forex trading positions are justified - summary:
- EUR/USD: short (a stop-loss order at 1.2250; the initial downside target at 1.1510)
- GBP/USD: short (a stop-loss order at 1.3773; the next downside target at 1.3000)
- USD/JPY: none
- USD/CAD: none
- USD/CHF: none
- AUD/USD: long (a stop-loss order at 0.7410; the initial upside target at 0.7725)
EUR/USD
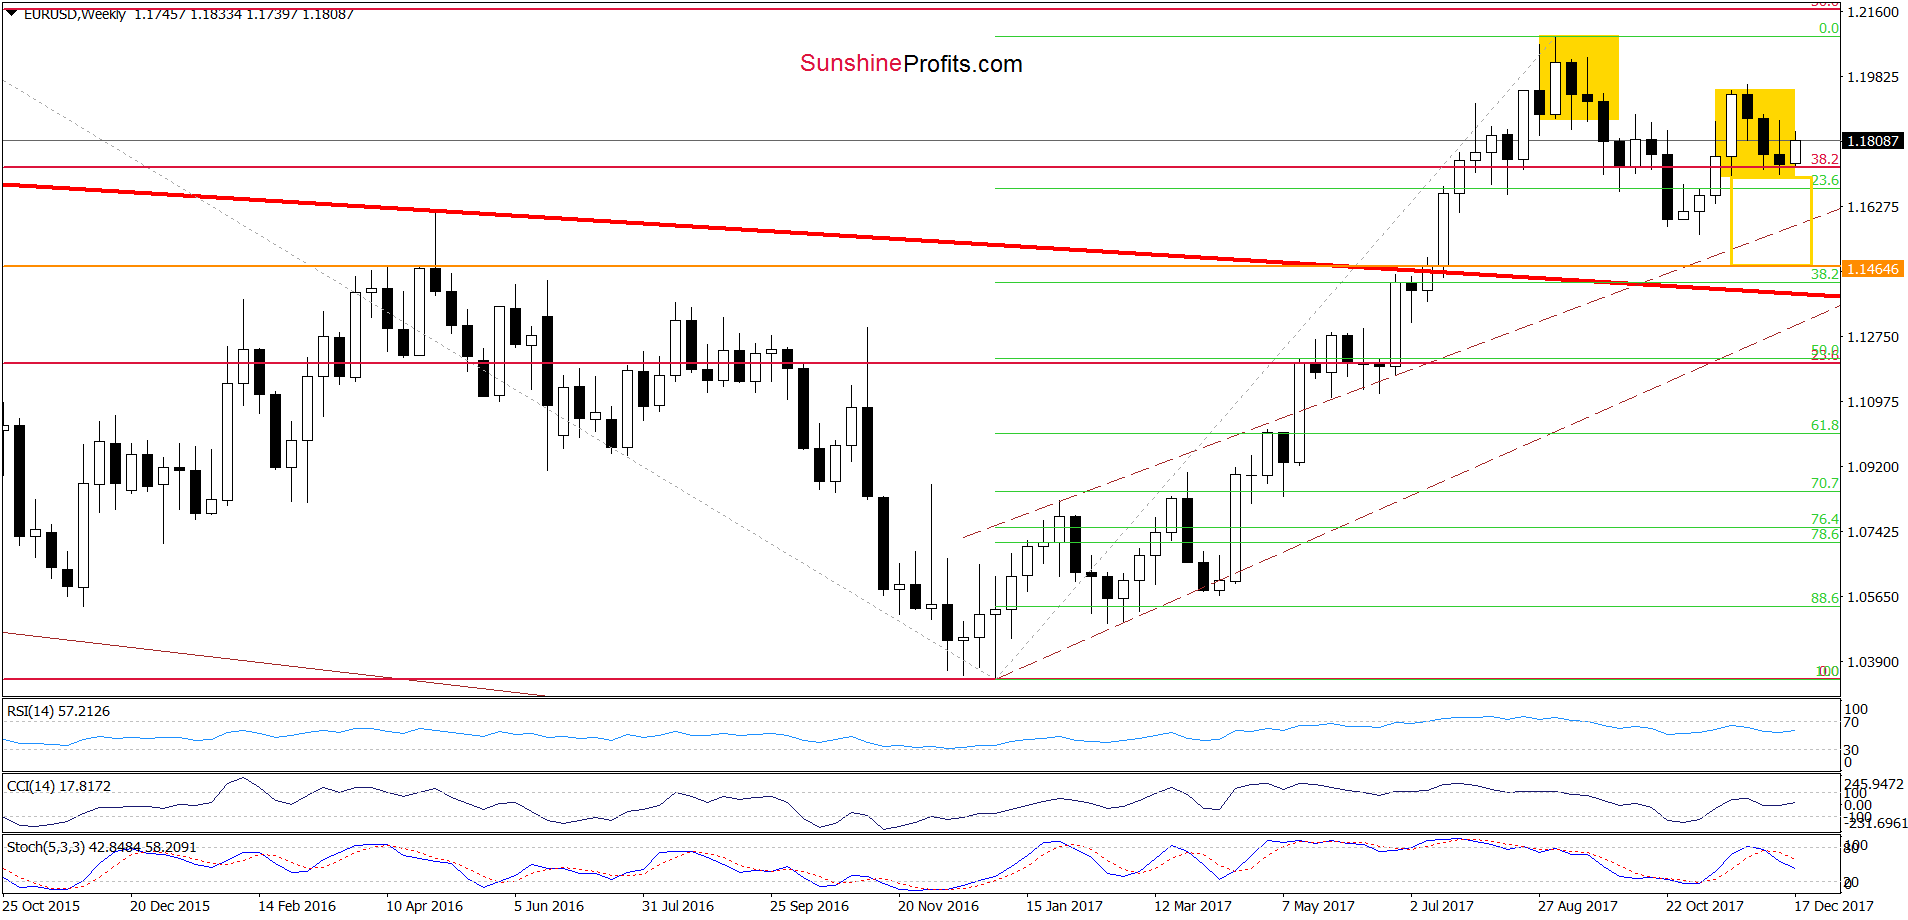
Looking at the weekly chart, we see that EUR/USD approached the lower border of the yellow consolidation in the previous week, which encouraged currency bulls to act. As a result, the exchange rate rebounded earlier today. Despite this increase, the pair remains not only in the above-mentioned yellow consolidation, but also inside the red declining trend channel.
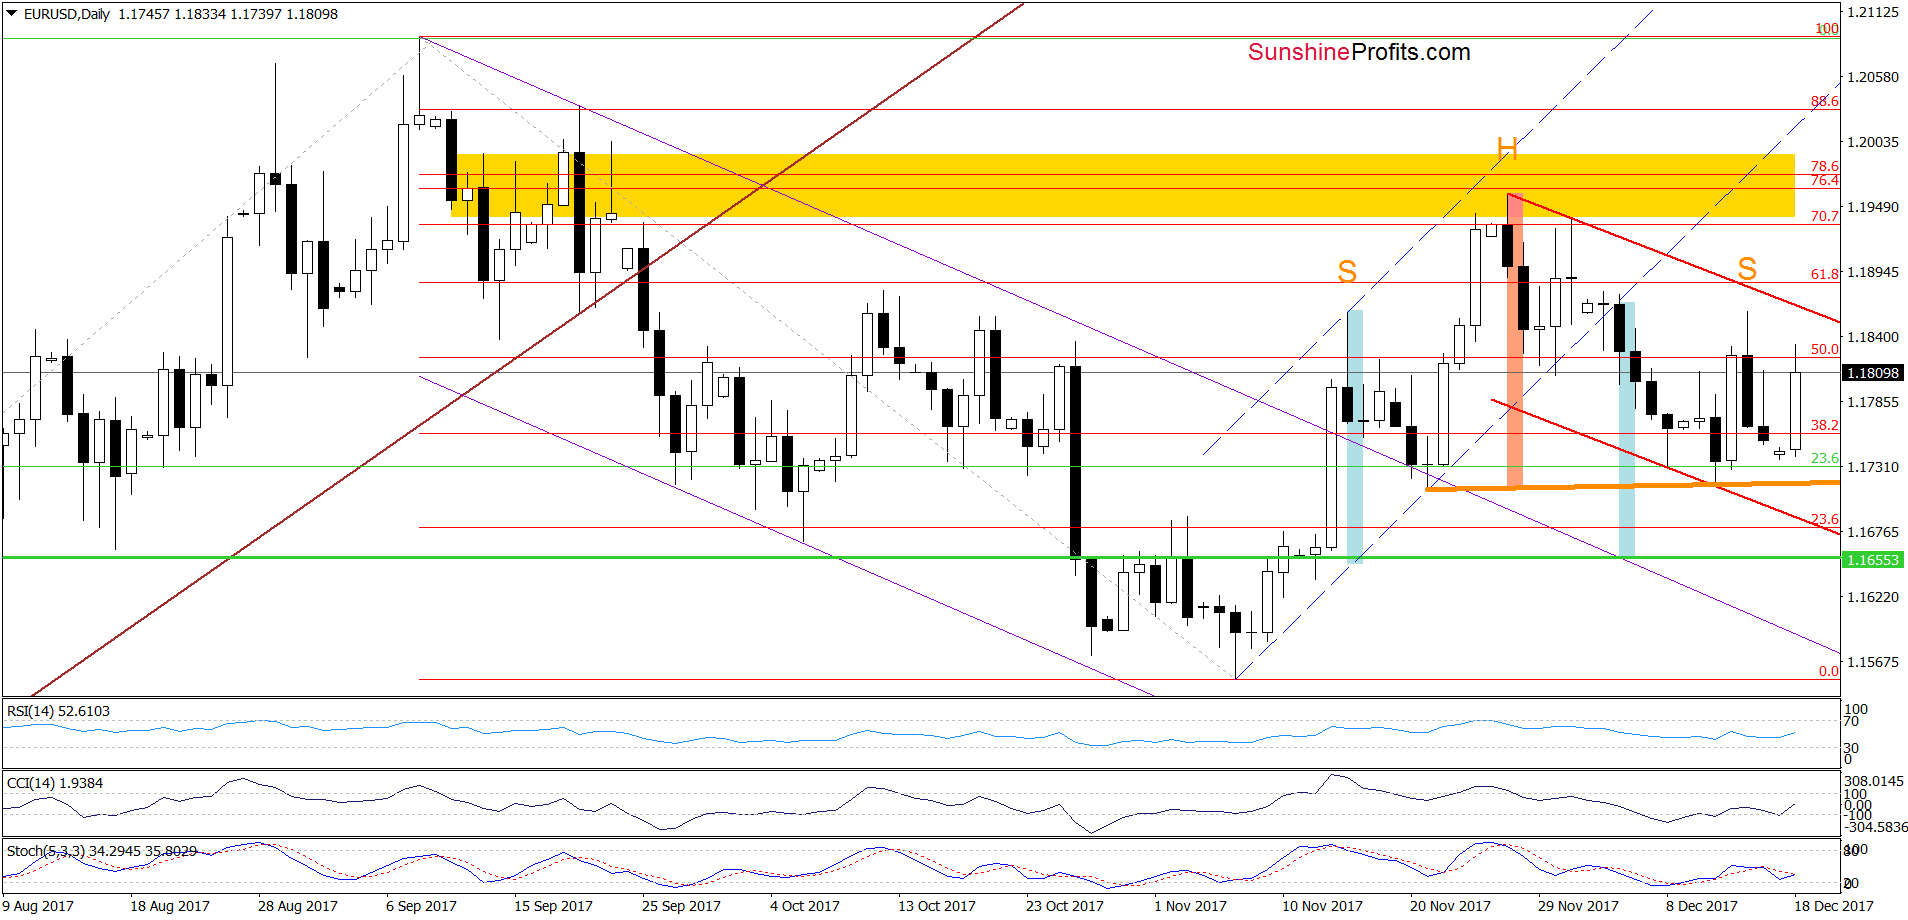
Additionally, the sell signals generated by the medium-term indicators are still in cards, supporting currency bears. On top of that, the potential head and shoulders formation hasn’t been invalidated, which means that as long as there is no breakout above the upper border of the red declining trend channel and the last week high another move to the downside is very likely.
Trading position (short-term; our opinion): short positions (with a stop-loss order at 1.2250 and the initial downside target at 1.1510) continue to be justified from the risk/reward perspective. We will keep you informed should anything change, or should we see a confirmation/invalidation of the above.
GBP/USD
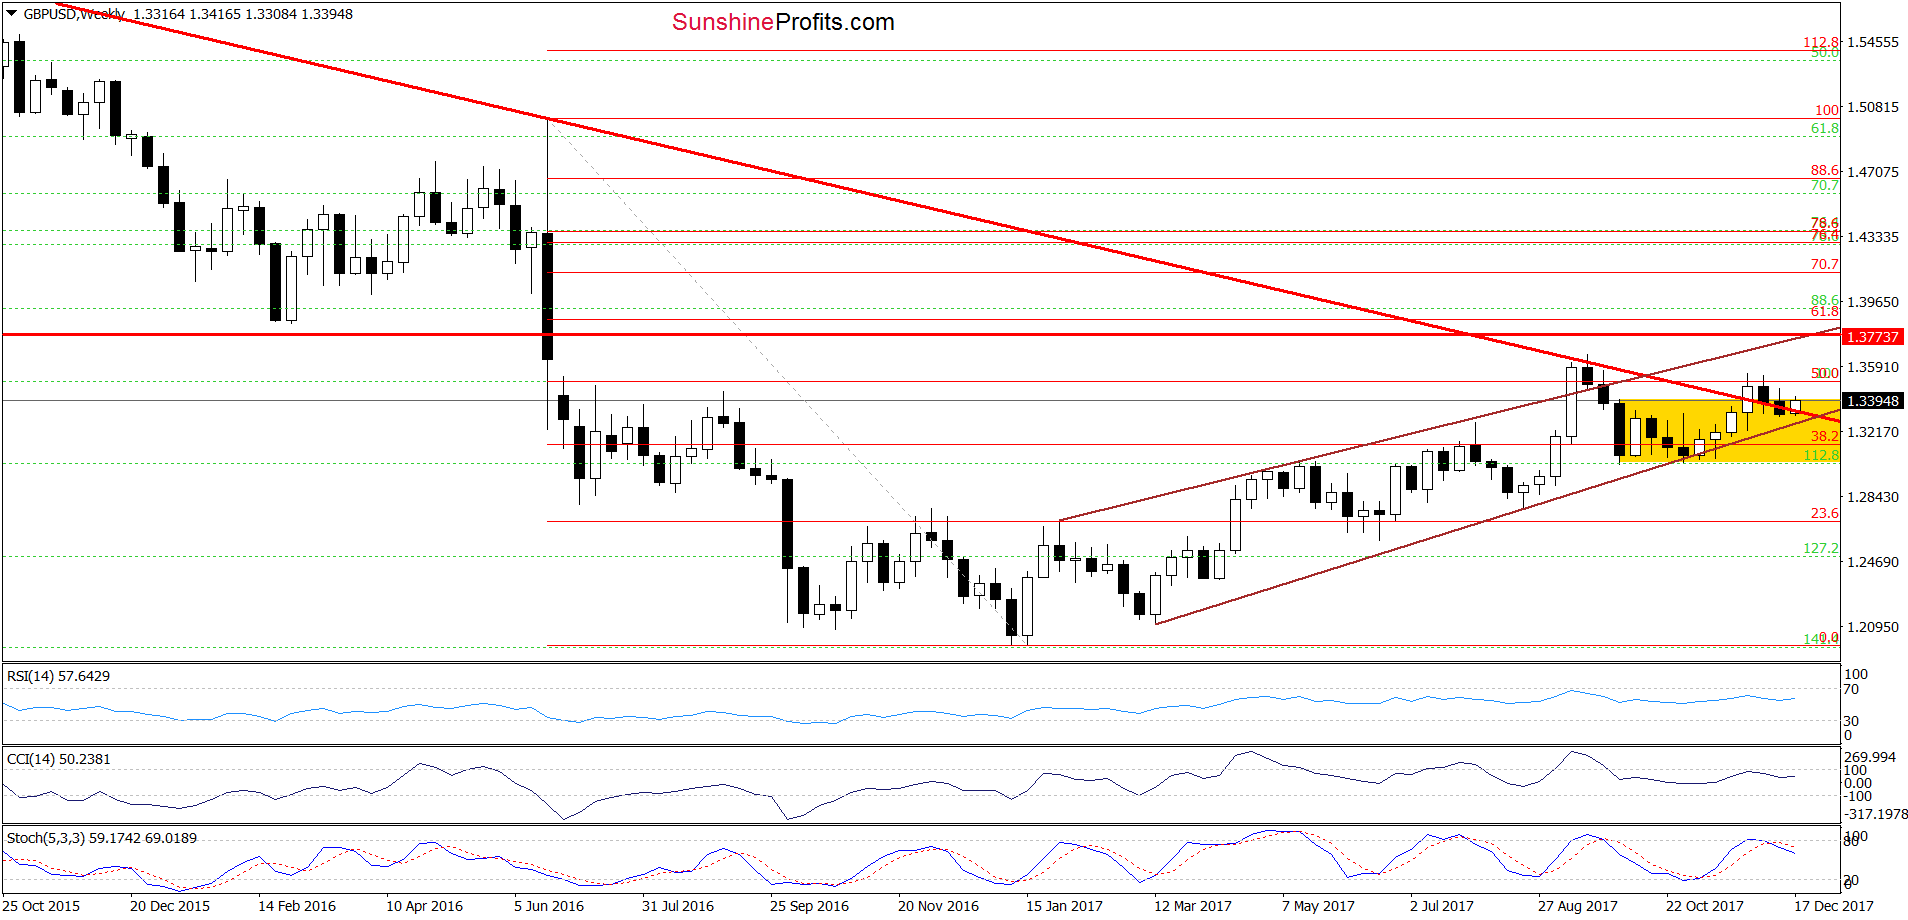
Looking at the medium-term chart, we see that GBP/USD closed the previous week under the long-term red declining line for a second time in a row. Despite this deerioration, currency buls didn’t give up and start the new week with another attempt to move higher.
How did this move affect the very short-term picture? Let’s exaine the daily chart and find out.
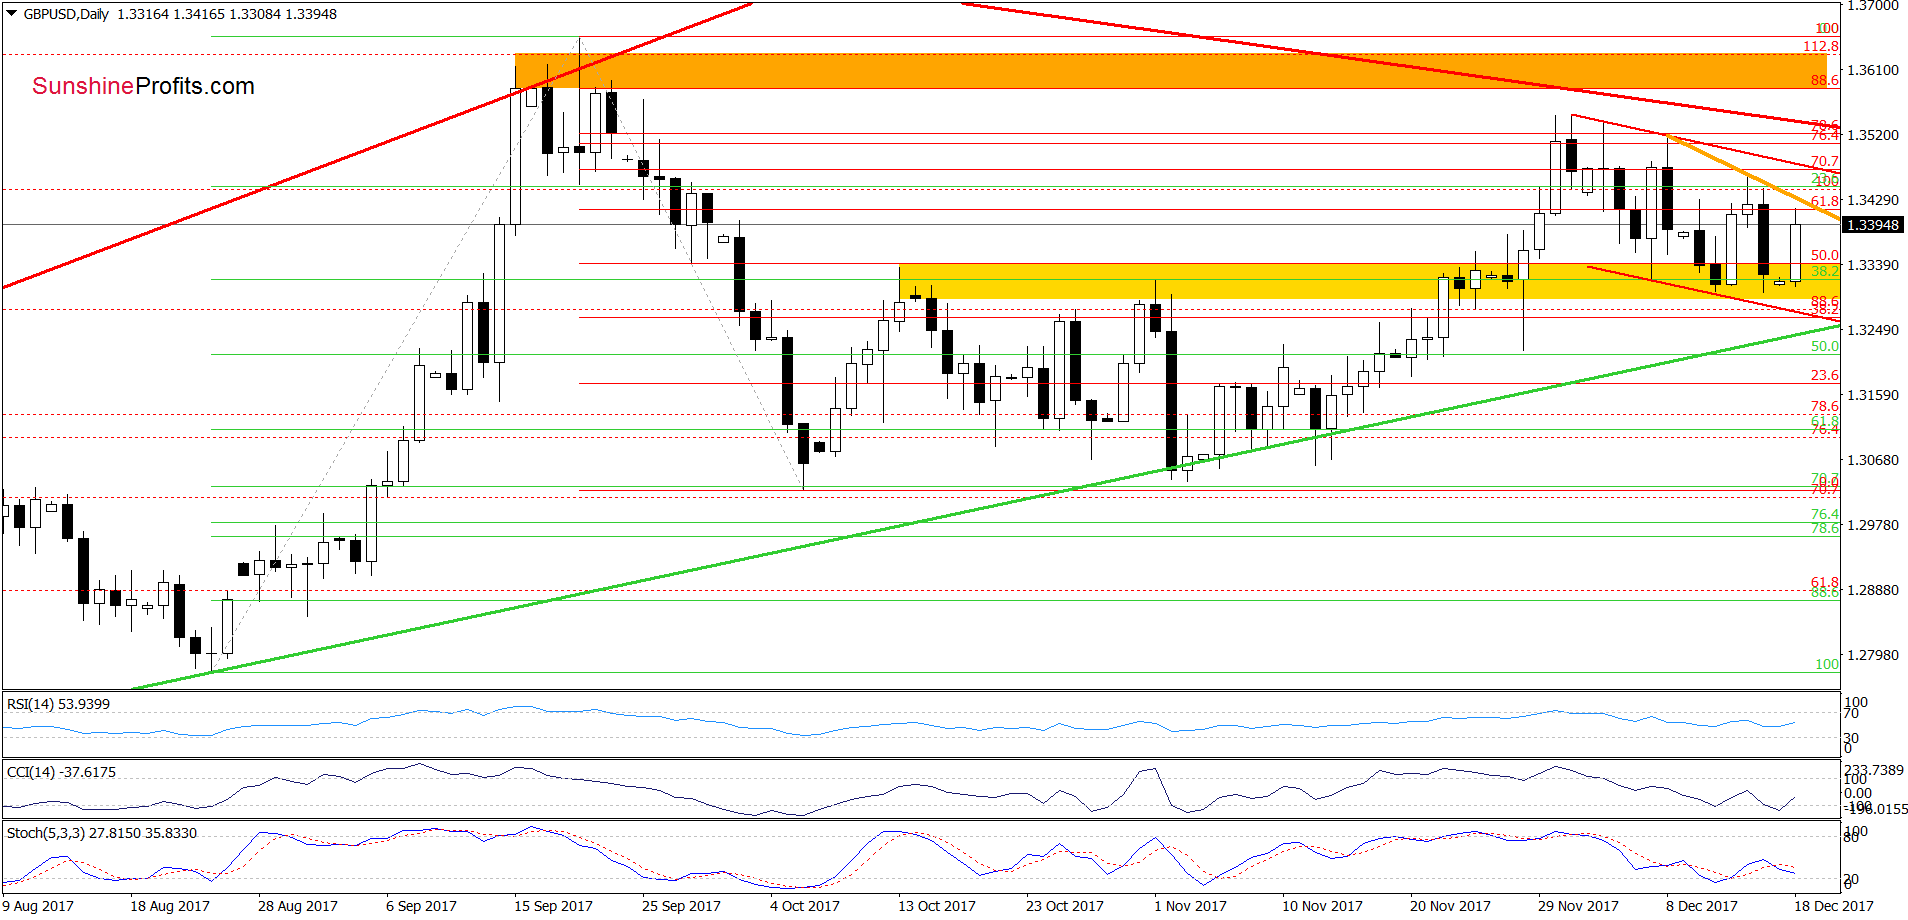
From this perspective, we see that GBP/USD bounced off the yellow support zone once again earlier today. We saw similar price action two times in December, but none of them brought any improvement in the short-term (not to mention the medium-term perspective). When we take a closer look at the above chart, we notice that the last week’s increase was smaller than the previous one, which translated into another decline. Therefore, in our opinion, as long as there is no breakout above the upper border of the red declining trend channel lower values of GBPUSD are very likely and short positions continue to be justified from the risk/reward perspective.
Trading position (short-term; our opinion): short positions (with a stop-loss order at 1.3773 and the next downside target at 1.3000) continue to be justified from the risk/reward perspective. We will keep you informed should anything change, or should we see a confirmation/invalidation of the above.
USD/JPY
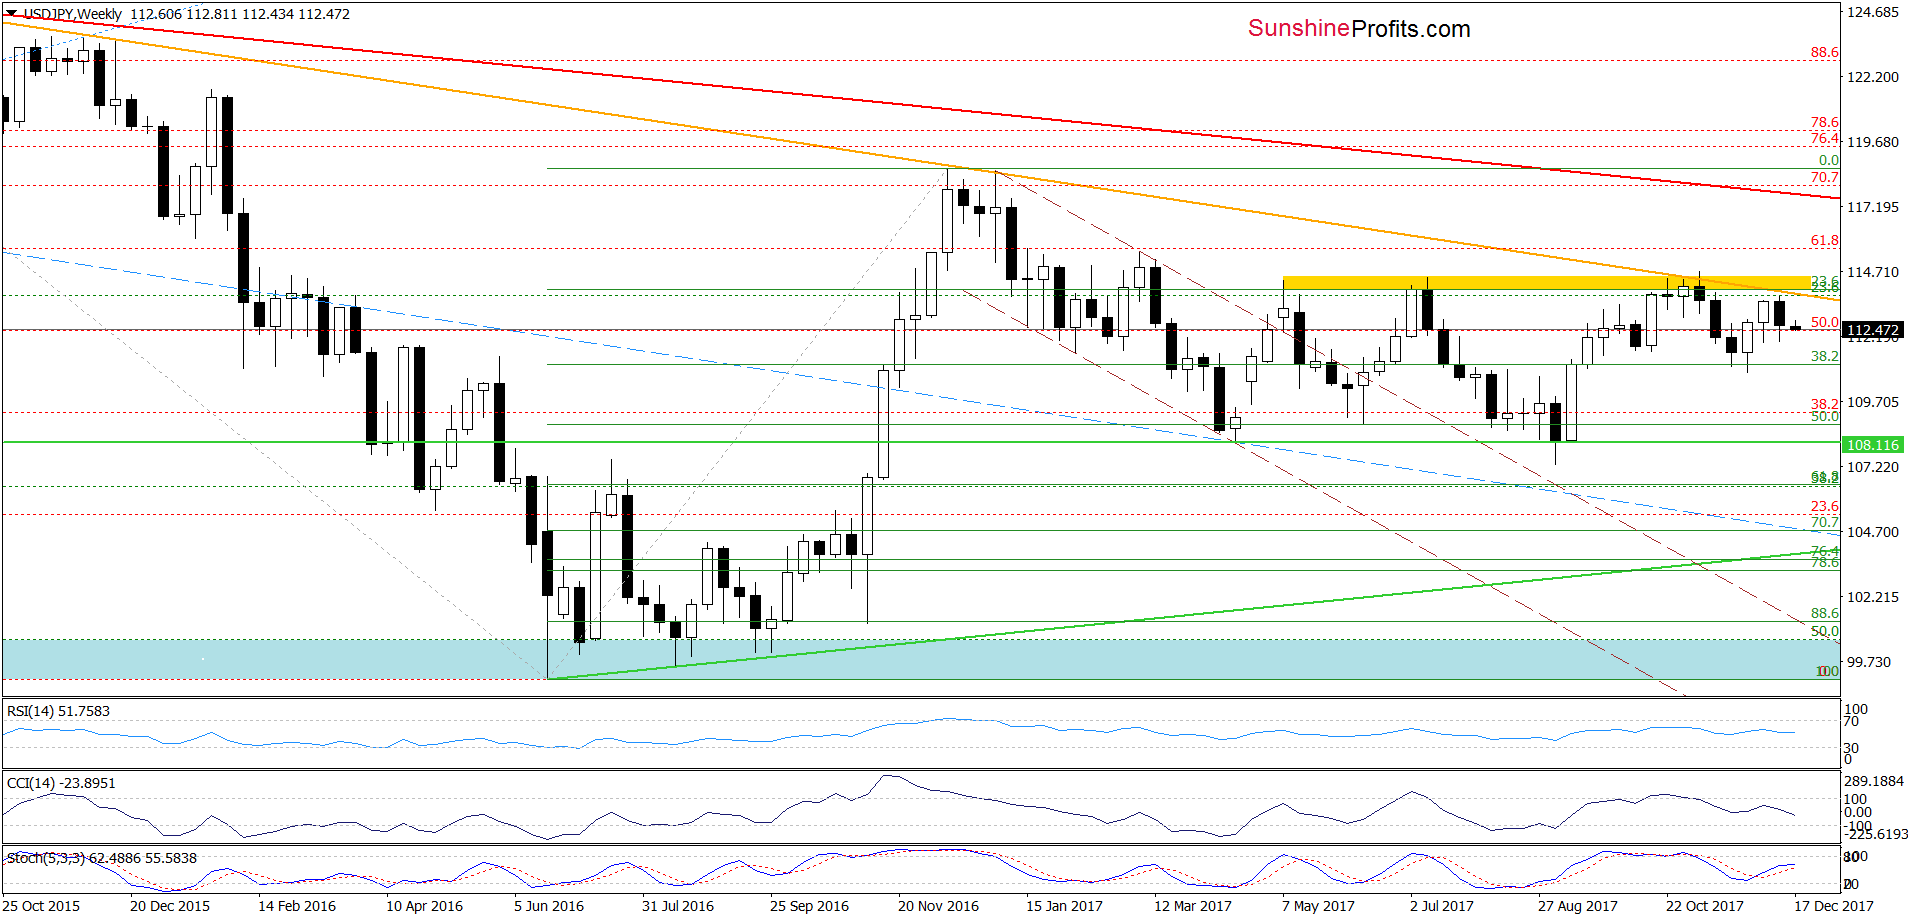
On the weekly chart, we see that the proximity to the yellow resistance zone and the long-term orange declining resistance line were enough to encourage currency bears to act. As a result, USD/JPY declined, erasing most of the previous week’s increase.
Having said that, let’s check what impact this drop had on the daily chart.
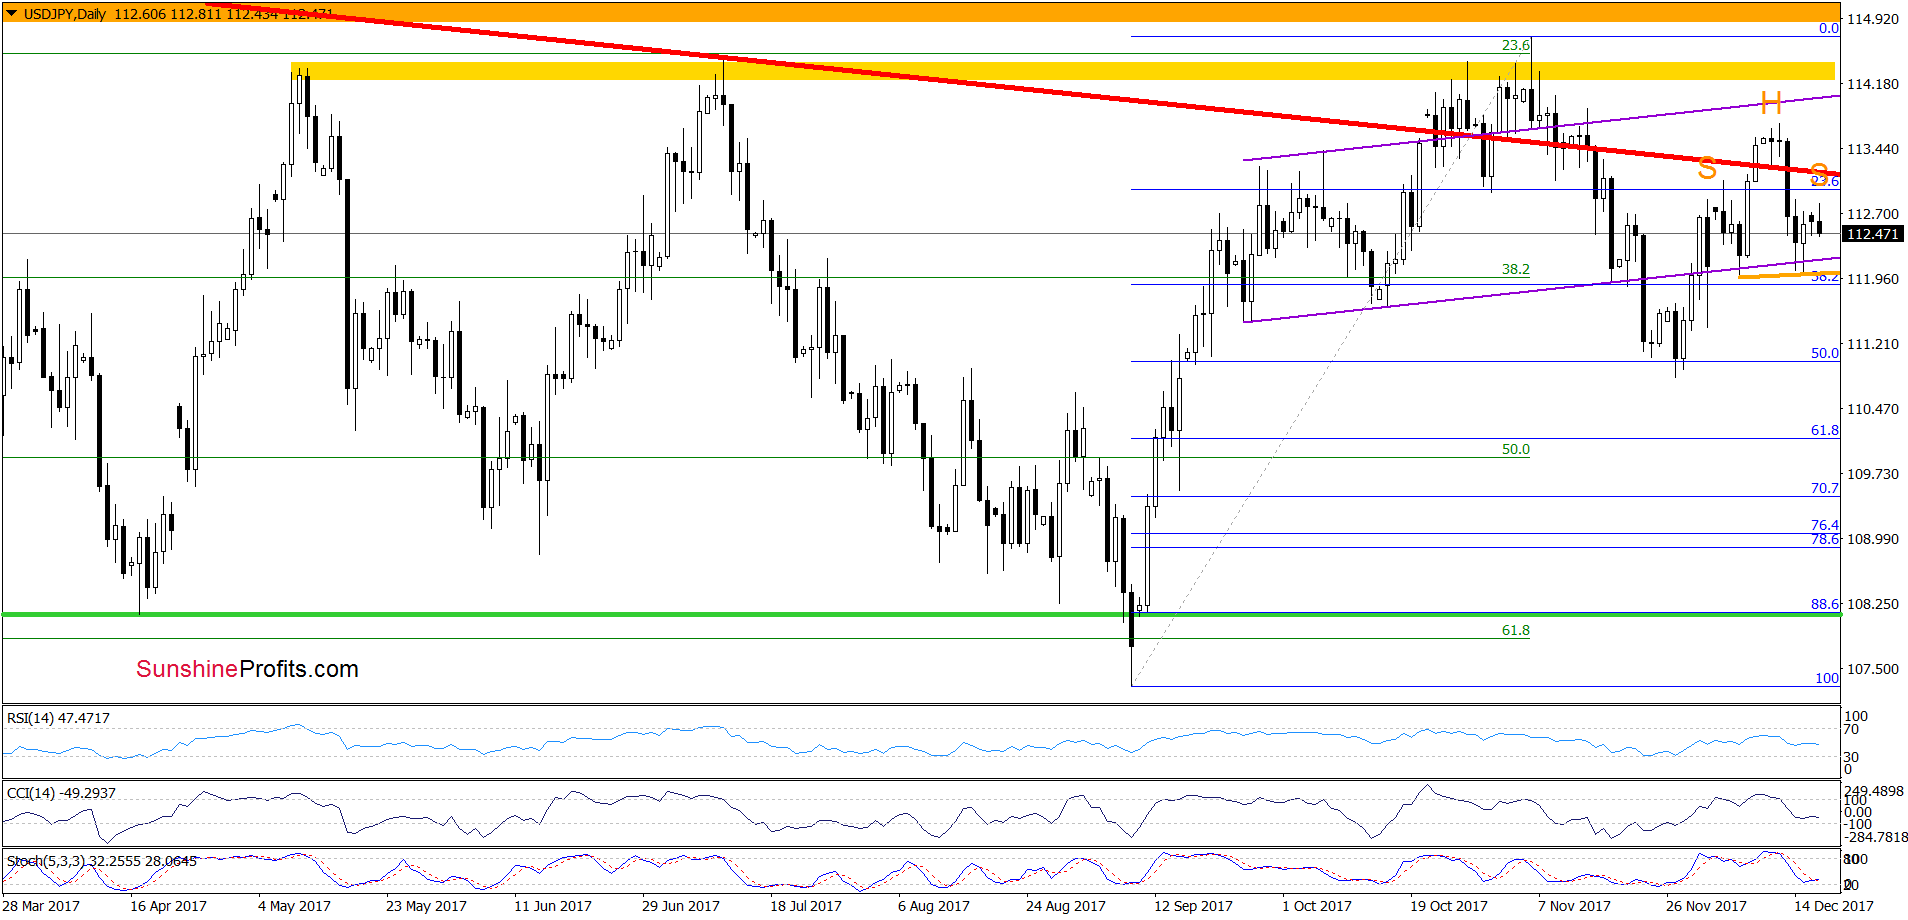
Quoting our last commentary on this currency pair:
(…) although USD/JPY broke above the red declining resistance line, currency bulls didn’t manage to push the pair even to the first upside target. This show of their weakness encouraged their opponents to act and resulted in a sharp decline yesterday. Thanks to this drop the pair invalidated the earlier breakout above the red line, which suggests that we’ll see a test of the lower border of the purple rising trend channel soon (please note that this scenario is also reinforced by the sell signals generated by the daily indicators).
From today’s point of view, we see that the situation developed in line with the above scenario and USD/JPY tested our downside target in the previous week. Although the pair rebounded on Friday, currency bears came back earlier today, triggering another pullback. At this point it is worth noting that if they manage to push the pair under the orange support line based on the recent lows, we can see a decline to the 50% Fibonacci retracement and the November lows.
Why? As you see on the daily chart, we marked a potential head and shoulders formation, which will turn into a strong bearish signal if USD/JPY declines under the orange line (the neck line of he formation). Therefore, waiting at the sidelines for a confirmation/invalidation of the above is justified from the risk/reward perspective.
Trading position (short-term; our opinion): No positions are justified from the risk/reward perspective at the moment. We will keep you informed should anything change, or should we see a confirmation/invalidation of the above.
Thank you.
Nadia Simmons
Forex & Oil Trading Strategist
Przemyslaw Radomski, CFA
Founder, Editor-in-chief, Gold & Silver Fund Manager
Gold & Silver Trading Alerts
Forex Trading Alerts
Oil Investment Updates
Oil Trading Alerts

