

On Friday, the U.S. dollar extended losses against the yen, which pushed USD/JPY to the lowest level since min-June. Will currency bulls find finally support in the coming days?
In our opinion the following forex trading positions are justified - summary:
- EUR/USD: short (a stop-loss order at 1.1863; the initial downside target at 1.1408)
- GBP/USD: short (a stop-loss order at 1.3272; the initial downside target at 1.2375)
- USD/JPY: none
- USD/CAD: none
- USD/CHF: none
- AUD/USD: none
EUR/USD
On Friday, we wrote the following:
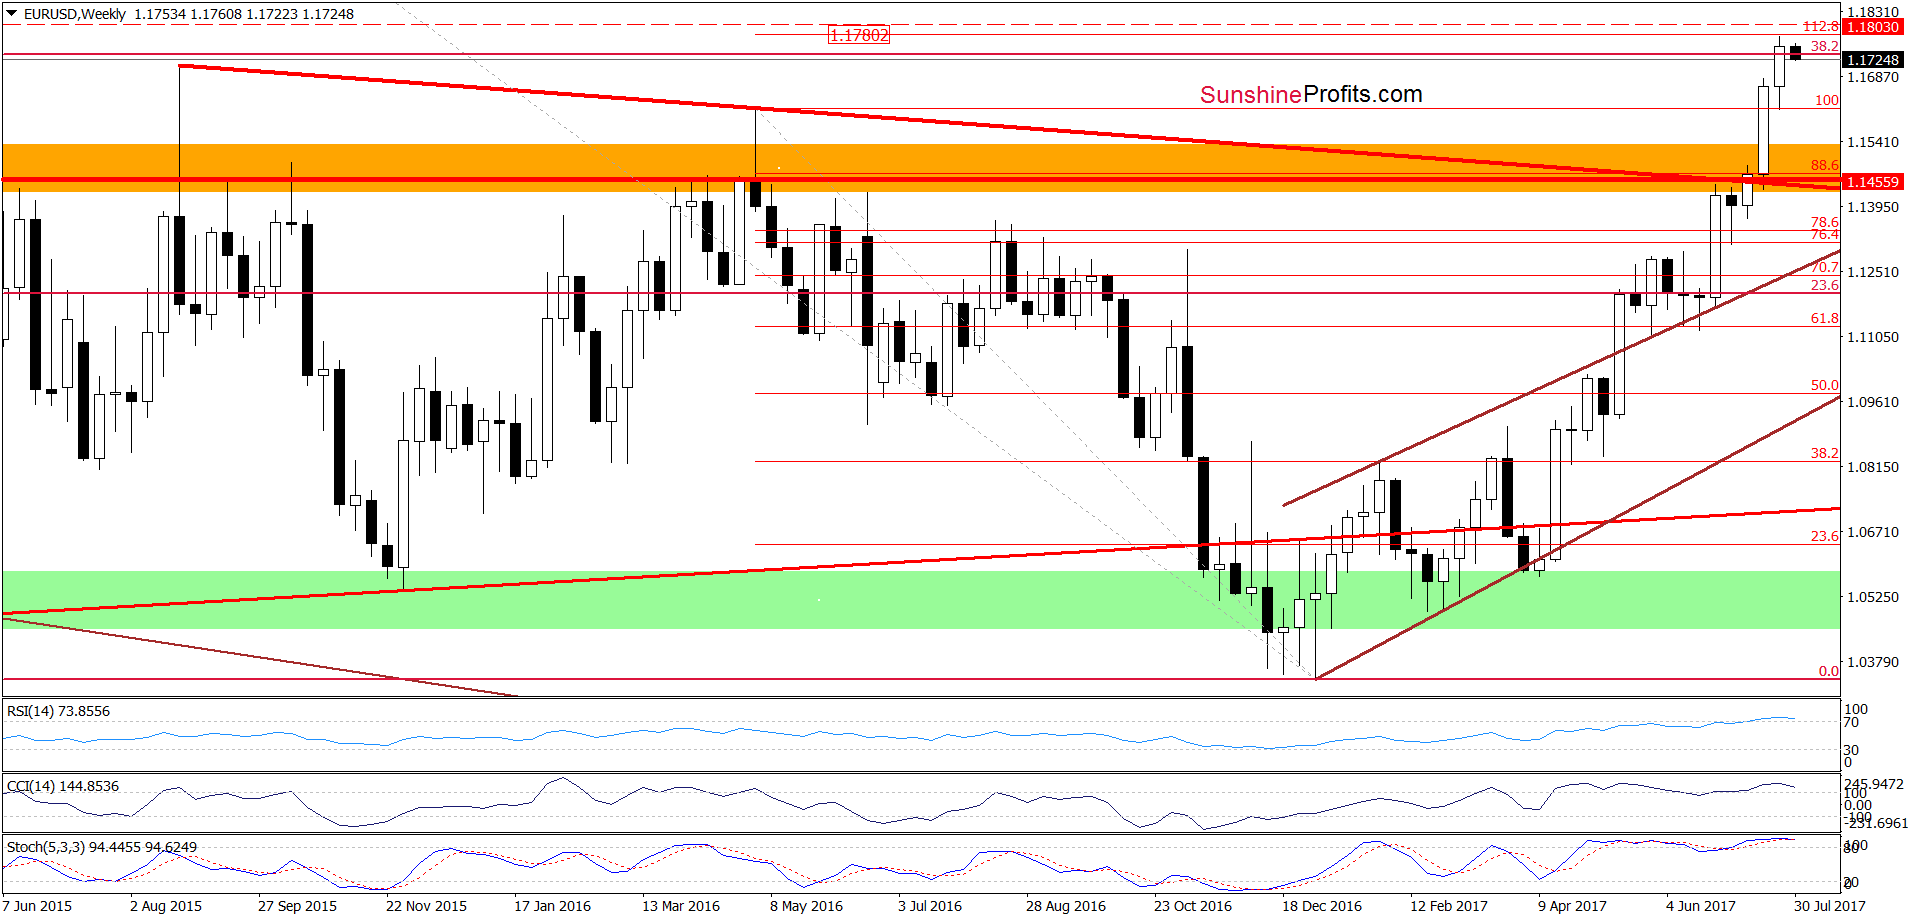
(…) earlier today, currency bulls pushed the pair higher and the exchange rate came back above this line [the upper border f the brown rising trend channel], which suggests that we’ll likely see a test of the recent high and major resistances - the August 2015 peak and the 38.2% Fibonacci retracement (both seen on the weekly chart) later in the day.
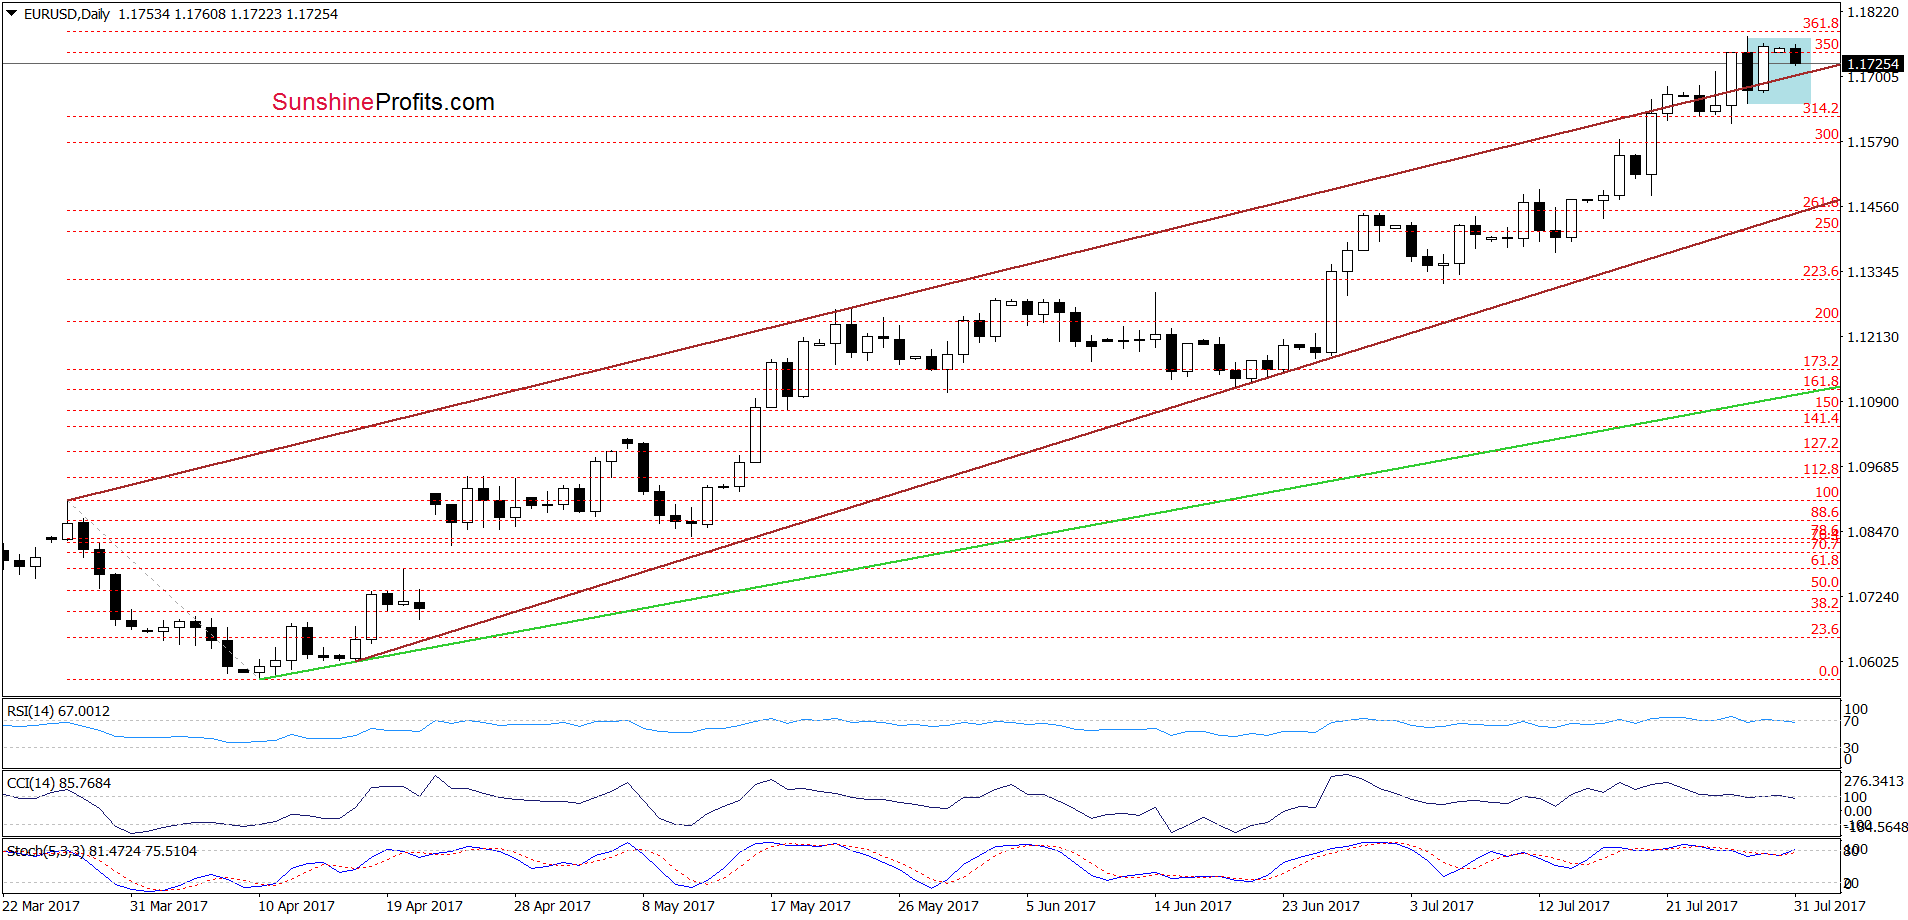
From today’s point of view, we see that currency bulls pushed EUR/USD higher as we had expected. Thanks to Friday’s increase the exchange rate approached the recent highs and the 361.8% Fibonacci extension, which resulted in a pullback earlier today.
Despite this deterioration, the pair remains in the blue consolidation, which suggests that short-lived moves in both directions should not surprise us. Nevertheless, the current position of the daily and weekly indicators suggests that reversal and lower prices are just ahead us (please note that there are also bearish divergences between the exchange rate and the daily indicators, which increases the probability of reversal in the coming days).
Very short-term outlook: mixed with bearish bias
Short-term outlook: bearish
MT outlook: mixed
LT outlook: mixed
Trading position (short-term; our opinion): Short positions (with a stop-loss order at 1.1863 and the initial downside target at 1.1408) are justified from the risk/reward perspective. We will keep you informed should anything change, or should we see a confirmation/invalidation of the above.
USD/JPY
Quoting our Thursday’s Forex Trading Alert:
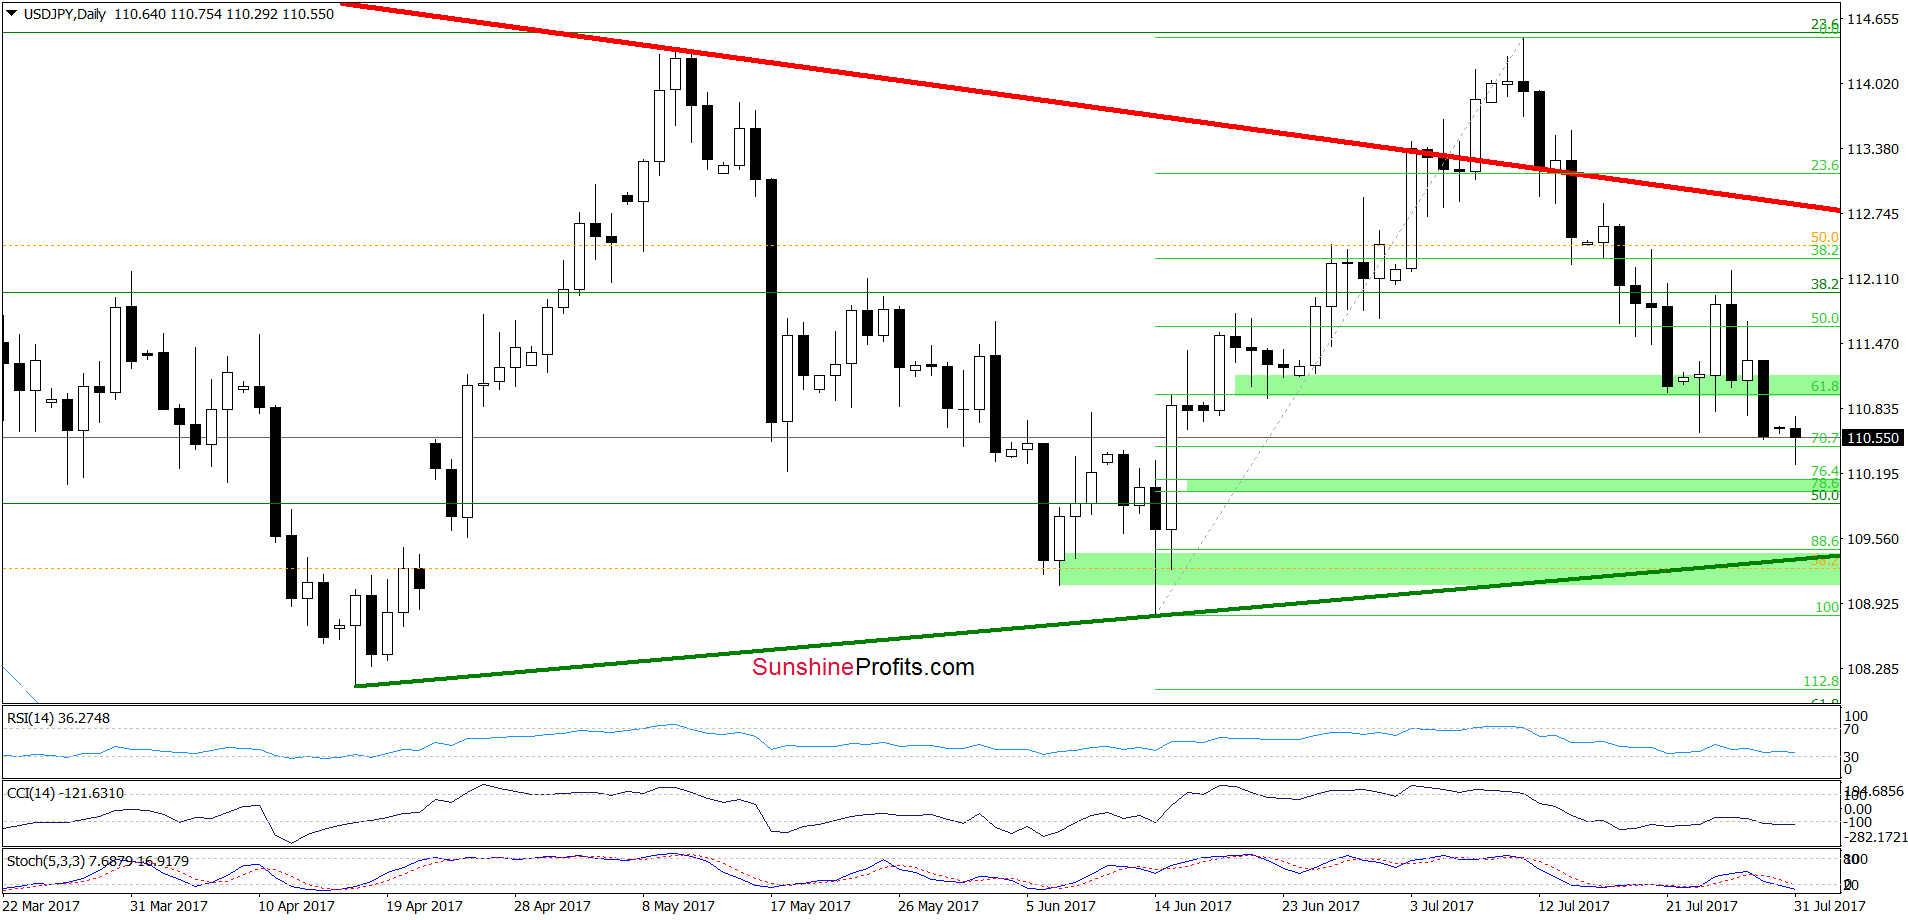
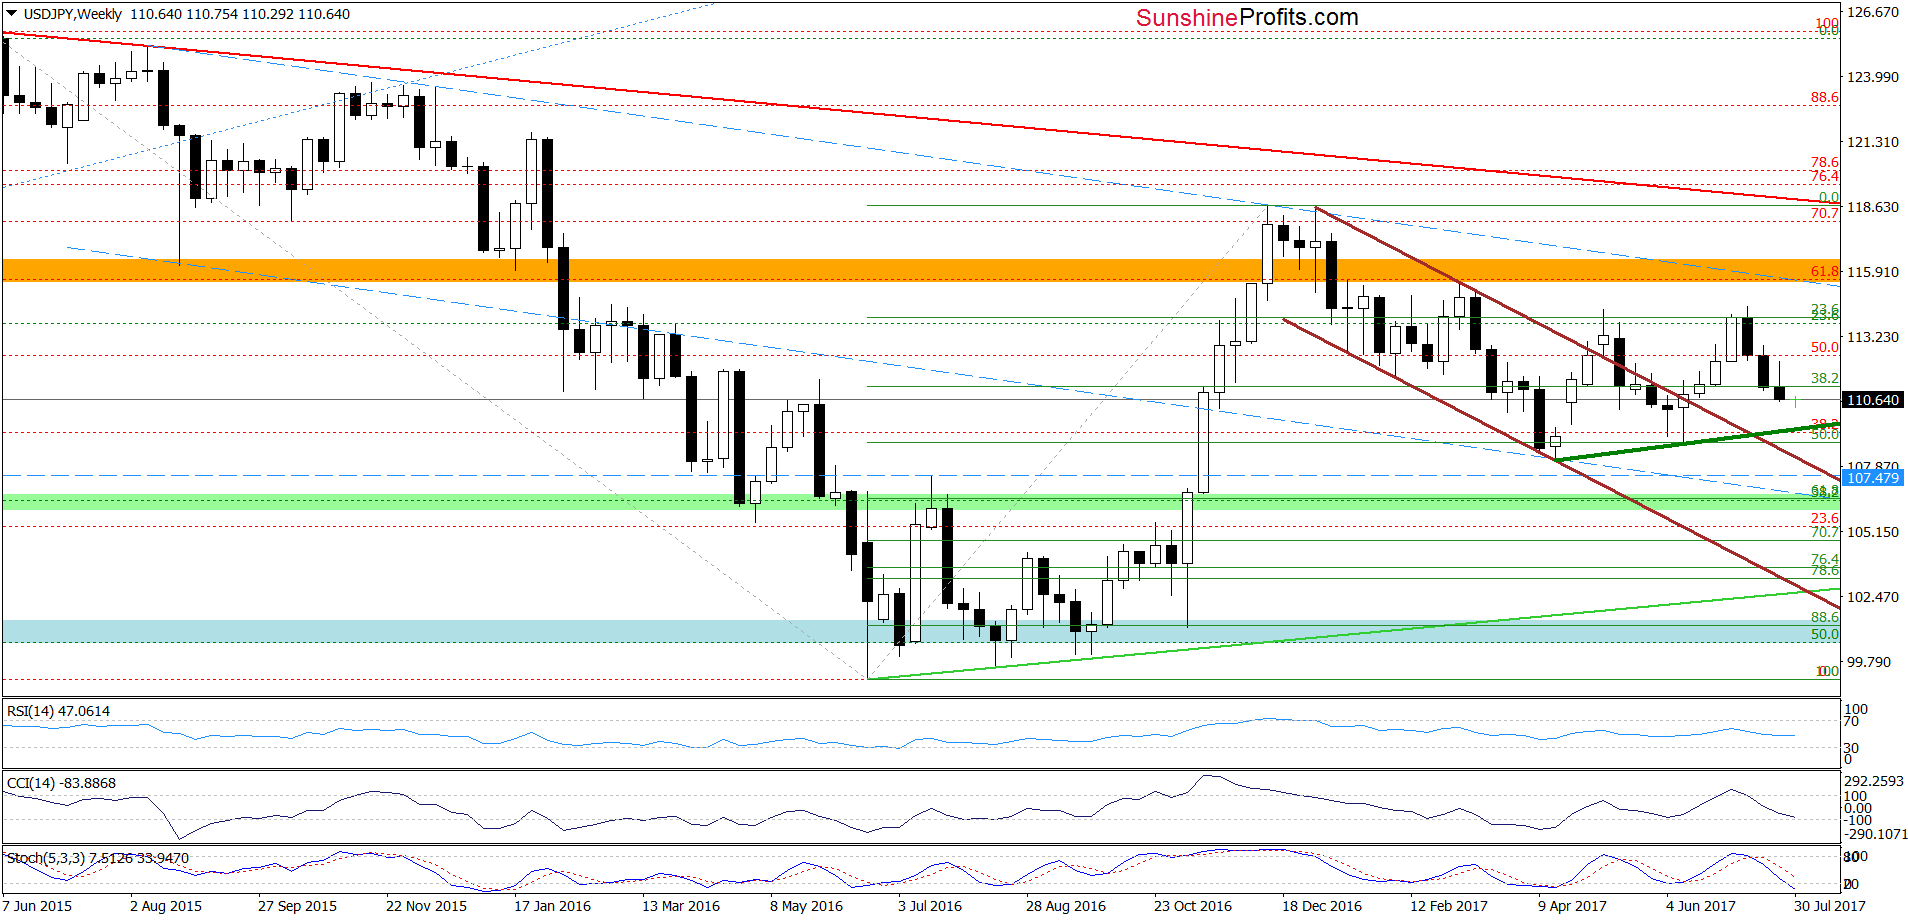
(...) Although the green support area triggered a rebound earlier this week, the par reversed and declined sharply yesterday, erasing almost all earlier gains. In this way the pair re-tested the strength of the green support zone once again. Will it withstand the selling pressure in the coming days? (...) if we zoom out our picture and take a closer look at the weekly chart, we notice that the sell signals generated by the indicators continue to support currency bears and further deterioration.
Looking at the charts, we see that the situation developed in line with our assumptions and USD/JPY extended losses, breaking below the above-mentioned green support zone and opening the way to lower levels.
How low could the exchange rate going the coming days? We believe that the best answer to this question will be the quote from our last commentary on this currency pair:
(...) if the nearest green support area is broken, we may see a drop to around 109.46, where the upper border of the next green support zone is. This zone is currently also crossed by the medium-term green support line based on the previous lows, which increased the probability that this area will stop declines for longer and trigger a significant rebound.
Very short-term outlook: mixed with bearish bias
Short-term outlook: mixed
MT outlook: mixed
LT outlook: mixed
Trading position (short-term; our opinion): No positions are justified from the risk/reward perspective at the moment. We will keep you informed should anything change, or should we see a confirmation/invalidation of the above.
USD/CAD
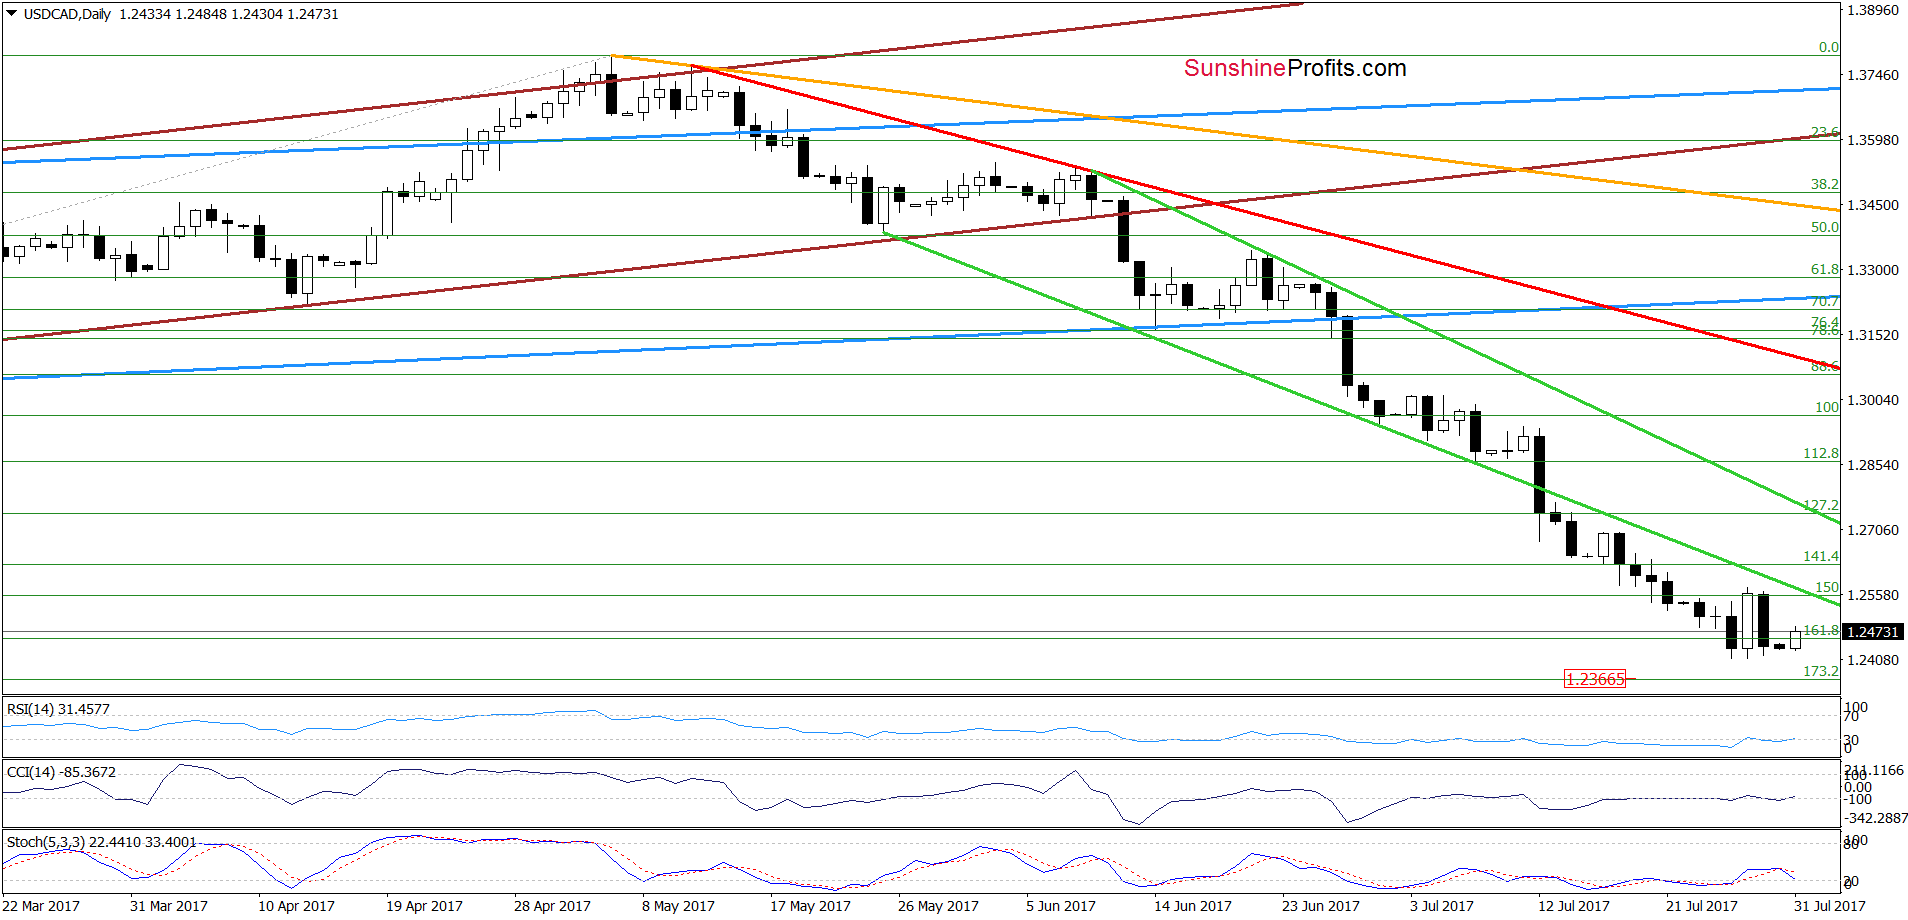
Looking at the daily chart, we see that although USD/CAD moved higher on Thursday, currency bears erased this increase on the following day, which suggests that the decline may not be over yet. What does it mean for the exchange rate? As you see on the daily chart, the pair remains in the consolidation around the 161.8% Fibonacci extension, but the Stochastic Oscillator generated the sell signal, suggesting that one more downswing in the coming day(s) is likely.
How low could the exchange rate go? In our, opinion, the first downside target will be around 1.2364, where the 173.2% Fibonacci extension is. However, if this support is broken, we’ll likely see a realization of our Thursday’s scenario:
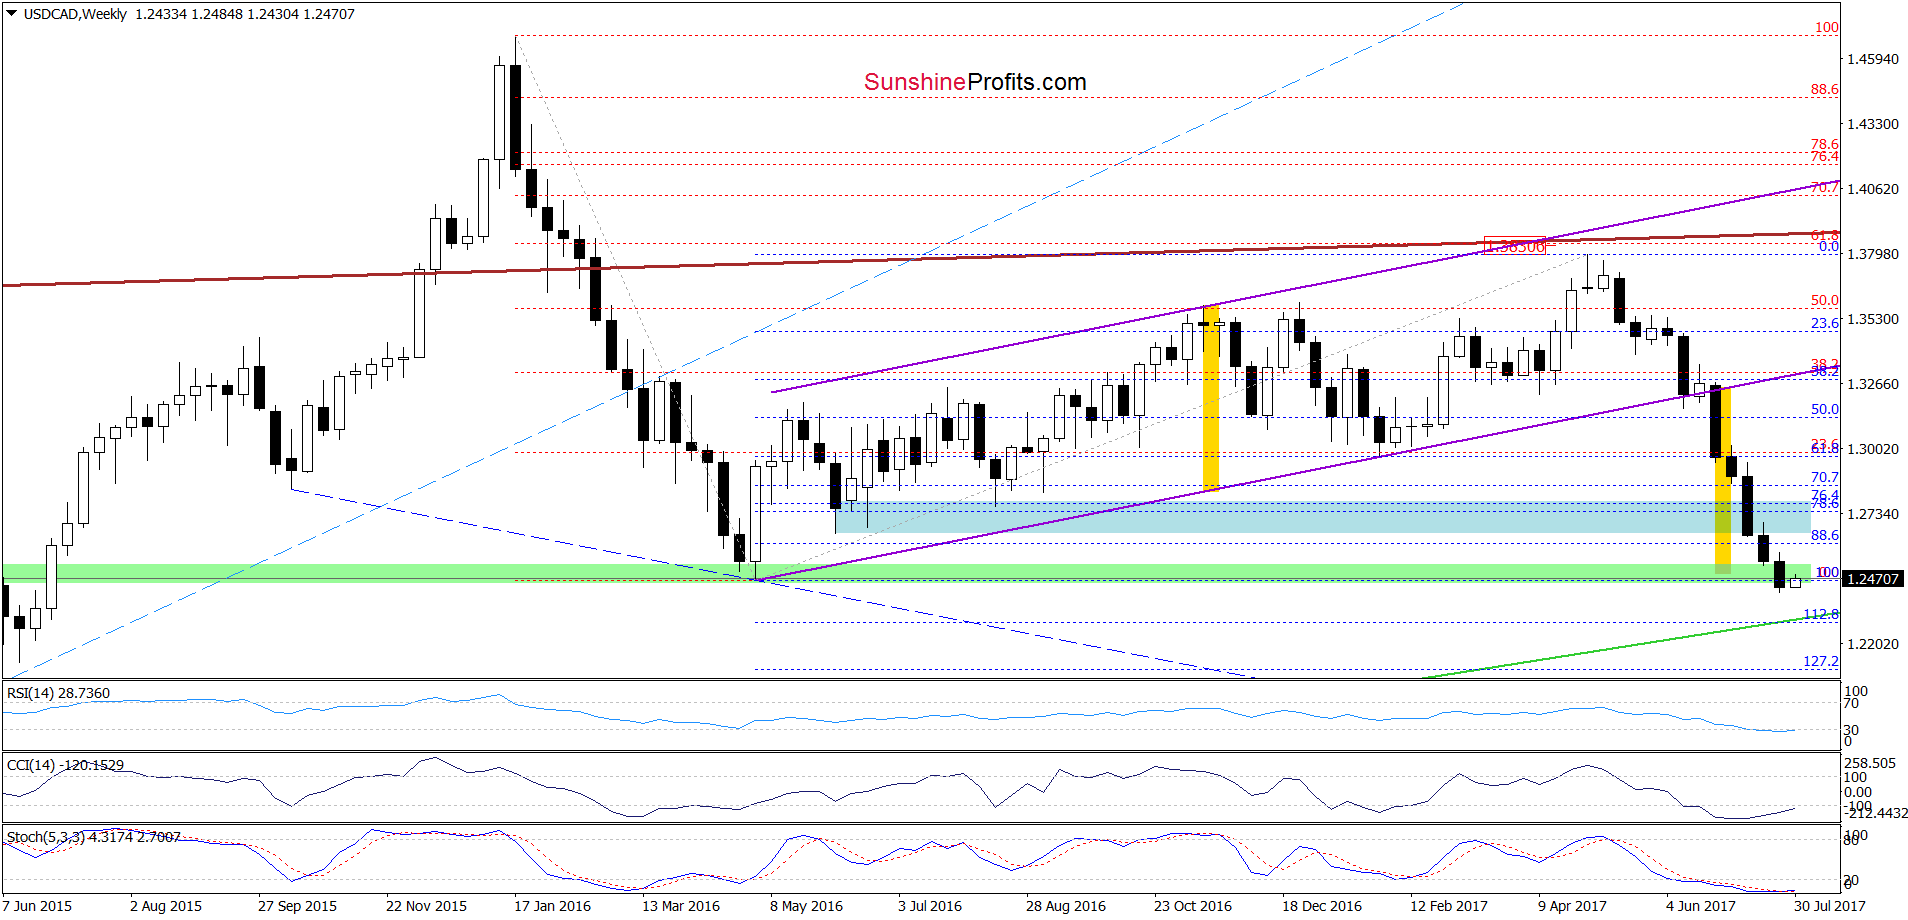
(…) USD/CAD dropped below the green support area and the May 2015 low, which is a negative event and suggests a test of the 112.8% Fibonacci extension and the long-term green support line (based on the September 2012, January, May, September 2013 and June 2014 lows) in the coming days. Nevertheless, taking into account the importance of this support line (it stopped currency bears five times in the past) and the current position of the daily and weekly indicators, we think that reversal an bigger move to the upside are just around the corner. Therefore if we see any reliable bullish factors on the horizon, we’ll consider opening long positions.
Very short-term outlook: mixed with bearish bias
Short-term outlook: mixed with bullish bias
MT outlook: mixed
LT outlook: mixed
Trading position (short-term; our opinion): No positions are justified from the risk/reward perspective at the moment. We will keep you informed should anything change, or should we see a confirmation/invalidation of the above.
On an administrative note, there will be no regular Forex Trading Alert on Thursday and Friday, but if the situation changes dramatically, we will send you a quick note with our latest analysis and thoughts on that matter.
Thank you.
Nadia Simmons
Forex & Oil Trading Strategist
Przemyslaw Radomski, CFA
Founder, Editor-in-chief, Gold & Silver Fund Manager
Gold & Silver Trading Alerts
Forex Trading Alerts
Oil Investment Updates
Oil Trading Alerts

