

Yesterday, the British pound moved higher against the greenback, hitting a fresh July peak. Despite this improvement, the major resistance area stopped currency bulls, triggering a pullback. Will they manage to break above it in the coming days?
In our opinion the following forex trading positions are justified - summary:
- EUR/USD: short (a stop-loss order at 1.1803; the initial downside target at 1.1408)
- GBP/USD: short (a stop-loss order at 1.3272; the initial downside target at 1.2375)
- USD/JPY: none
- USD/CAD: none
- USD/CHF: none
- AUD/USD: none
EUR/USD
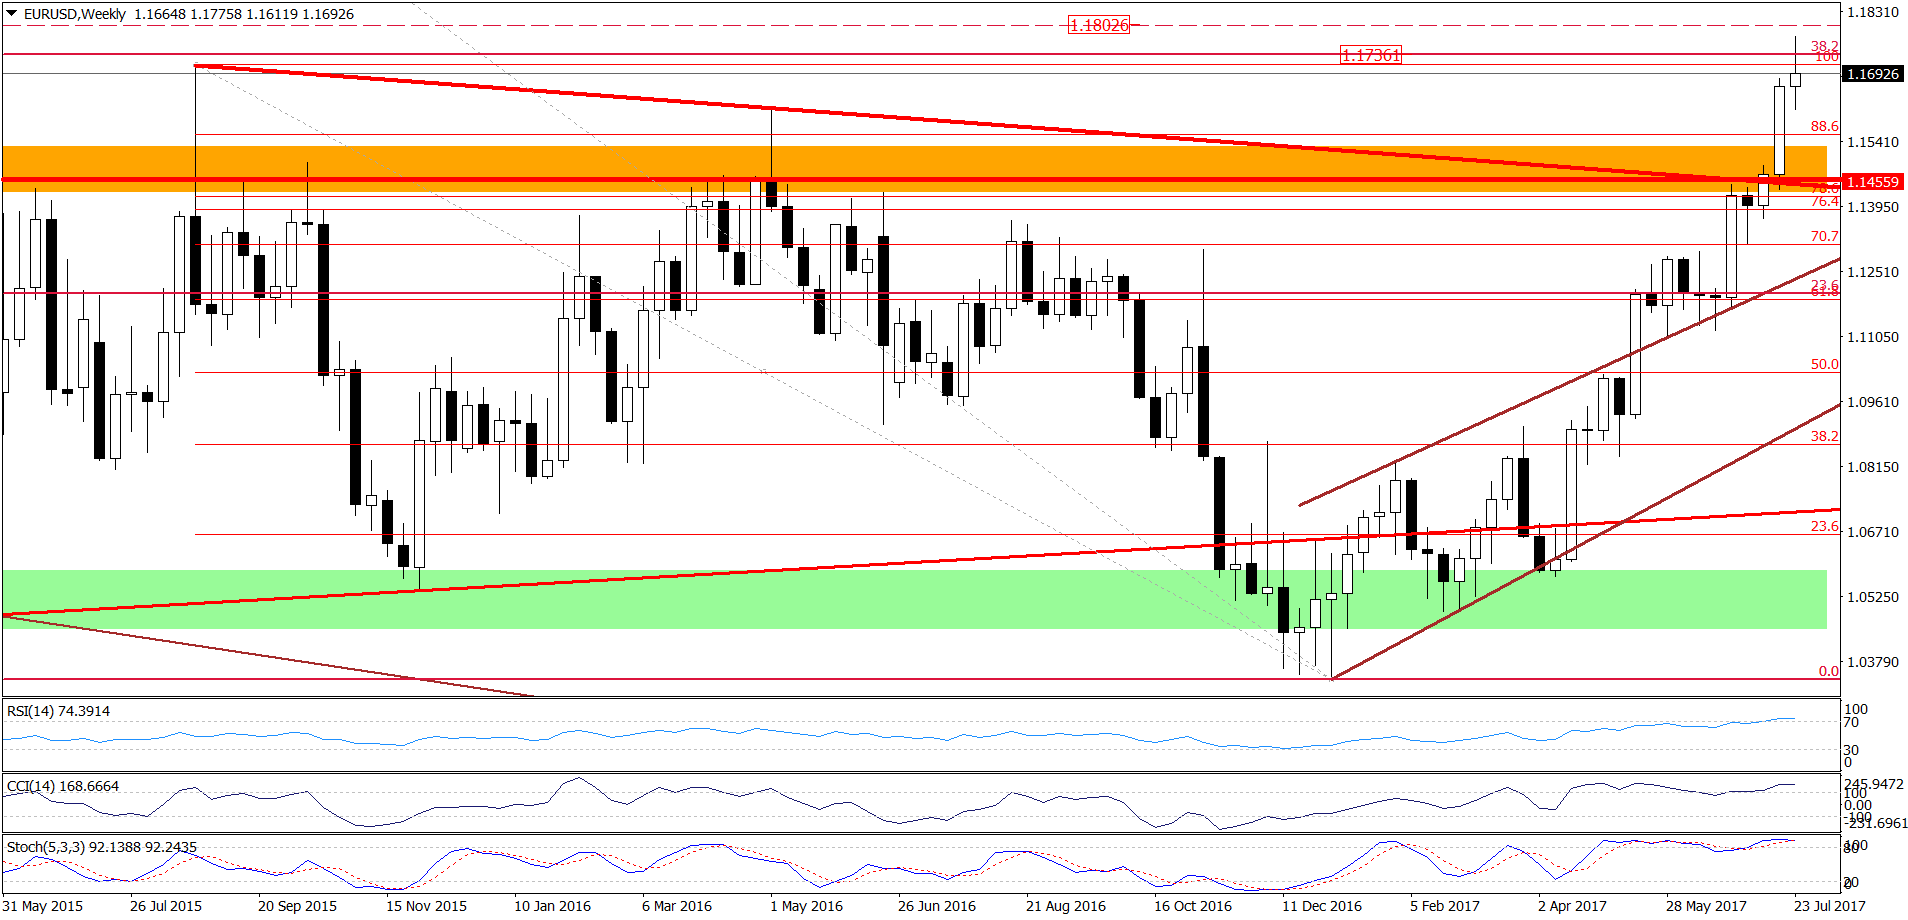
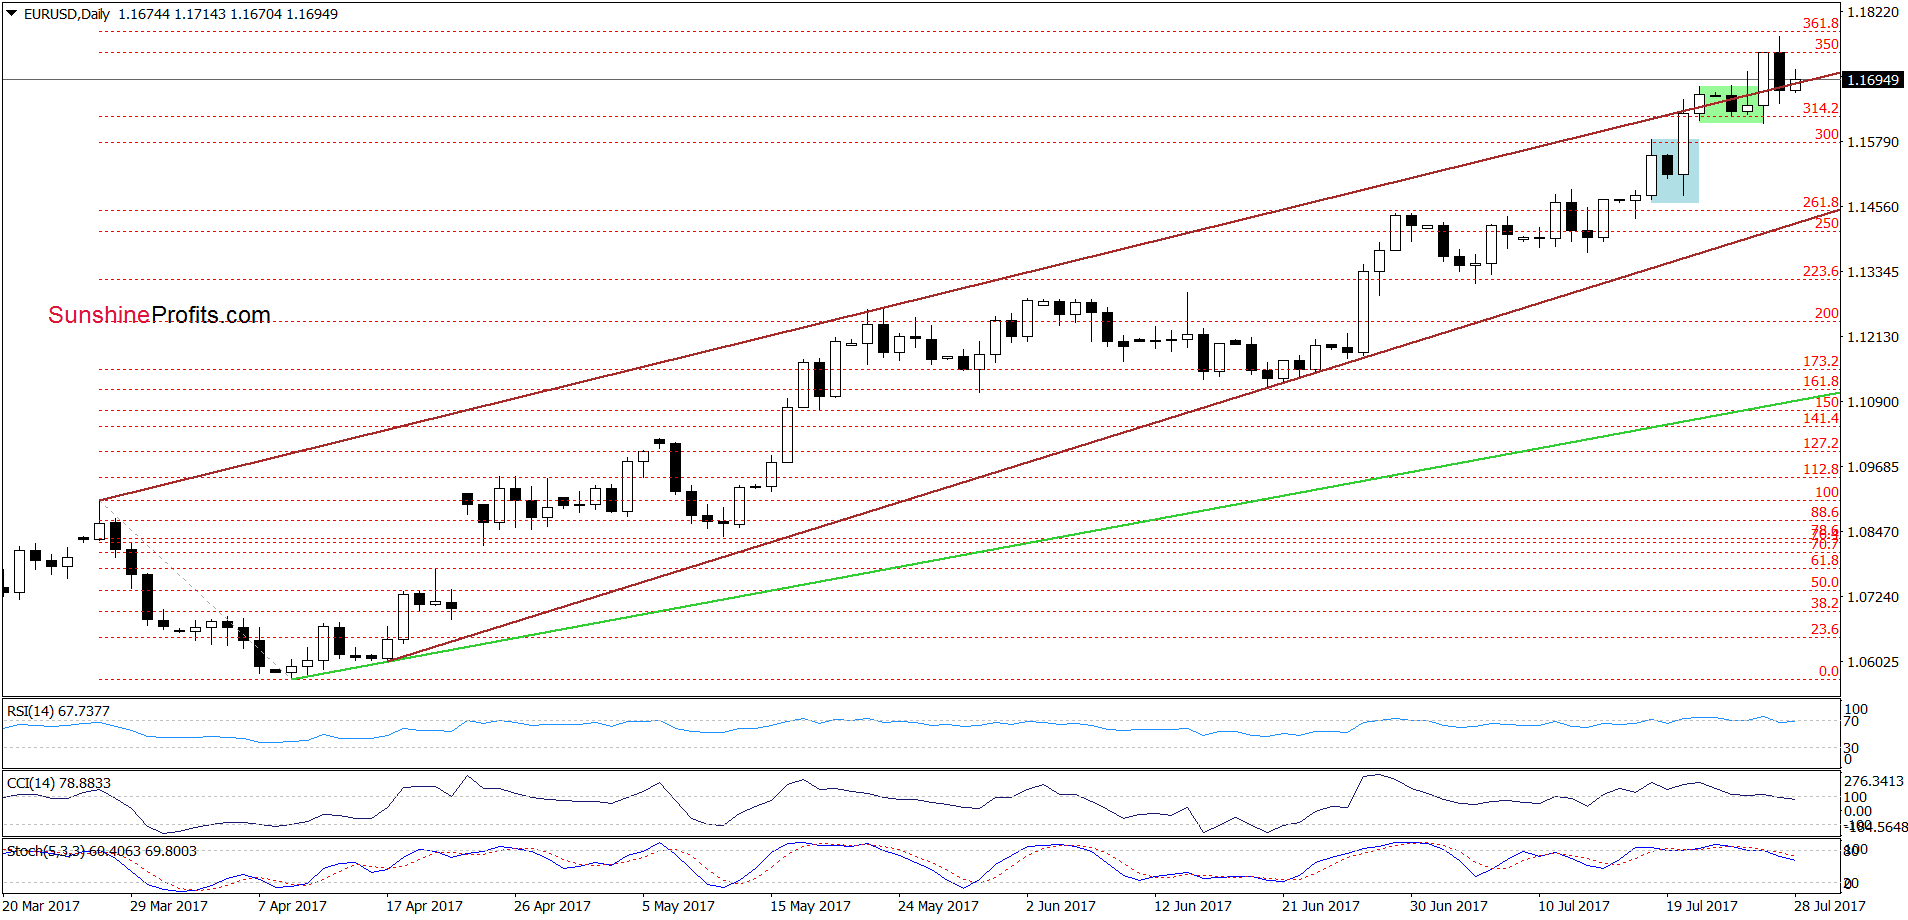
On the daily chart, we see that EUR/USD closed yesterday’s session under the brown rising trend channel, which was a bearish development. However, earlier today, currency bulls pushed the pair higher and the exchange rate came back above this line, which suggests that we’ll likely see a test of the recent high and major resistances - the August 2015 peak and the 38.2% Fibonacci retracement (both seen on the weekly chart) later in the day. Nevertheless, as long as there is no weekly closure above them another attempt to move lower is very likely – especially when we factor in the sell signals generated by the daily indicators and the position of the weekly indicators.
Very short-term outlook: mixed with barish bias
Short-term outlook: bearish
MT outlook: mixed
LT outlook: mixed
Trading position (short-term; our opinion): Short positions (with a stop-loss order at 1.1803 and the initial downside target at 1.1408) are justified from the risk/reward perspective. We will keep you informed should anything change, or should we see a confirmation/invalidation of the above.
GBP/USD
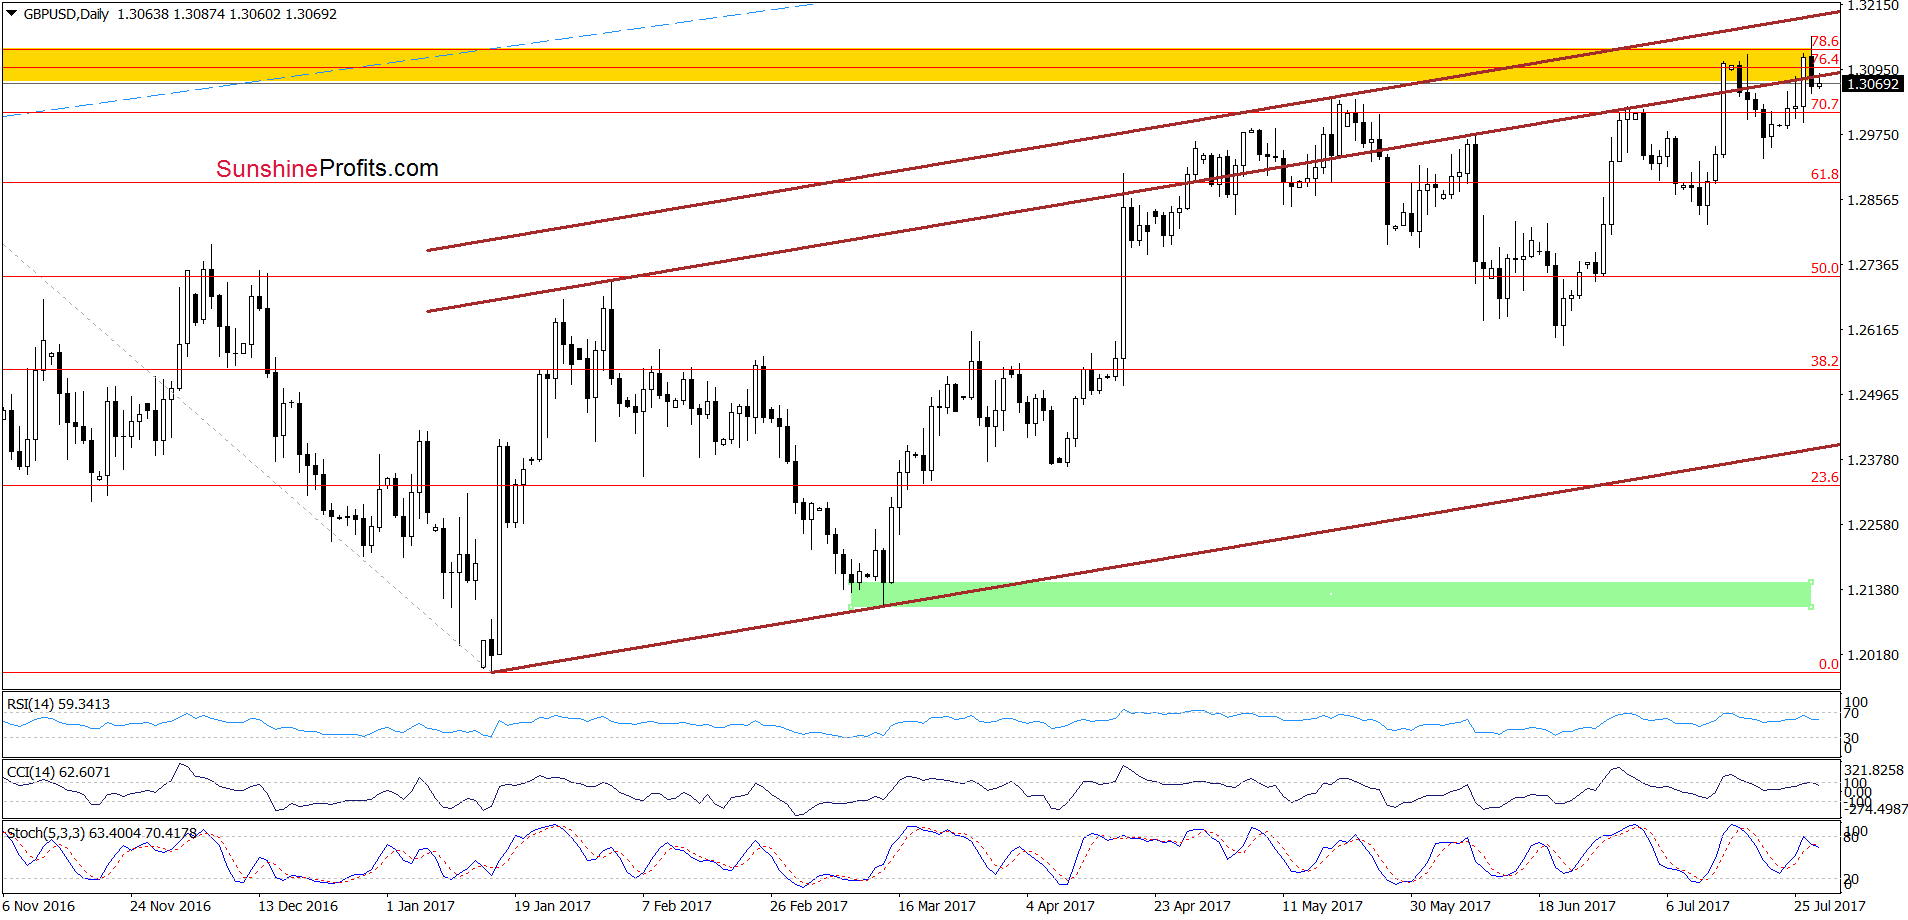
Yesterday, GBP/USD extended gains, which resulted in a fresh July peak. Despite this improvement, the yellow resistance zone stopped further improvement, triggering a pullback. Thanks to this drop, the exchange rate closed yesterday’s session under the previously-broken upper border of the brown rising trend channel, invalidating the earlier breakout. Additionally, the CCI and the Stochastic Oscillator generated the sell signals, increasing the probability of further declines in the coming days. Therefore, in our opinion, as long as there is no breakout above the above-mentioned major resistance area another attempt to move lower is very likely. If this is the case and we’ll see a decline from current levels, the next downside target for currency bears will be the mid-July or even late June low.
Very short-term outlook: bearish
Short-term outlook: mixed with bearish bias
MT outlook: mixed
LT outlook: mixed
Trading position (short-term; our opinion): Short positions (with a stop-loss order at 1.3272 and the initial downside target at 1.2375) are justified from the risk/reward perspective. We will keep you informed should anything change, or should we see a confirmation/invalidation of the above.
AUD/USD
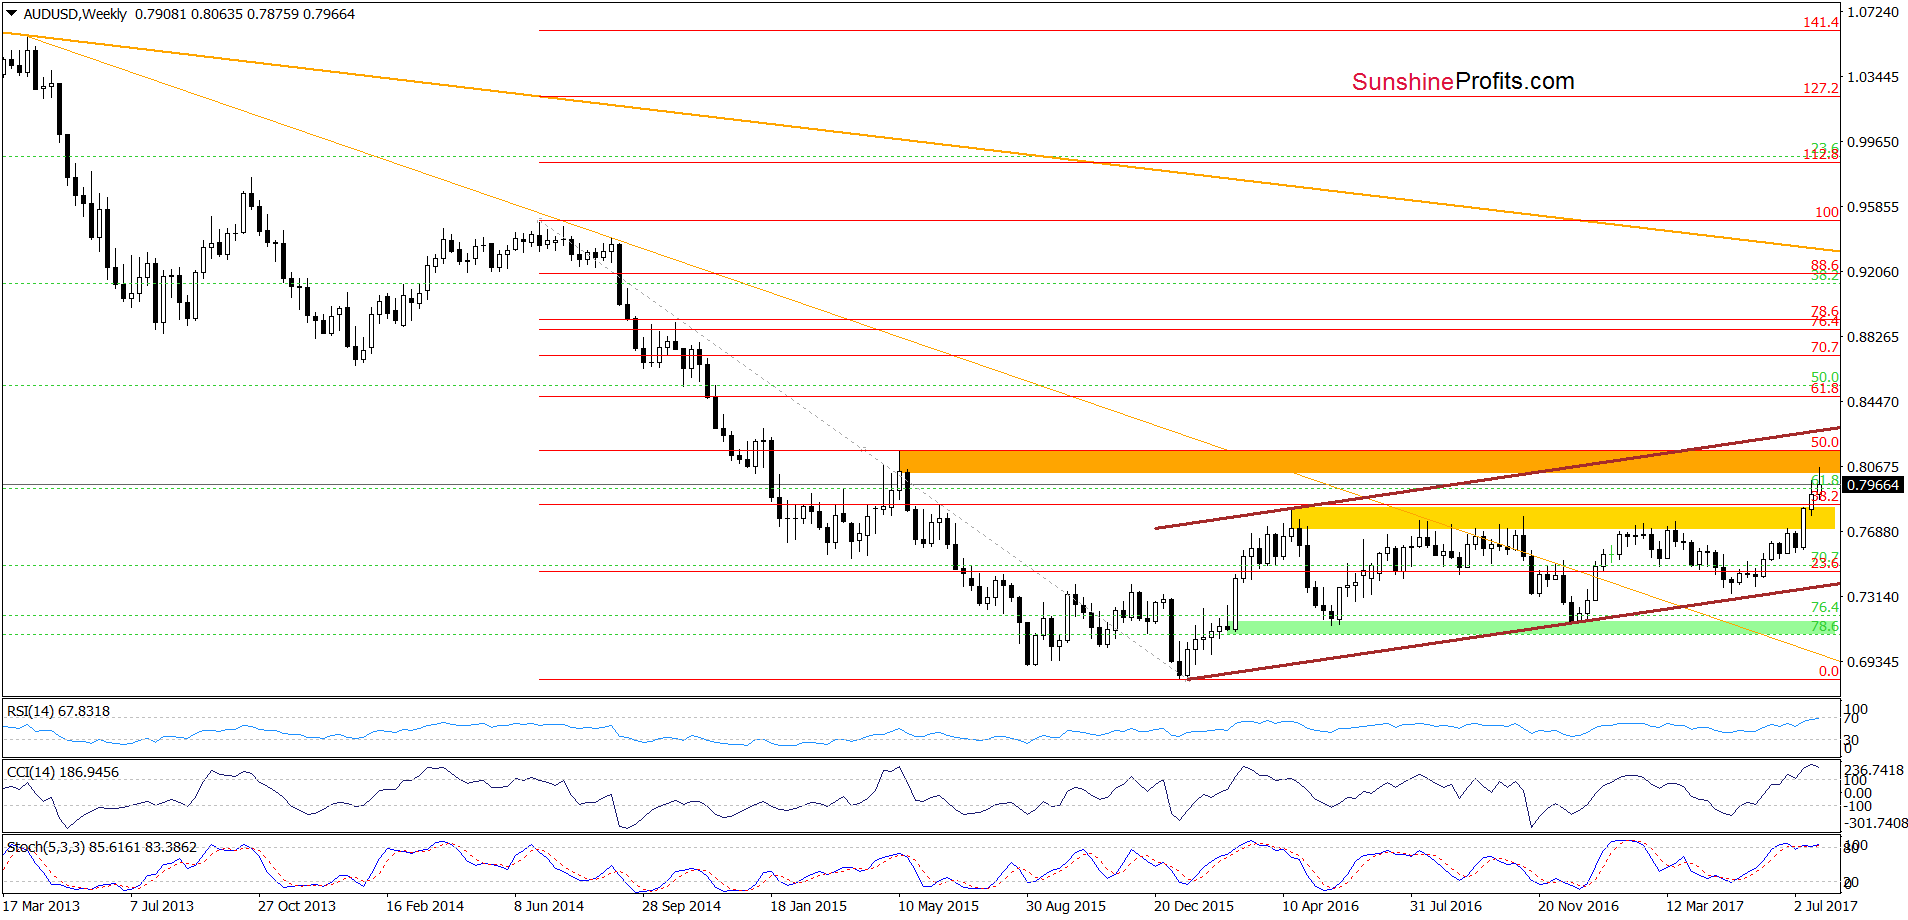
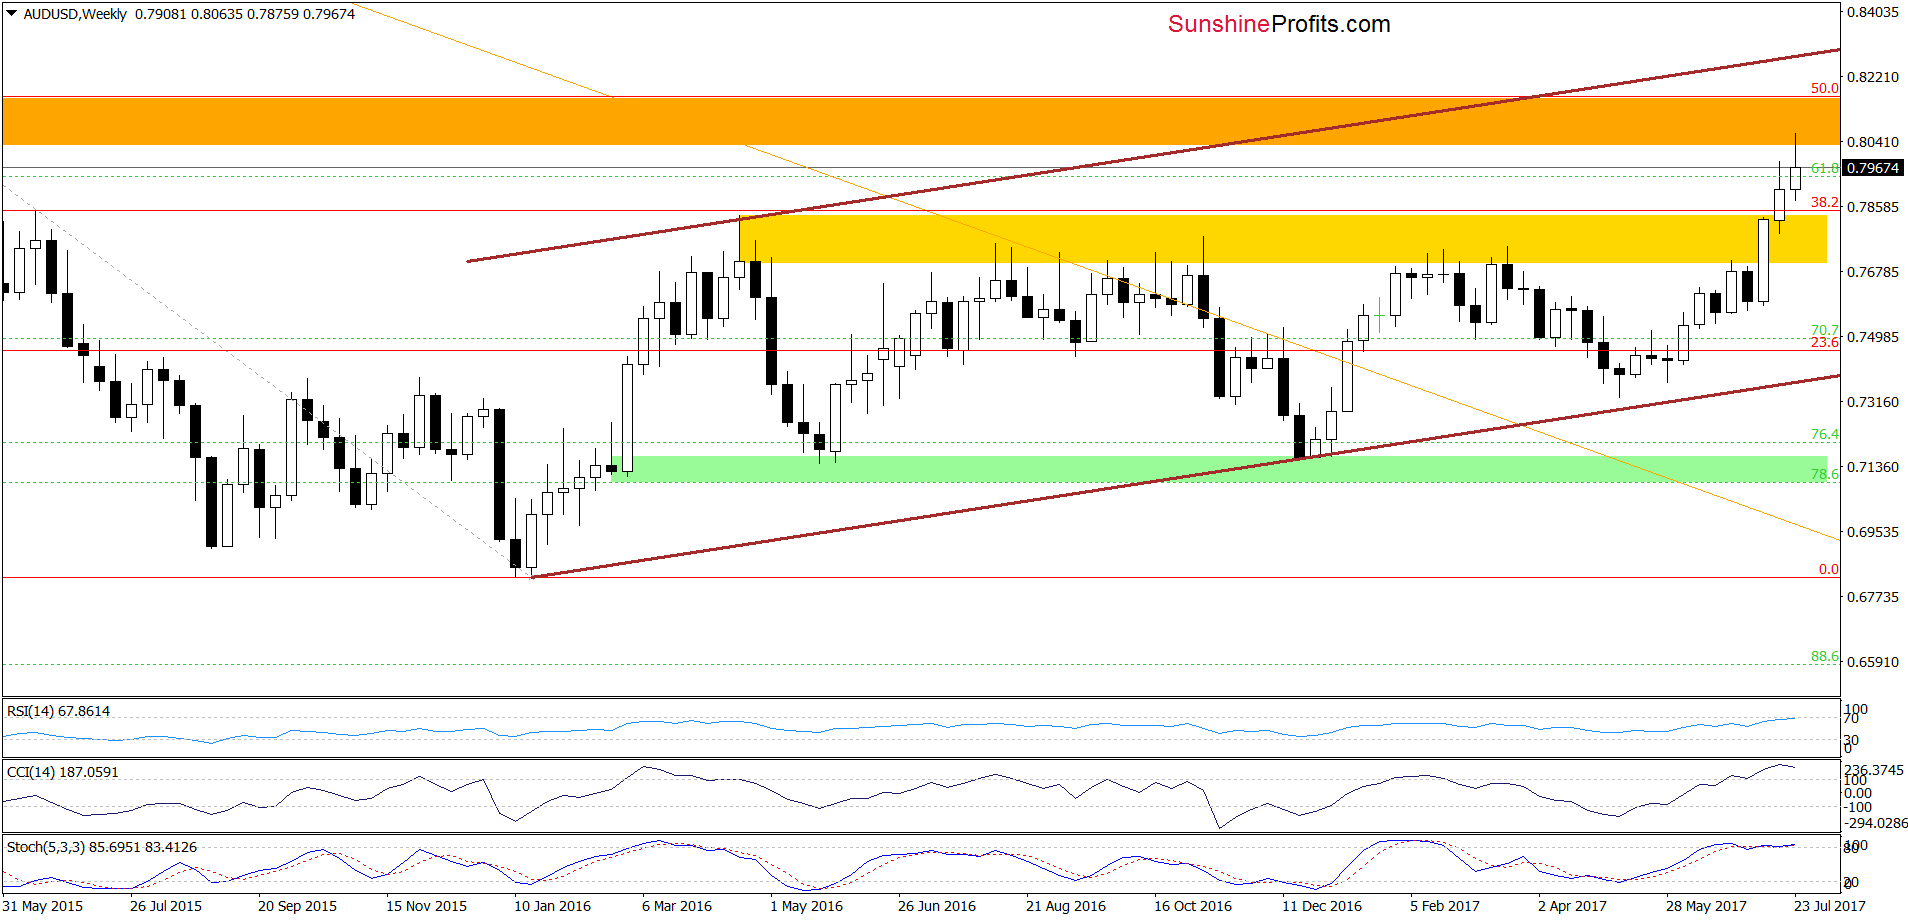
Looking at the weekly chart, we see that AUD/USD extended gains and climbed to the orange resistance zone (created by the 50% Fibonacci retracement and May 2015 highs), which triggered a pullback.
How did this price action affect the very short-term picture? Let’s check.
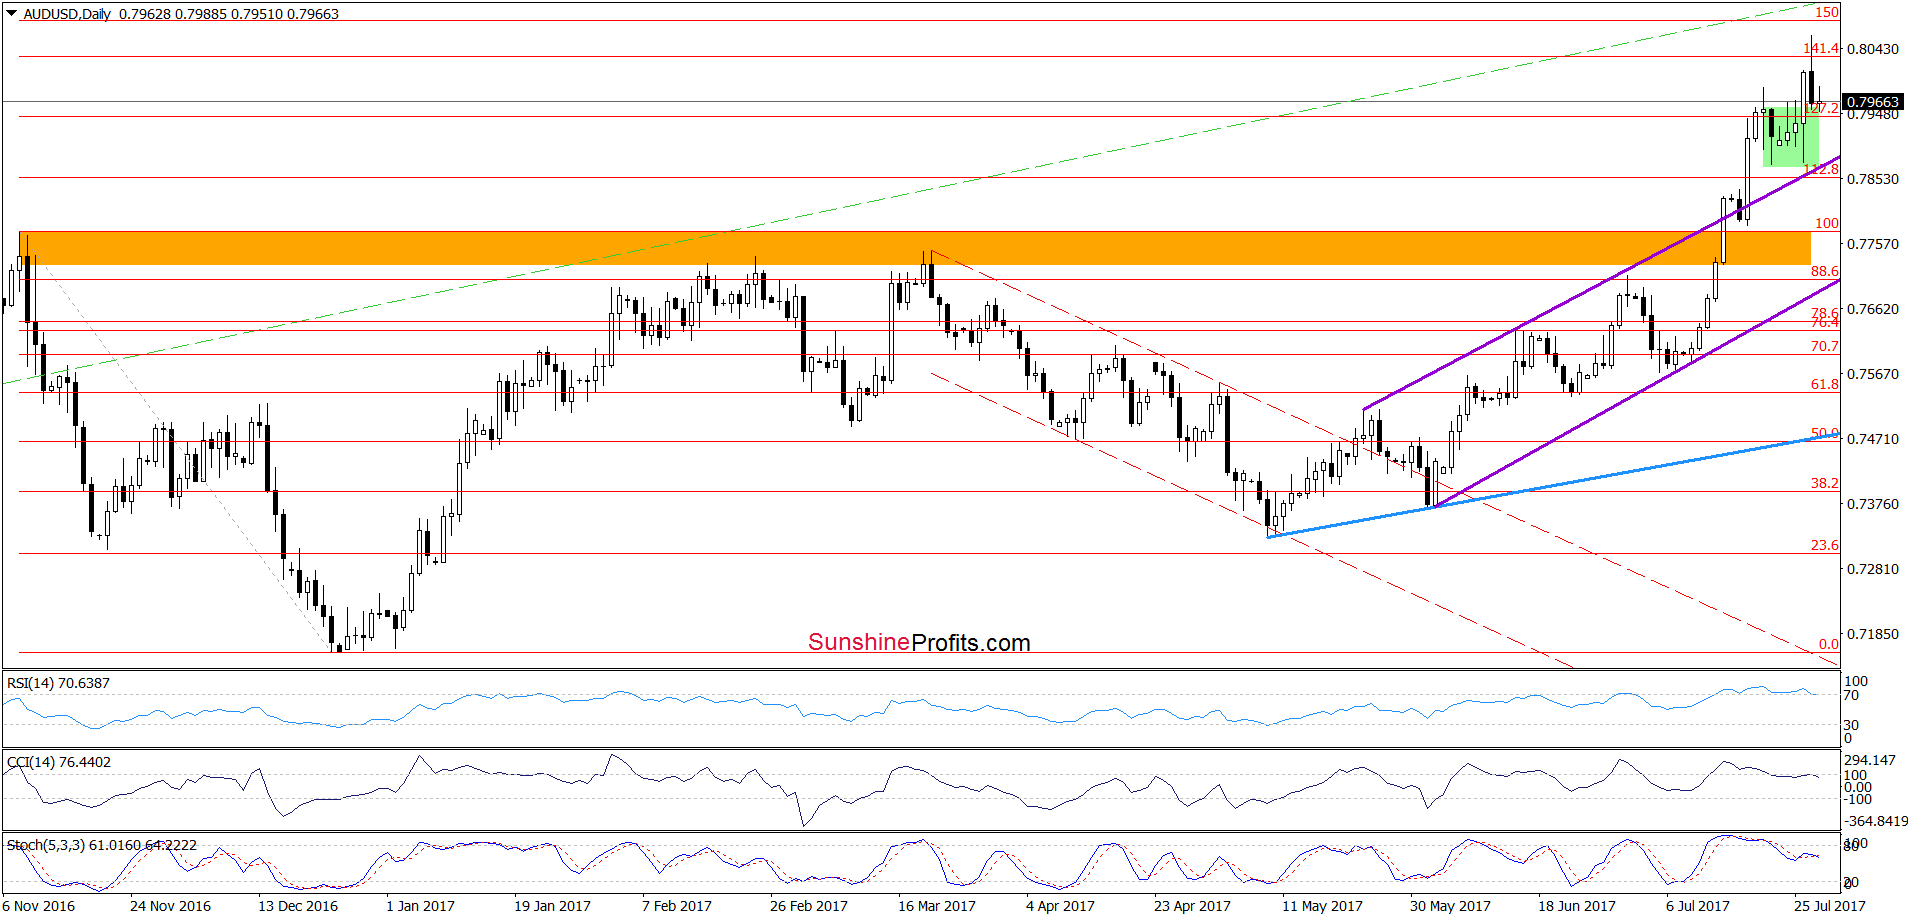
From this perspective, we see that although AUD/USD broke above the upper border of the green consolidation the earlier mentioned resistance zone together with the 141.4% Fibonacci extension encouraged currency bears to act, which resulted in a decline to the previously-broken upper line of the green consolidation. What’s next? On one hand, such price action looks like a verification of the earlier breakout, which would be a positive event. However, on the other hand, the sell signals generated by the daily indicators and the current position of the weekly indicators suggest that reversal and bigger declines are just around the corner. Connecting the dots, in our opinion, as long as there is no breakout above the orange resistance zone, the way to higher levels is closed. Nevertheless, as long as there is no invalidation of the breakout above the upper line of the trend channel and the breakdown below the lower border of the green consolidation, bigger decline is also not likely to be seen. Therefore, waiting at the sidelines for more valuable clues about future moves is justified from the risk/reward perspective.
Very short-term outlook: mixed with bearish bias
Short-term outlook: mixed with bearish bias
MT outlook: mixed
LT outlook: mixed
Trading position (short-term; our opinion): No positions are justified from the risk/reward perspective. We will keep you informed should anything change, or should we see a confirmation/invalidation of the above.
Thank you.
Nadia Simmons
Forex & Oil Trading Strategist
Przemyslaw Radomski, CFA
Founder, Editor-in-chief, Gold & Silver Fund Manager
Gold & Silver Trading Alerts
Forex Trading Alerts
Oil Investment Updates
Oil Trading Alerts

