

Although USD/JPY closed Friday’s session under the lower line of the rising formation, currency bulls showed their strength and invalidated this breakdown yesterday. Today's session, at least so far, has given additional pips to the buyers, but will the road to the north be as easy as it may seem at first glance?
In our opinion the following forex trading positions are justified - summary:
- EUR/USD: small short positions (a stop-loss order at 1. 2066; the initial downside target at 1.1850)
- GBP/USD: none
- USD/JPY: none
- USD/CAD: none
- USD/CHF: none
- AUD/USD: none
EUR/USD
Yesterday, we wrote the following:
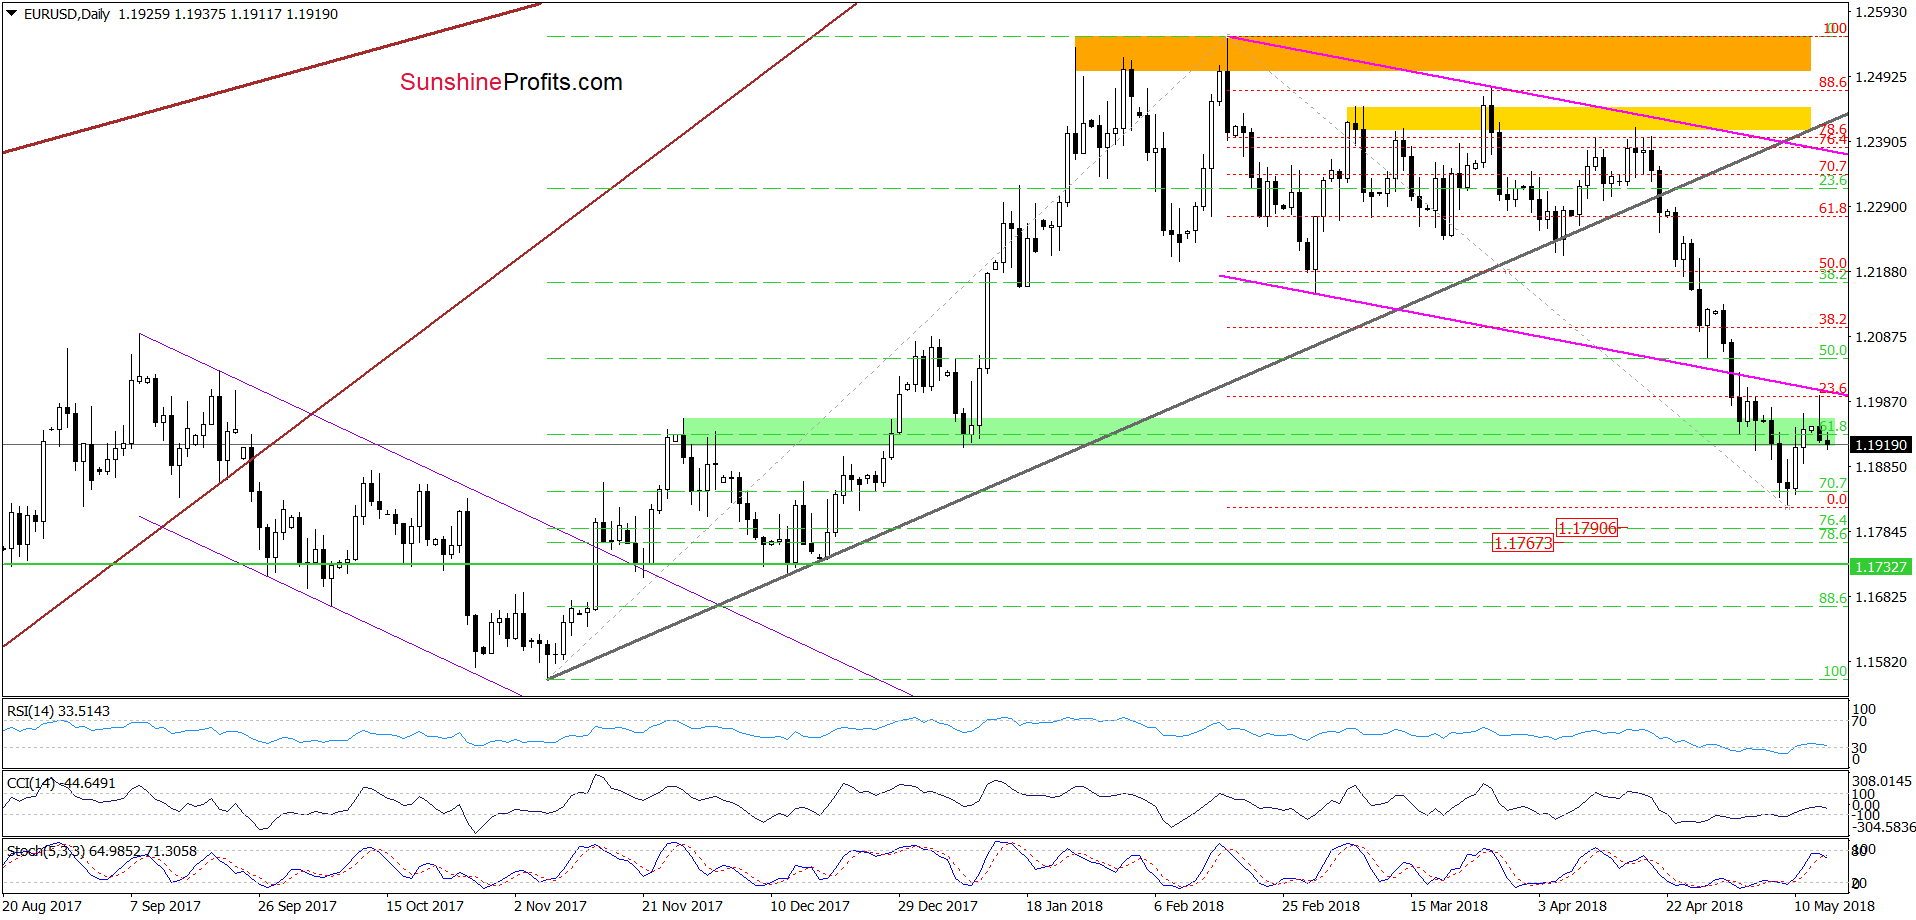
(...) EUR/USD extended Friday’s gains, but despite this move, the exchange rate is still trading under the previously-broken lower border of the pink declining trend channel. Additionally, the size of rebound is tiny (compared to the entire downward move that started in mid-February) as the pair didn’t even erased 23.6% of the earlier declines. These facts do not confirm currency bulls’ strength (…)
As you see on the above chart, currency bulls confirmed their weakness after our alert was posted, which resulted in a pullback and a comeback to the green zone. Additionally, earlier today, the Stochastic Oscillator generated a sell signal, which suggests that the worst may not be behind the buyers yet and another move to the downside is just around the corner.
If this is the case, and the exchange rate declines from current levels, we could see at least a test of the 70.7% Fibonacci retracement and the last week’s low. Nevertheless, if this support area is broken, the next target for the sellers will be around 1.1767-1.1790, where the support area created by the 76.4% and 78.6% retracements is.
Taking all the above into account, we think that opening small (50% of the regular size of the position) short positions is justified from the risk/reward perspective.
Trading position (short-term; our opinion): Small short positions (with a stop-loss order at 1. 2066 and the initial downside target at 1.1850) are justified from the risk/reward perspective. We will keep you informed should anything change, or should we see a confirmation/invalidation of the above.
GBP/USD
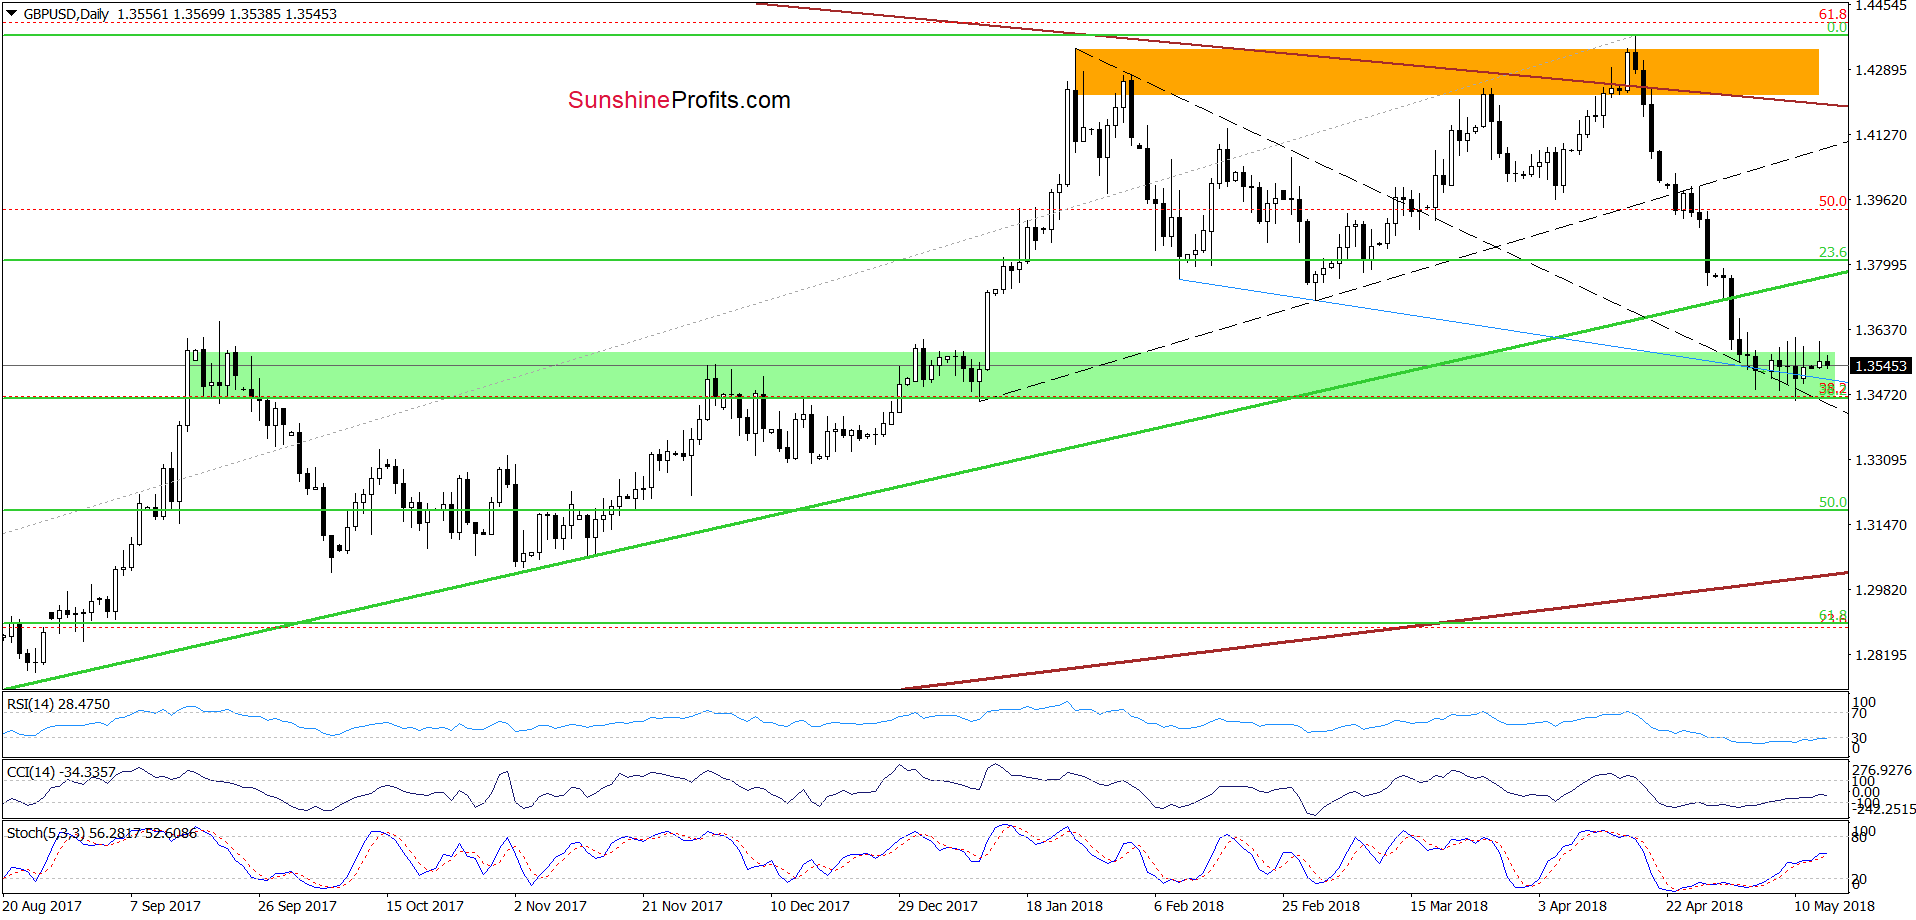
Looking at the daily chart, we see that GBP/USD continues its consolidation inside the green support zone, which means that what we wrote in our last commentary on this currency pair is up-to-date also today:
(…) GBP/USD wavers between tiny gains and losses around the green support zone created by the September, December and early January highs.
Additionally, this area is also reinforced by the 38.2% Fibonacci retracement (based on the entire 2017-2018 upward move), the blue support line based on the previous lows and the upper line of the black triangle (marked with dashed lines) which together continue to keep declines in check.
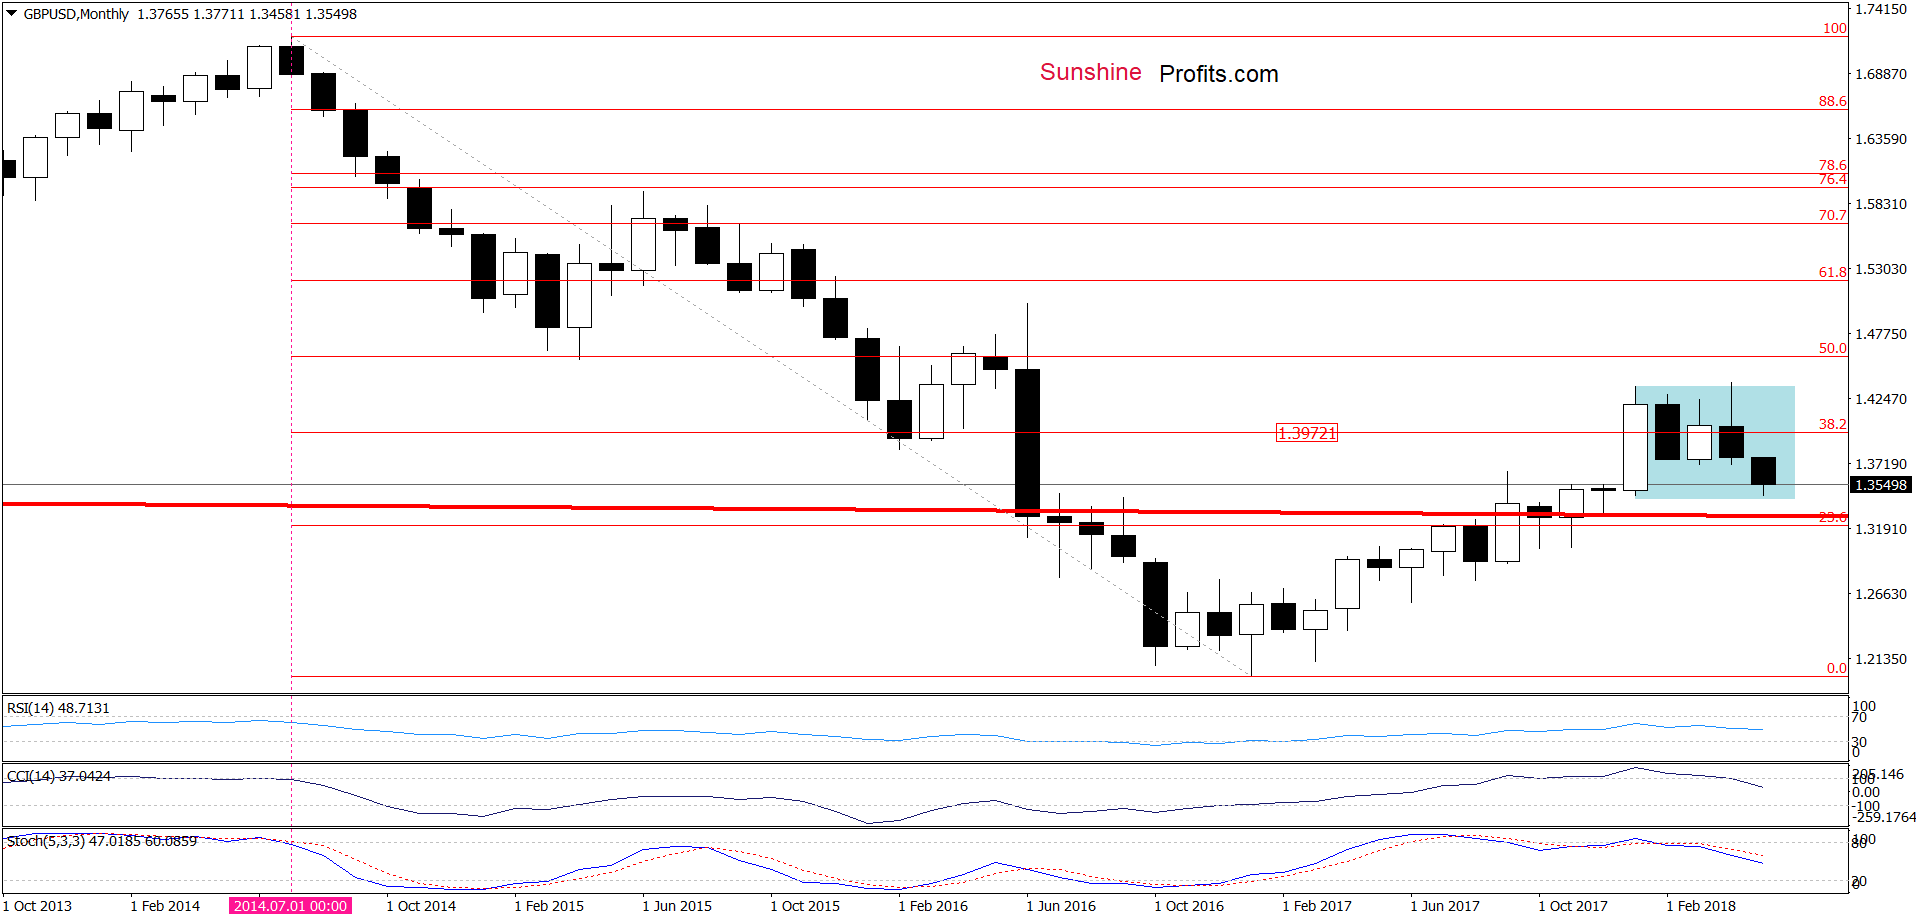
On top of that, when we take a closer look at the long-term chart below, we can notice that the pair is also trading in a consolidation (marked with blue), which increases the probability that we won’t see a bigger move to the downside as long as currency bears manage to break successfully under the lower border of the formation.
Trading position (short-term; our opinion): No positions are justified from the risk/reward perspective. We will keep you informed should anything change, or should we see a confirmation/invalidation of the above.
USD/JPY
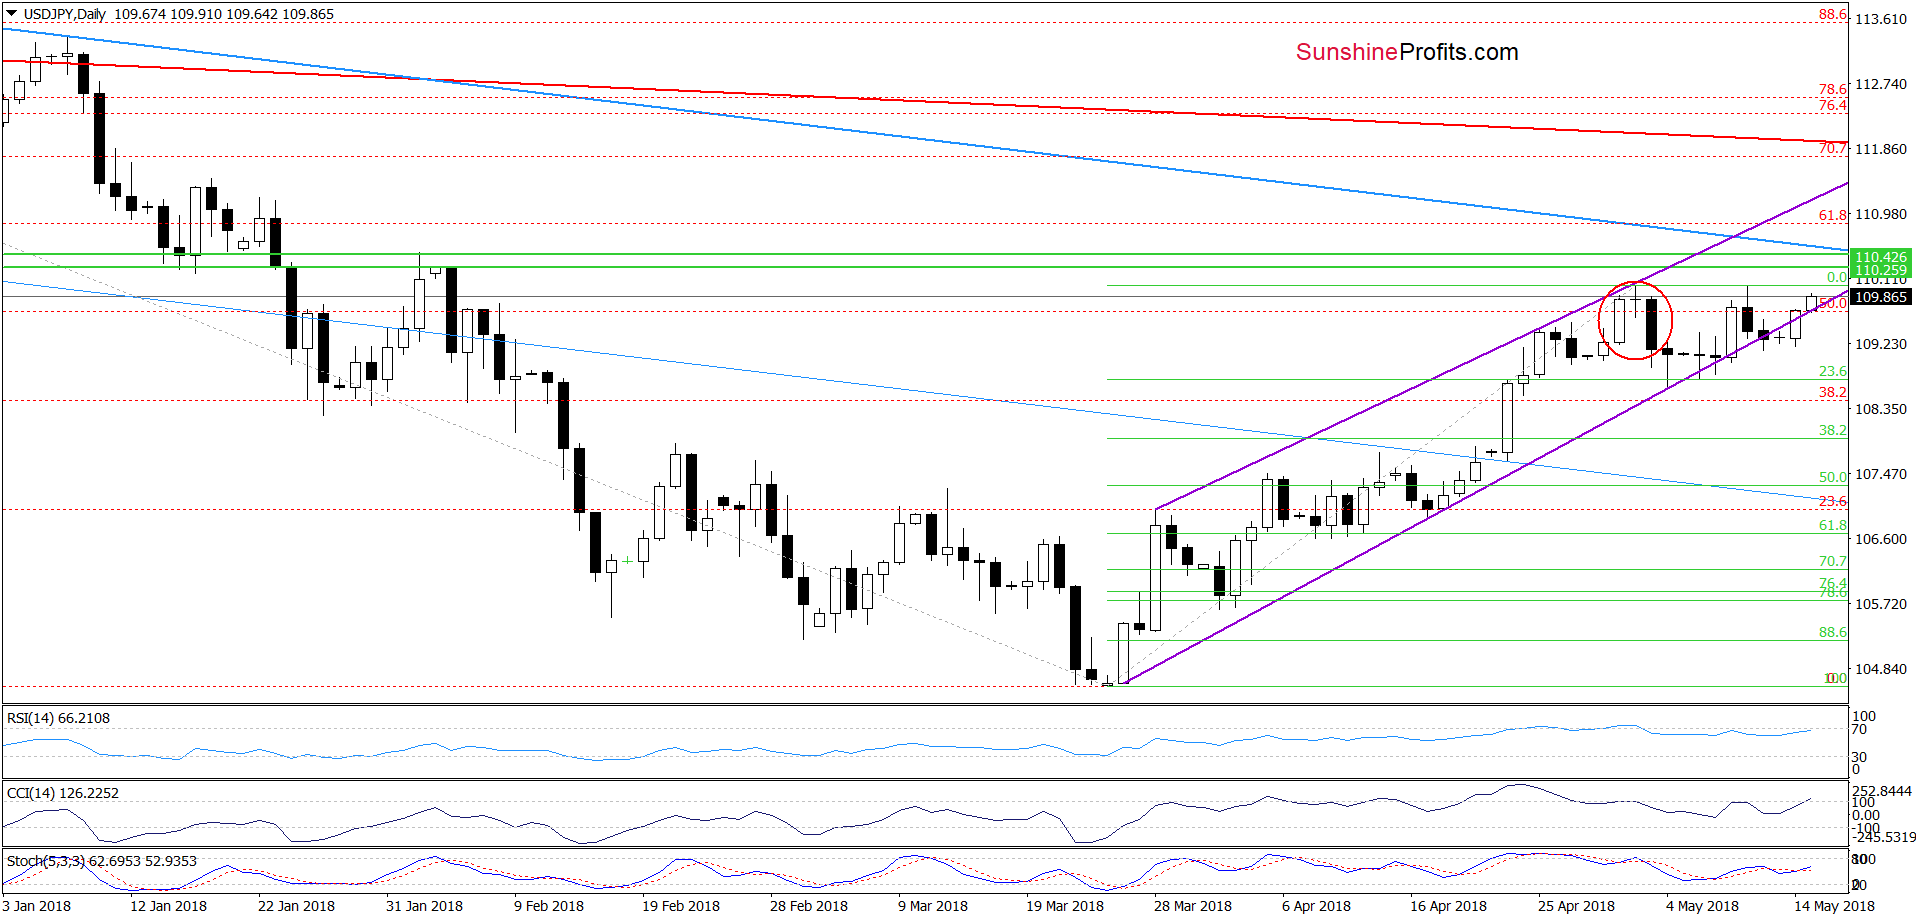
The first thing that catches the eye on the daily chart is an invalidation of the earlier breakdown under the lower border of the purple rising wedge. Although this is a positive event, we should keep in mind that we saw similar situation almost a week ago.
Back then currency bulls didn’t manage to go higher and break above early May peak, which resulted in a pullback and a re-test of the above-mentioned formation. What’s interesting, such situation took place despite the fact that the buyers had buy signals on their side, which suggests that currency bulls may not be as strong as it may seem at the first sight.
Therefore, we think that as long as there is no successful breakout above February highs (we marked them with green horizontal lines) and the blue declining resistance line, which currently intersects the nearest resistance area another bigger move to the upside is questionable. In other words, the situation is too unclear to open any position now.
So, when will we consider opening long positions? If USD/JPY breaks above the above-mentioned resistance zone. When will we consider opening short positions? If we see a confirmed breakdown under the lower border of the purple rising wedge. We will keep you informed should anything change, or should we see a confirmation/invalidation of the above.
Trading position (short-term; our opinion): No positions are justified from the risk/reward perspective.
Thank you.
Nadia Simmons
Forex & Oil Trading Strategist
Przemyslaw Radomski, CFA
Founder, Editor-in-chief, Gold & Silver Fund Manager
Gold & Silver Trading Alerts
Forex Trading Alerts
Oil Investment Updates
Oil Trading Alerts

