

Mid-December highs, the long-term support line, Fibonacci retracements, bearish divergences and something interesting, which enriched oil bears. How to put these puzzles together to read the future of the greenback and several of our currency pairs?
In our opinion the following forex trading positions are justified - summary:
Focus on the USD Index
Before we analyze our currency pairs, let’s take a closer look at recent changes in the USD Index.
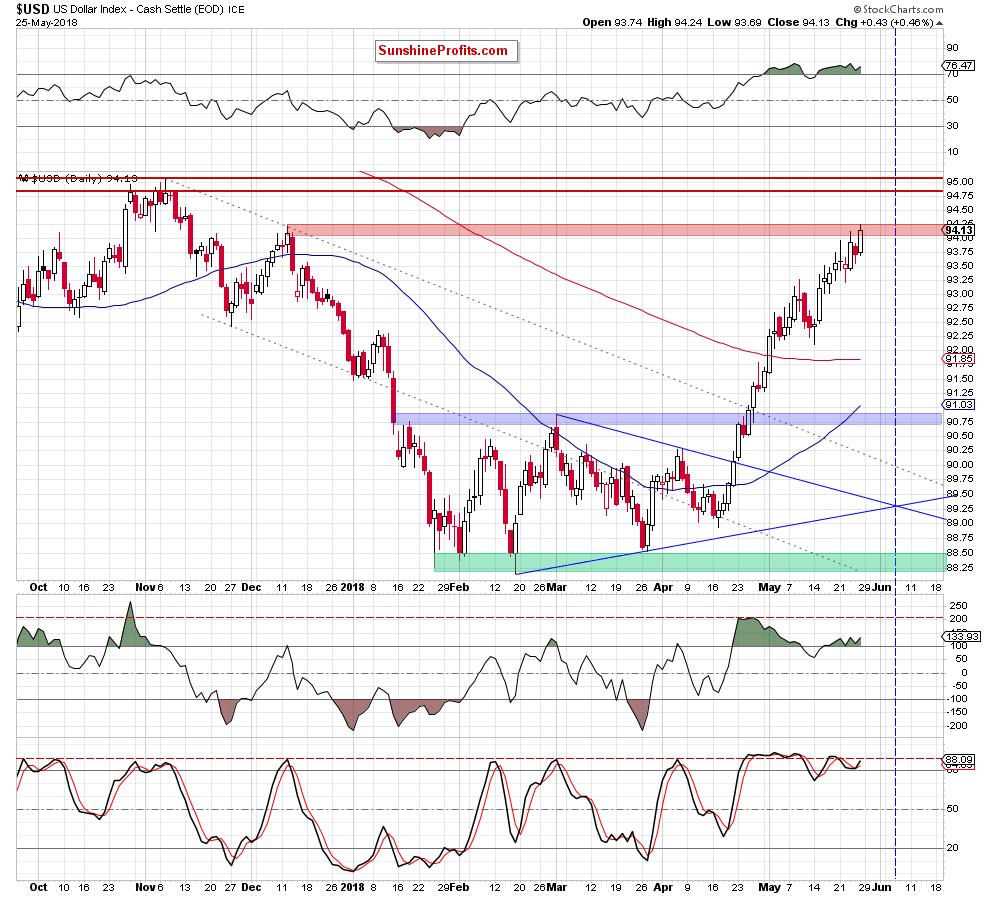
Looking at the daily chart, we see that the greenback extended gains on Friday and climbed to the red resistance area created by the mid-December highs, which is the last stop before the November peaks.
Will we see the attack on higher levels?
Bearish divergences between daily indicators and the USD Index in combination with the current position of these indicators (they all remain in their overbought areas) suggests that reversal is just around the corner.
Nevertheless, the intersection of the of the arms of the blue triangle (created by the support line based on the February and March lows and the resistance line based on the early March and April highs) will take place next week, which suggests that until this time (June 6/June 7, 2018) one more move to the upside can’t be ruled out (even if we see a pullback first as the red resistance zone could encourage the sellers to act).
At this point, it is worth noting that similar intersection (and its consequences) you could notice in the previous week on the crude oil chart. It was very important confirmation of the trend reversal and those who follow our Oil Trading Alerts are probably quite happy today that we find such “quirks” as triangle apex reversals on the charts.
Therefore, taking all the above into account, we think that waiting on the sidelines for a confirmation/invalidation of the above is justified from the risk/reward perspective – especially when we factor in the current situation in many currency pairs. Let’s examine them.
EUR/USD
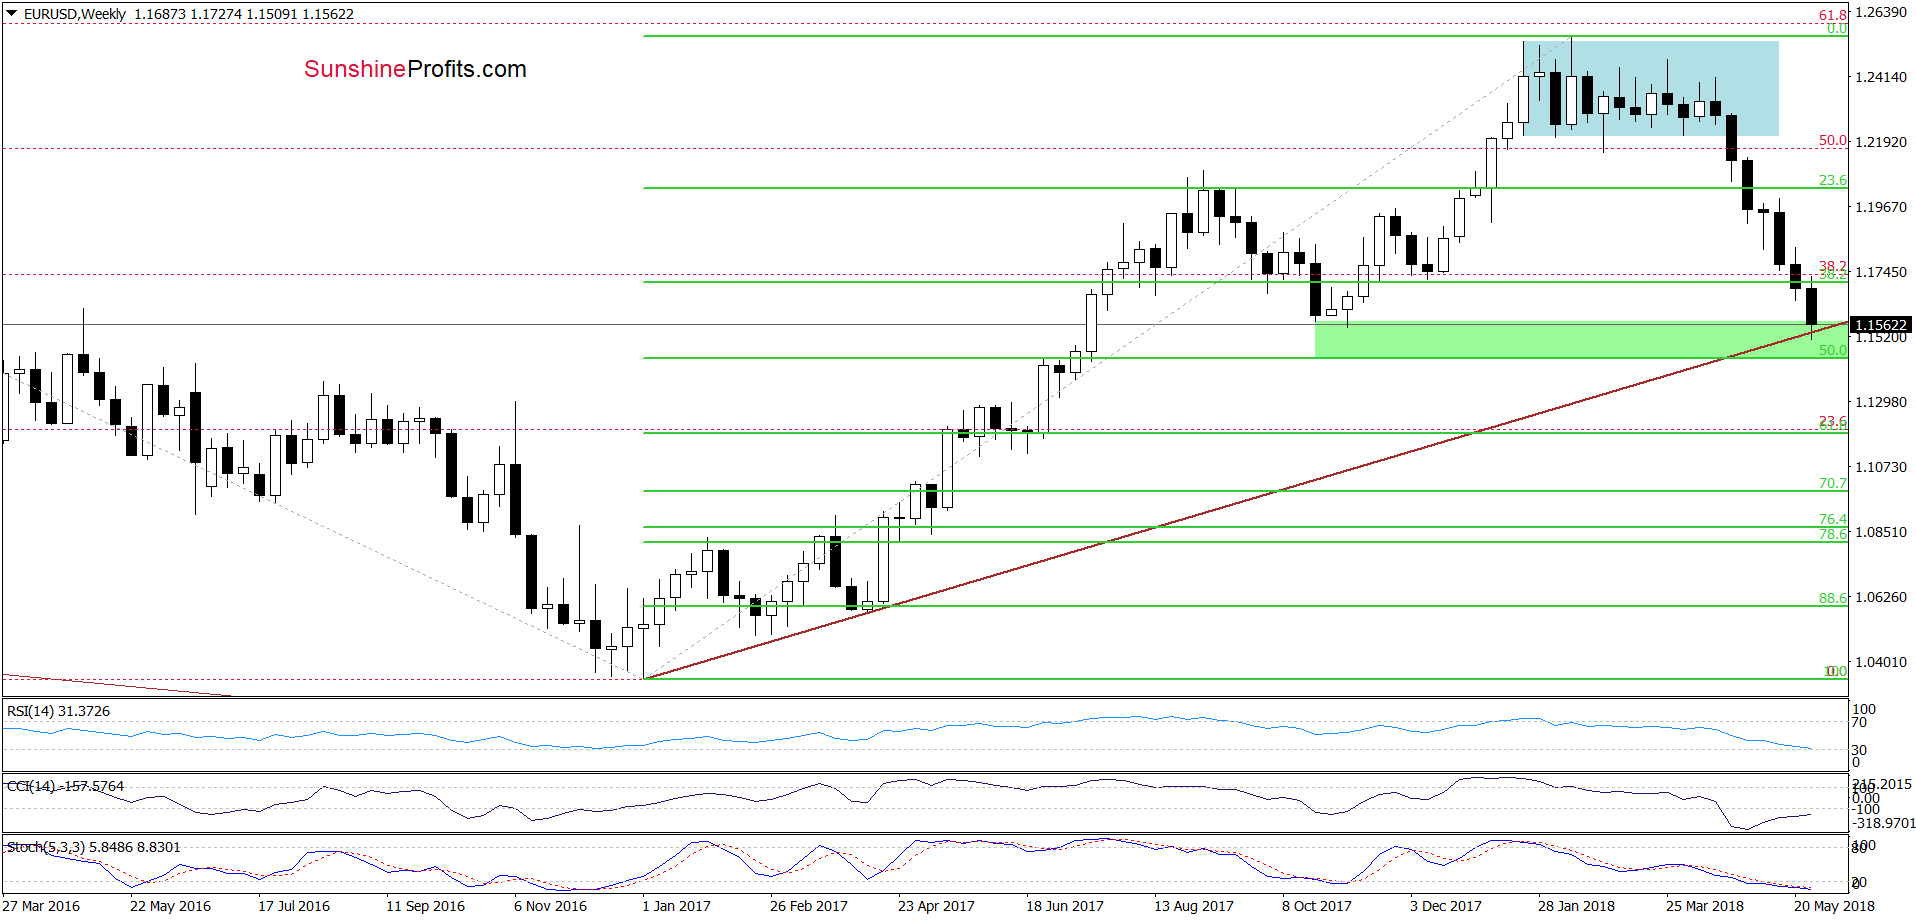
On the weekly chart of EUR/USD we see that the exchange rate slipped to the green support zone created by the late October and early November 2017 lows, the long-term brown rising support line and the 50% Fibonacci retracement, which together could encourage currency bulls to act and trigger a rebound in the coming days. Such price action would likely result in a pullback in the case of USD Index, which is in line with our above-mentioned assumptions.
Similar situation, we can also notice in the case of GBP/USD. Let’s take a look below.
GBP/USD
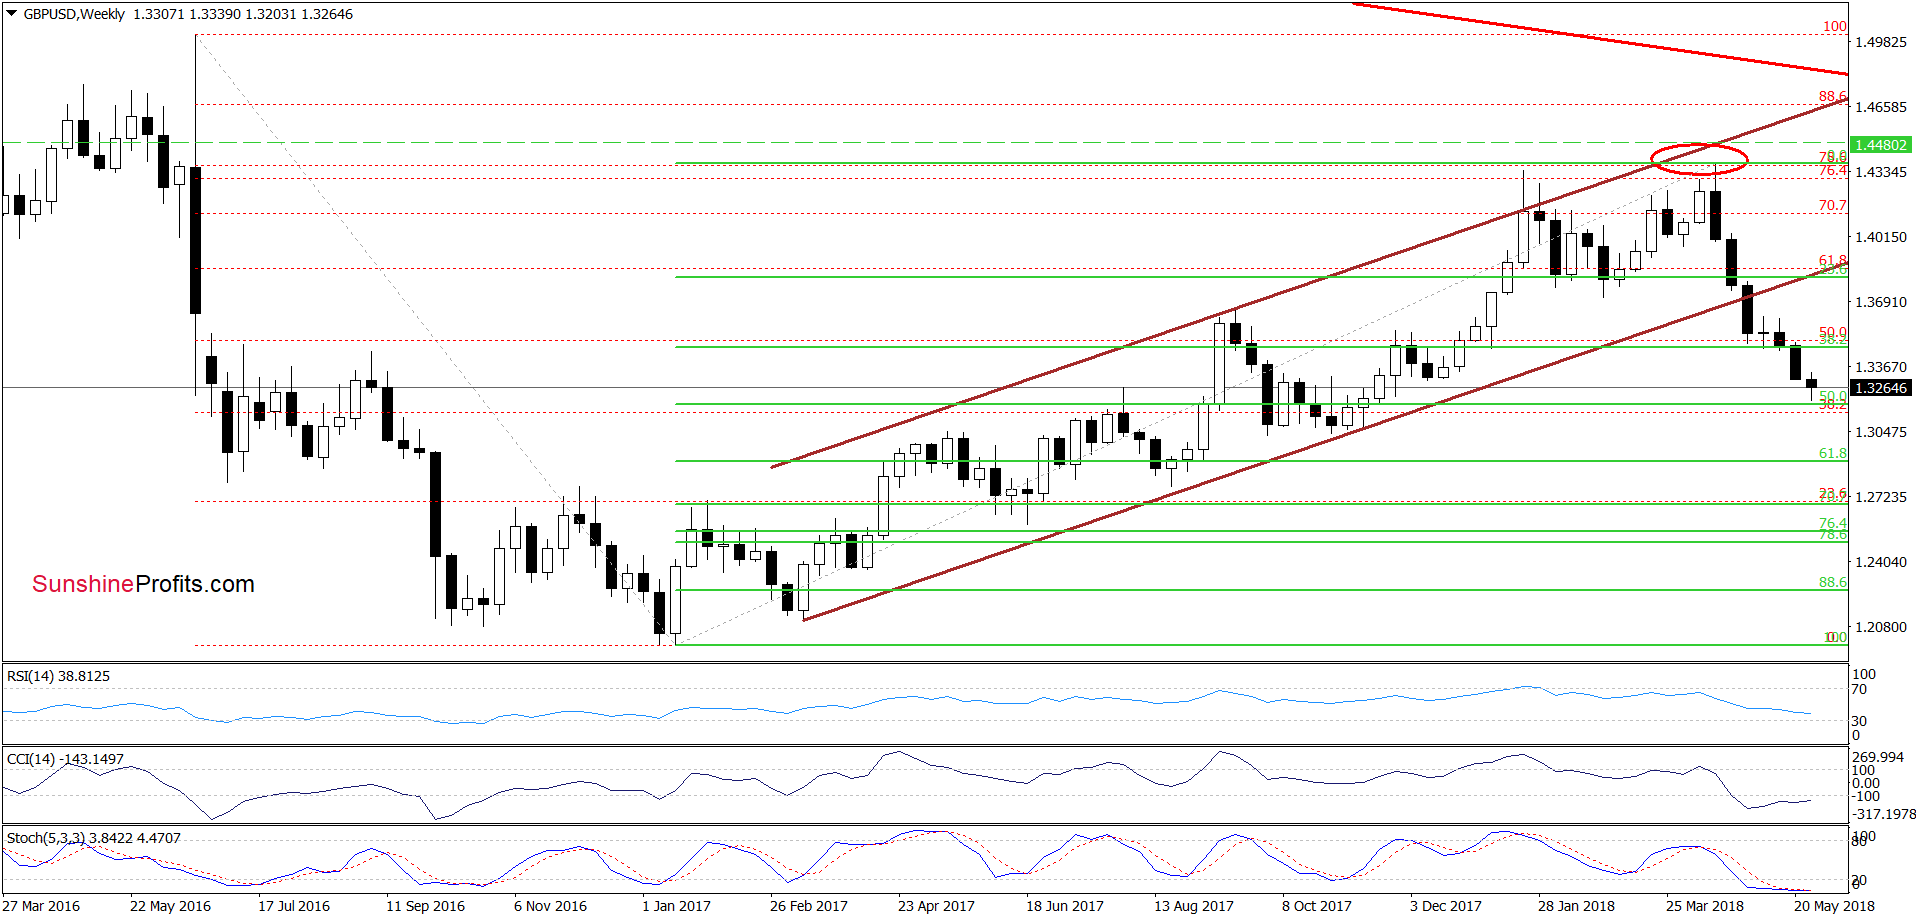
Looking at the medium-term chart, we can notice some similarity to what we already saw in the case of EUR/USD. What do we mean by that? As you see, GBP/USD also approached the 50% Fibonacci retracement, which in combination with the current situation in the weekly indicators suggests that higher values of the exchange rate (and lower values of the USD Index) are just around the corner.
This scenario is also reinforced by the short-term picture of USD/JPY
USD/JPY
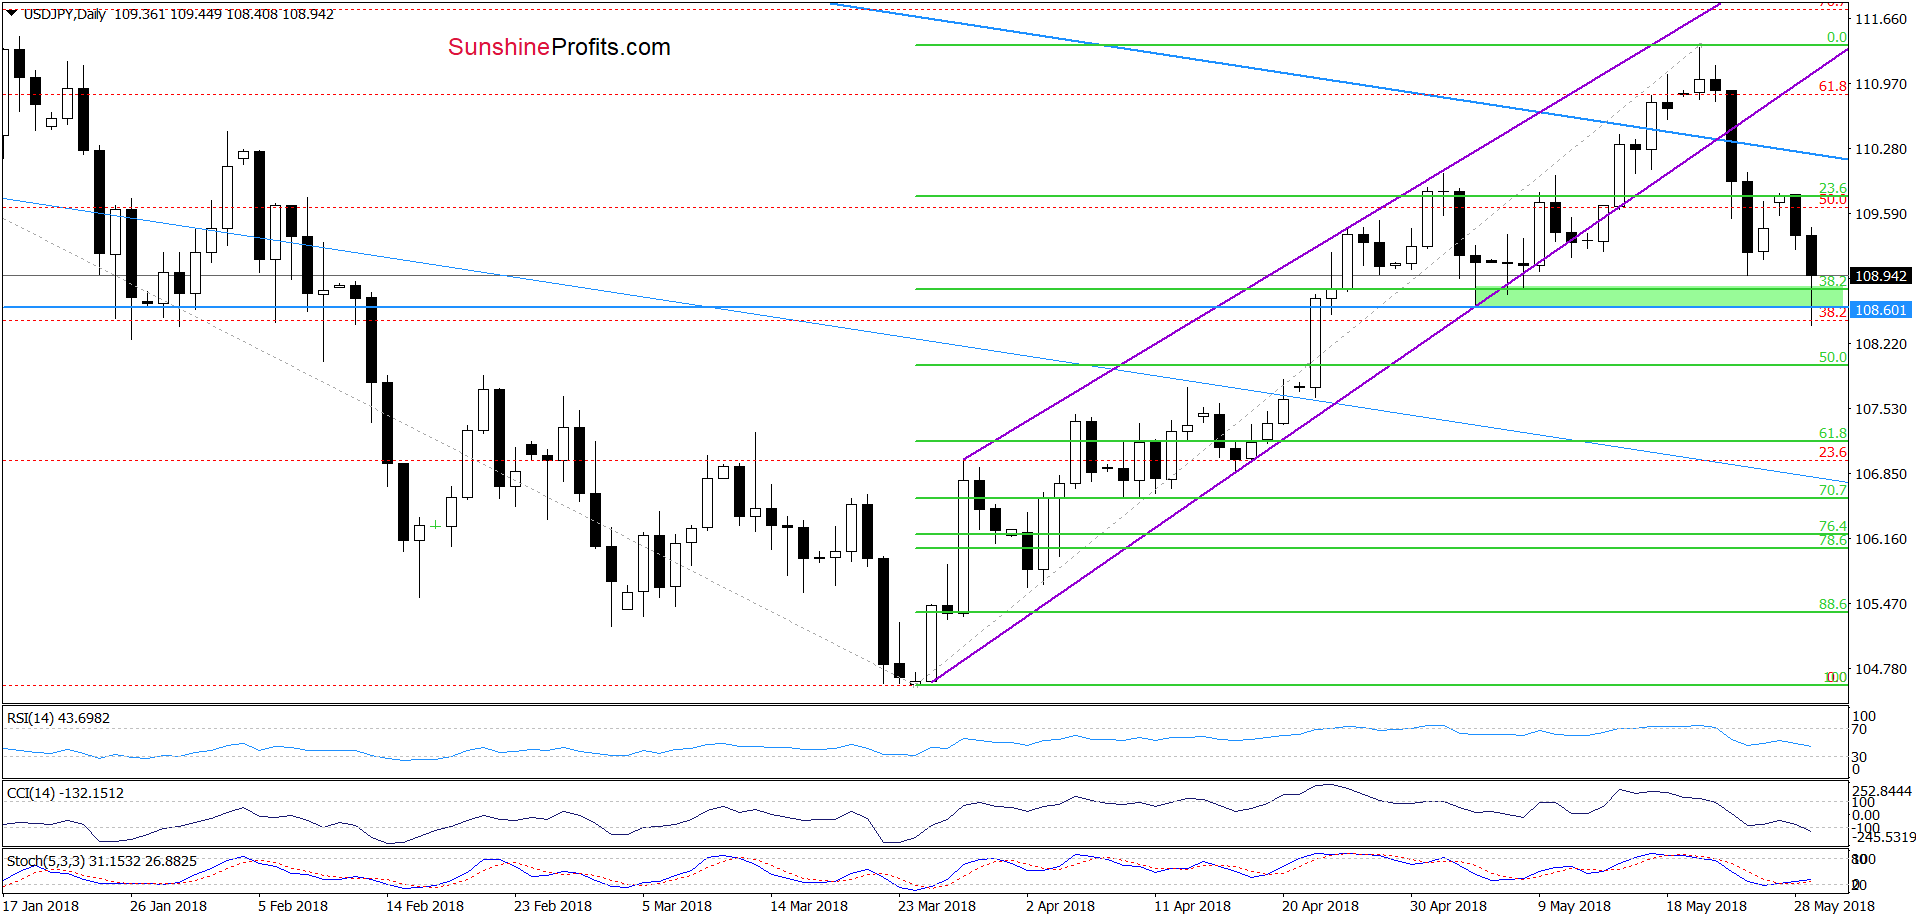
On Friday, we wrote the following:
(…) the situation developed in line with the above scenario and USD/JPY reversed and declined quite sharply in recent days. Although the exchange rate rebounded slightly earlier today, the sell signals generated by the daily indicators remain in the cards, suggesting one more downswing and a test of the 38.2% Fibonacci retracement (at 108.78) marked on the daily chart in the coming days.
From today’s point of view, we see that currency bears took the pair lower (as we had expected), which resulted in a test of our downside target and the early May lows. Earlier today, the pair rebounded, invalidating the earlier breakdowns, which suggests further improvement and a comeback to (at least) yesterday’s high.
At this point, some of you may be surprised how it is possible that upswing in USD/JPY could affect negatively the USD Index. However, if you take a look at the daily charts of our currency pairs, you will see that this currency pair is moving more like EUR/USD and GBP/USD and not in line with the index itself recently, which is caused by the fact that the safe haven yen posted broad gains amid widespread risk aversion.
Therefore, as we mentioned earlier, higher values of USD/JPY will likely push the index a bit lower in the coming days.
One more reason for lower values of the greenback we can also find on the charts below.
USD/CAD
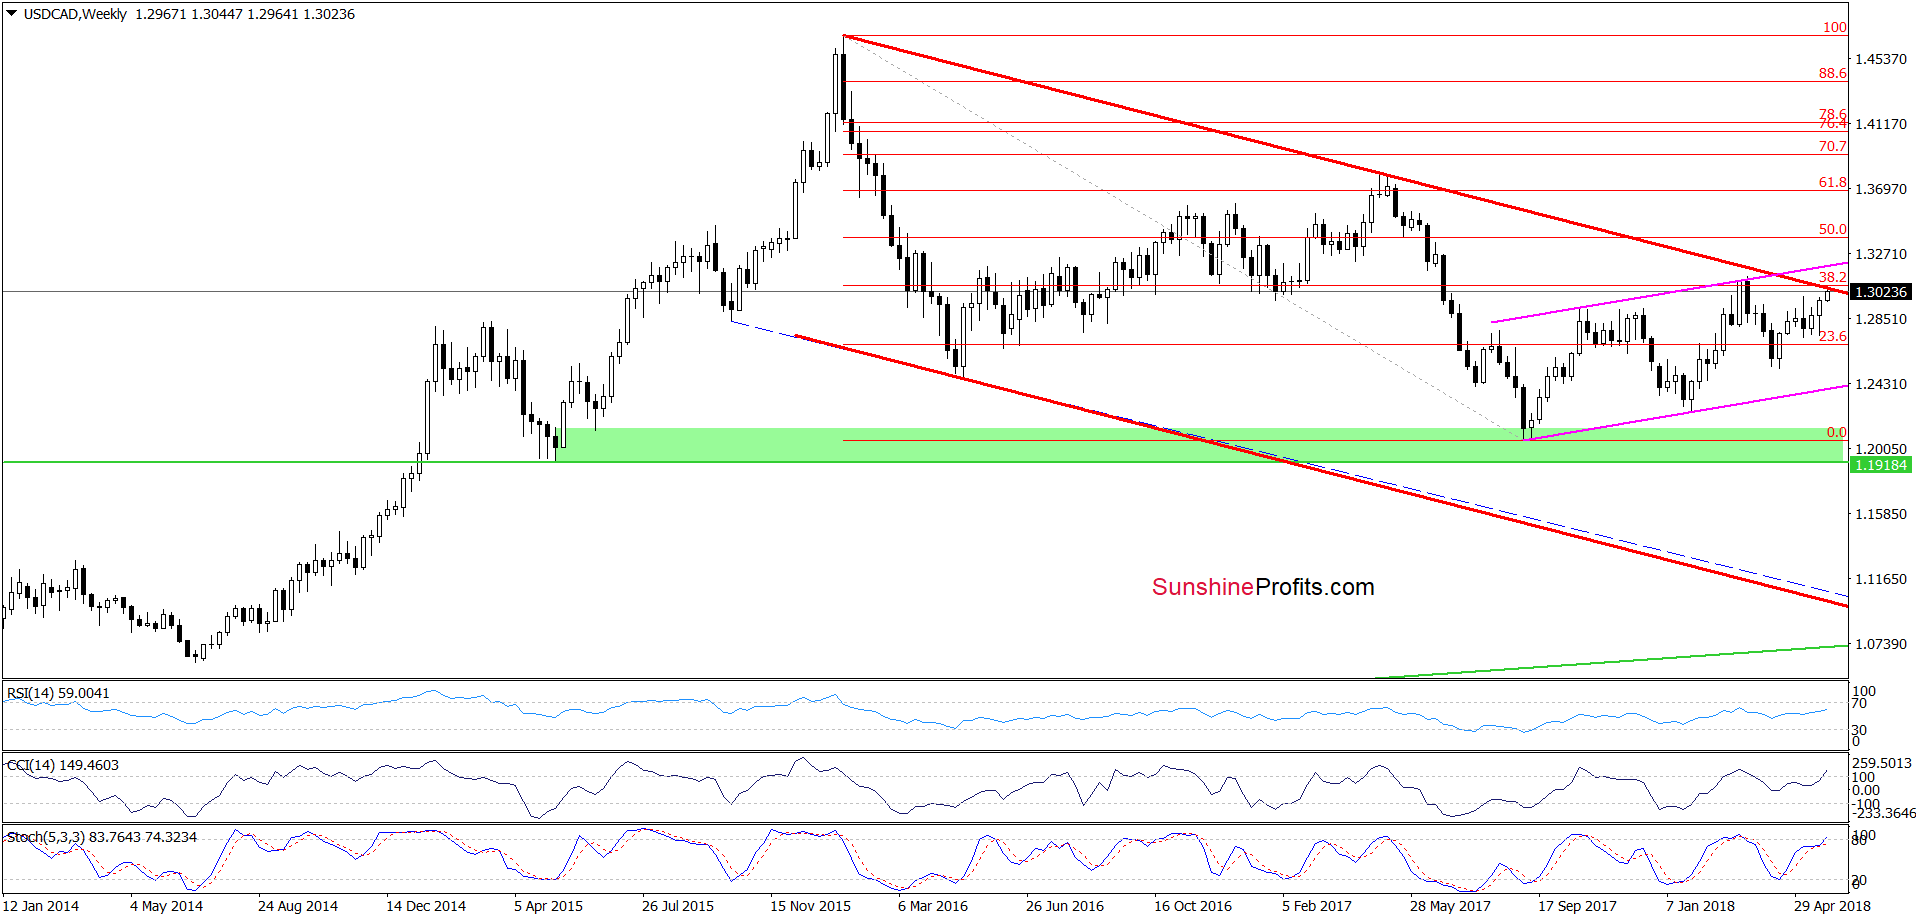
From the broader perspective, we see that USD/CAD climbed to the strong and important resistance zone created by the upper border of the long-term red declining trend channel and the 38.2% Fibonacci retracement based on the entire 2016-2017 downward move, which could pause further improvement in the coming days.
Connecting the dots, as you could read above, the USD Index climbed to the resistance area, which also approached EUR/USD, GBP/USD and USD/JPY to support areas and USD/CAD to important resistances. Such combination will likely encourage market participants to push the greenback lower (and result in a comeback to around 93.20, where the bottom of the last correction is).
Nevertheless, please keep in mind that the USD Index and EUR/USD still have some space for gains/losses, which is in line with the apex triangle reversal pattern. We will continue to monitor the market and let you know when we notice reliable signals to open short/long positions. Stay tuned.
Thank you.
Nadia Simmons
Forex & Oil Trading Strategist
Przemyslaw Radomski, CFA
Founder, Editor-in-chief, Gold & Silver Fund Manager
Gold & Silver Trading Alerts
Forex Trading Alerts
Oil Investment Updates
Oil Trading Alerts

