

It was more than 3 weeks ago when we provided you with an update on the USD Index and since something major is happening in it – and even more is likely about to happen - it seems that today is a perfect day to catch up. The critical move is most likely taking place as we are writing this and if you haven’t been paying attention to the currency sector lately as the USD Index has only been moving back and forth in a rather boring manner, it’s a perfect day to get back on track.
- EUR/USD: none
- GBP/USD: none (in other words, our short positions were closed with profits)
- USD/JPY: long (a stop-loss order at 111.11; the initial upside target at 113.40)
- USD/CAD: none
- USD/CHF: none
- AUD/USD: short (with a stop-loss order at 0.7208; the exit downside target at 0.7051)
Let’s take a look at the charts below (charts courtesy of http://stockcharts.com).
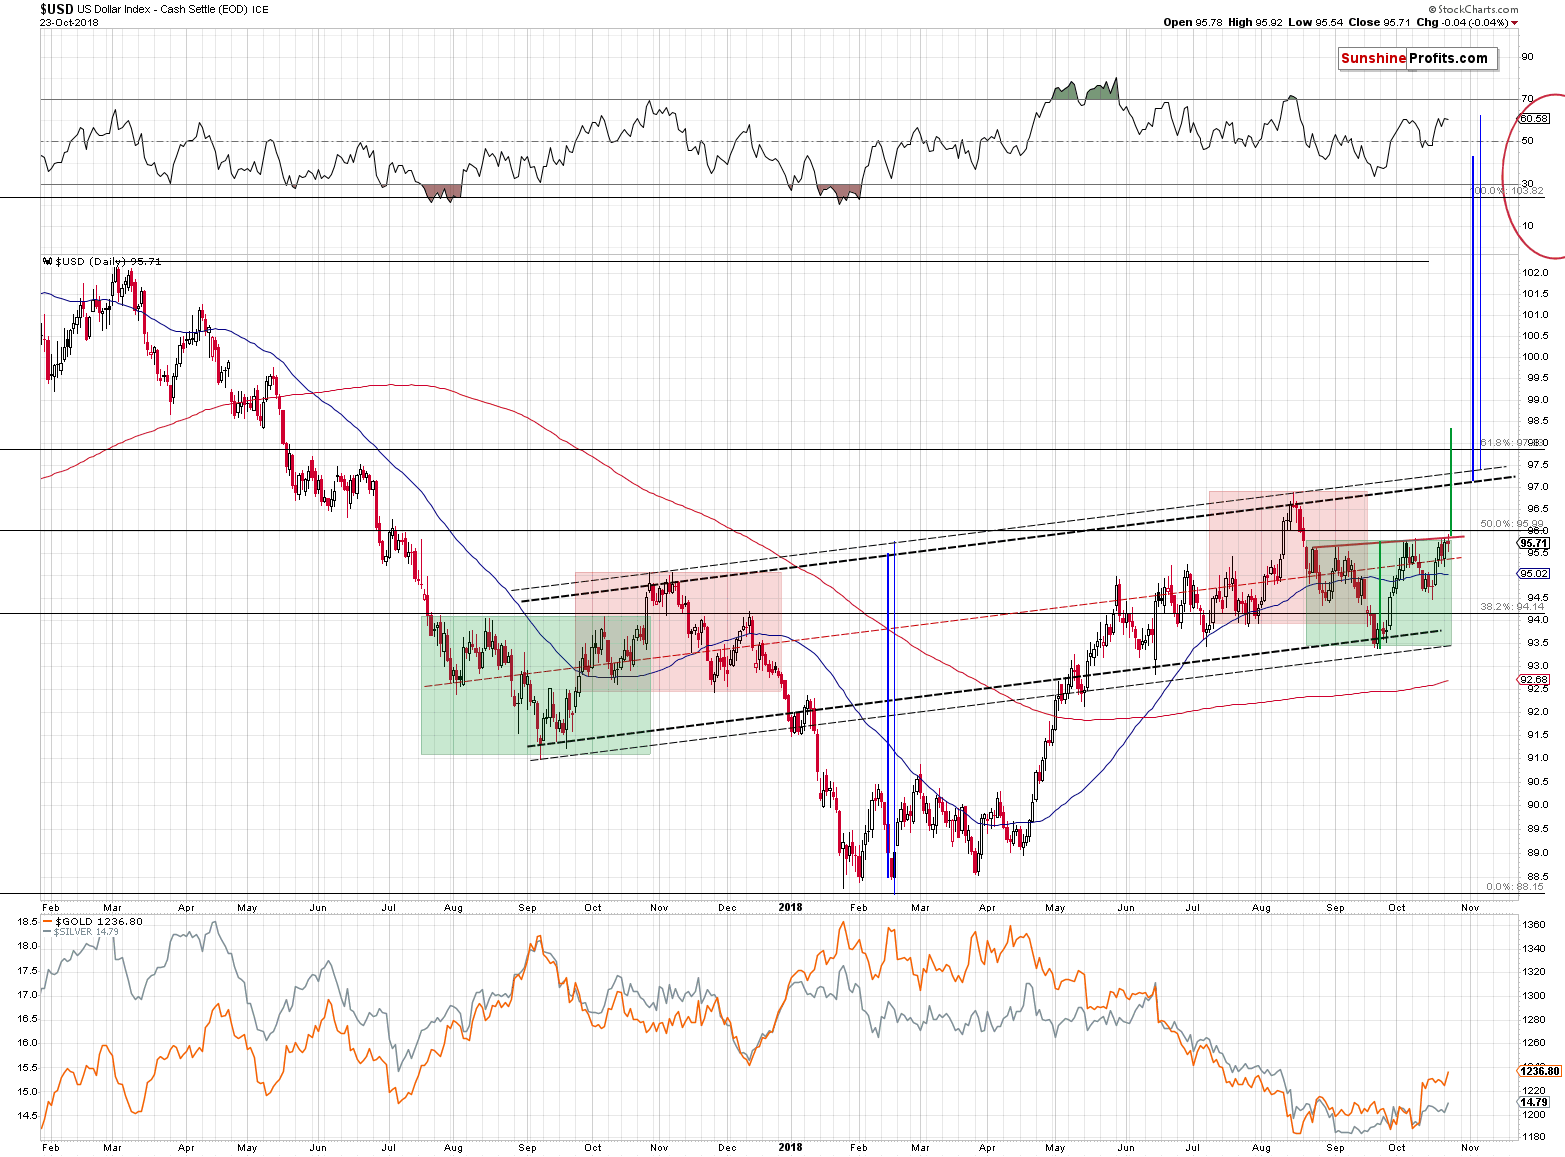
We already discussed the existence of the reflective pattern in the USD Index in the previous Alert, but there’s one thing that we would like to add. Namely, we would like to address the potential (! – not completed) inverse head-and-shoulders pattern that is probably being formed.
But, first things first. The remarkable thing about the reflective nature of the recent price movement is that it is so similar. The October / November 2017 top is like the August 2018 top as they both took form of head-and-shoulders tops. We marked them with red. What’s even more profound is that outside shoulders of the top above-mentioned formations (left in 2017 and right in 2018) were the inside shoulders of the inverse head-and-shoulders patterns. We marked them with green. The reflective nature of the pattern is even clearer than we thought.
Now, the current inverse head-and-shoulders pattern has no direct implications yet as the price has not yet broken above its neck level, let alone confirmed such breakout. But, in light of the striking similarity between the 2017 decline and this year’s upswing, it’s likely that this formation will be completed.
The completion of the local (green) inverse head-and-shoulders pattern would provide us with the target at about 98.4, which means that it would likely result in a breakout above the medium-term inverse head-and-shoulders pattern that has its own target well above 100 – at about 103. In other words, based on the above-mentioned patterns, a move to the 2017 high in the USDX appears likely.
The above rally would perfectly fit the long-term analogies in the USD Index.
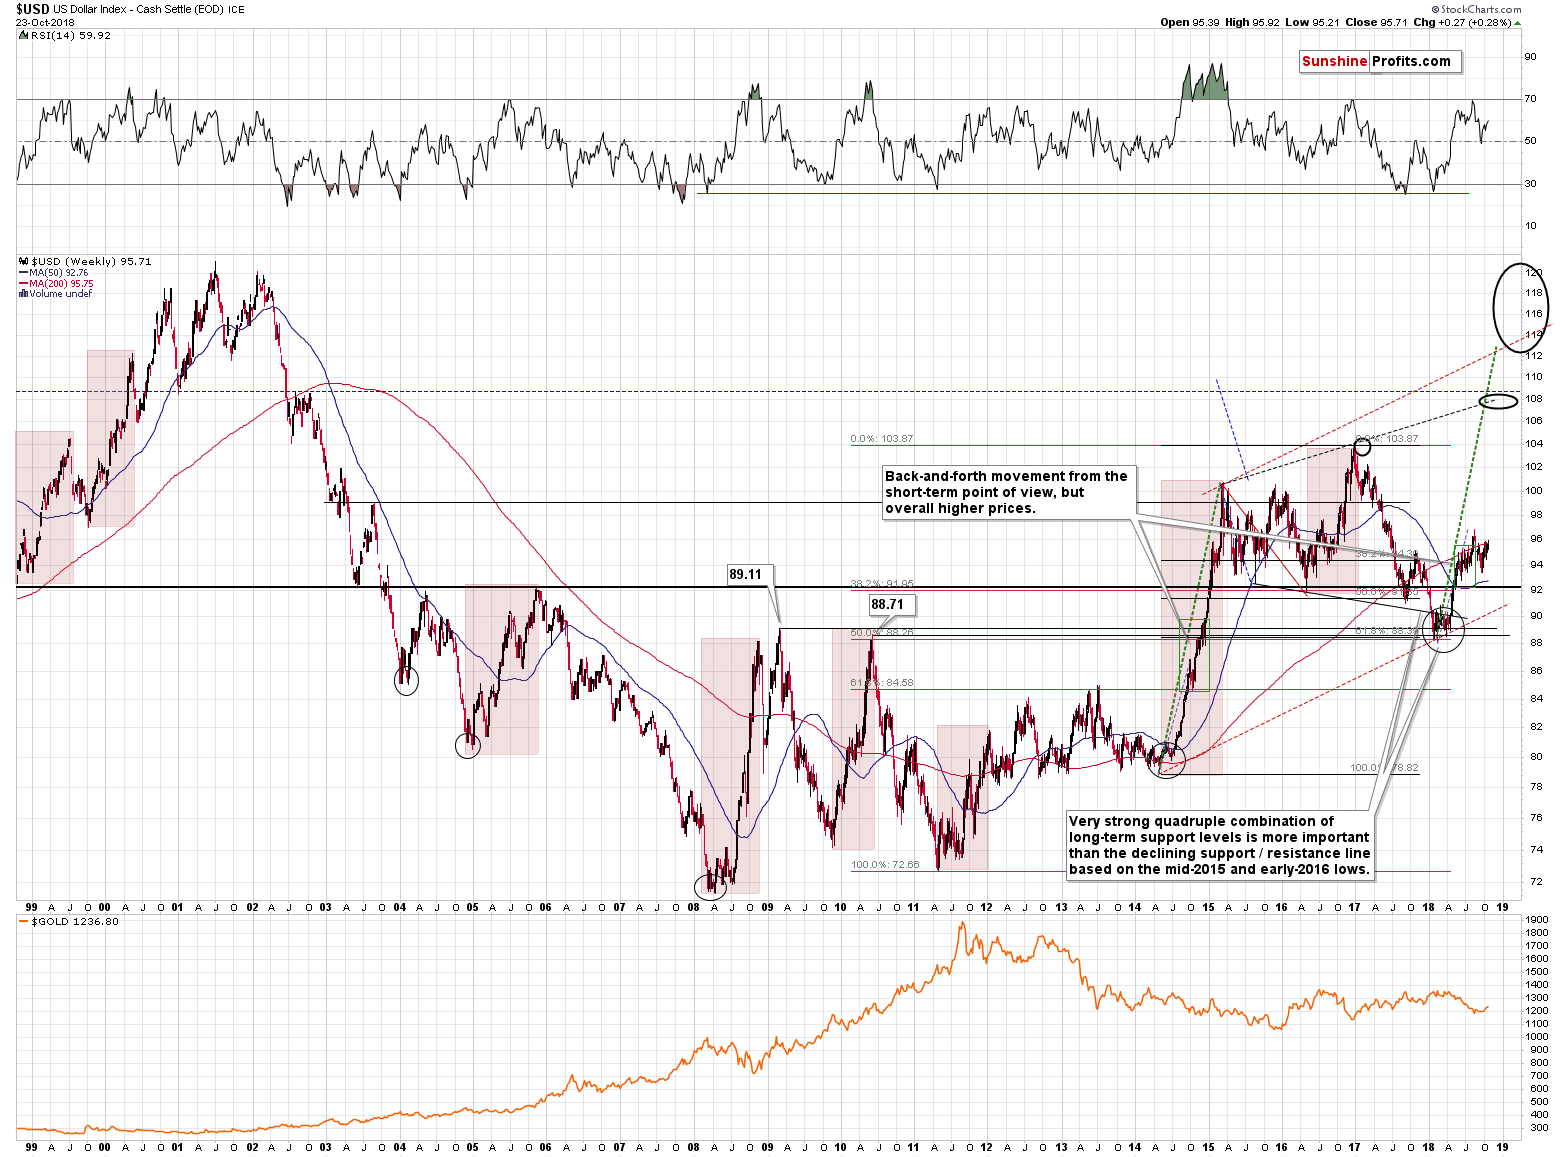
As a reminder, the USD Index is in a medium-term rally that’s similar to what happened in 2008, 2010 and to the 2014-2015 upswing. The current consolidation is bigger than the one that took place in 2010, but still looks similar.
As you can see on the first of the above charts, not much happened yesterday. But, in today’s pre-market trading, the USDX moved above 96.30, which means that we are seeing a breakout above the local inverse head-and-shoulders pattern – the one that points to a target of 98.4 and that is likely to lead to the completion of the bigger inverse H&S and even bigger rallies.
The move above 96 materialized only a few hours ago, so it’s far from being confirmed. Therefore, the implications are not yet strongly bullish, but they are definitely present. The implications for the USDX are already bullish even though they are not very strong for the short term just yet.
This means that the outlook improved, but is not confirmed enough for us to re-open the positions that we just closed with a profit. Precisely, we manually took profits from the EUR/USD pair yesterday, and we are taking profits off the table in case of the GBP/USD today based on the target price levels that were reached.
Based on the strength of reaction in the USD Index, however, it seems that we will be shortly re-opening the positions that aim to benefit from the rising value of the US currency. You will find details below.
Trump vs. Fed – New Details
We just got a big confirmation of Trump’s approach toward the Fed’s interest rate decisions. As we can read on finance.yahoo.com:
In an interview Tuesday with The Wall Street Journal, Mr. Trump acknowledged the independence the Fed has long enjoyed in setting economic policy, while also making clear he was intentionally sending a direct message to Mr. Powell that he wanted lower interest rates.
The article quotes a number of comments that are raise the question of Fed’s independence and coherent strategy for the entire country. The US President being in an open conflict with the Fed’s head is a major concern for the USD and for gold, especially that Trumps said the following about Powell:
He was supposed to be a low-interest-rate guy. It’s turned out that he’s not.
Our interpretation (opinion) of the above is that since the general stock market declined, Trump wants make sure that he’s not the one to blame by the voters and he’s pushing the blame to somebody else. The Fed is an easy target. Trump assumes that it’s better to be viewed as reckless (Powell was supposed to be a low-interest-rate guy? Come on.) than to be the one that’s held responsible for the stock market decline. And he might be right from the political marketing point of view – after all, people are likely to forget about individual political decisions that don’t affect them directly but are not going to forget about the amount of capital they have on their brokerage and retirement accounts.
What would this interpretation imply? That once the stock market’s correction is over, the Trump will either cease commenting on the Fed’s role, or he might say that they are doing a good job after all, and that he’ll be watching them to make sure that they don’t damage the economy etc. This also means that the USD Index would soar and that PMs would take a dive as the factor that was already priced-in, would cease to exist, or its. importance would be minimal.
But, the above already has bullish implications for the USDX and bearish implications for gold.
The trust in the US currency should be declining based on the above-mentioned comments, while gold should be soaring. But it’s not. The market seems to have already discounted this conflict in the prices and currency values. This is very bullish for the USDX and bearish for gold. Why? Because the situation really can’t get worse on this front. Trump can’t be any more straightforward with regard to his opinion on Fed’s interest rate moves, and there’s not much more that he can do about it. And we doubt that he plans to. As discussed above, in our opinion it’s just political theater. Fortunately, between this smoke and mirrors, we can find signals and opportunities. The fact that USDX and gold are not reacting in the way they should be reacting, tells us that these markets really want to move in the opposite way. The USDX is rallying in today’s pre-market trading, indicating that the next big move in the US currency will be to the upside.
Summing up, the short-term outlook for the USD Index is not crystal clear, but it’s definitely more bullish then bearish, and the medium-term outlook is very bullish. Once we get enough short-term confirmations, we’ll likely re-open positions that would benefit from rising USD values. As always, we’ll keep you – our subscribers – informed.
Thank you.
Nadia Simmons
Forex & Oil Trading Strategist
Przemyslaw Radomski, CFA
Founder, Editor-in-chief, Gold & Silver Fund Manager
Gold & Silver Trading Alerts
Forex Trading Alerts
Oil Investment Updates
Oil Trading Alerts

