

Although the USD Index slipped under the level of 90 yesterday, one of the medium-term support lines encouraged bulls to act, which resulted in a rebound. How did this move affect the euro, the yen and the Canadian dollar? Is the worst behind the greenback?
In our opinion the following forex trading positions are justified - summary:
- EUR/USD: none
- GBP/USD: none
- USD/JPY: none
- USD/CAD: none
- USD/CHF: none
- AUD/USD: short (a stop-loss order at 0.8038; the initial downside target at 0.7730)
EUR/USD
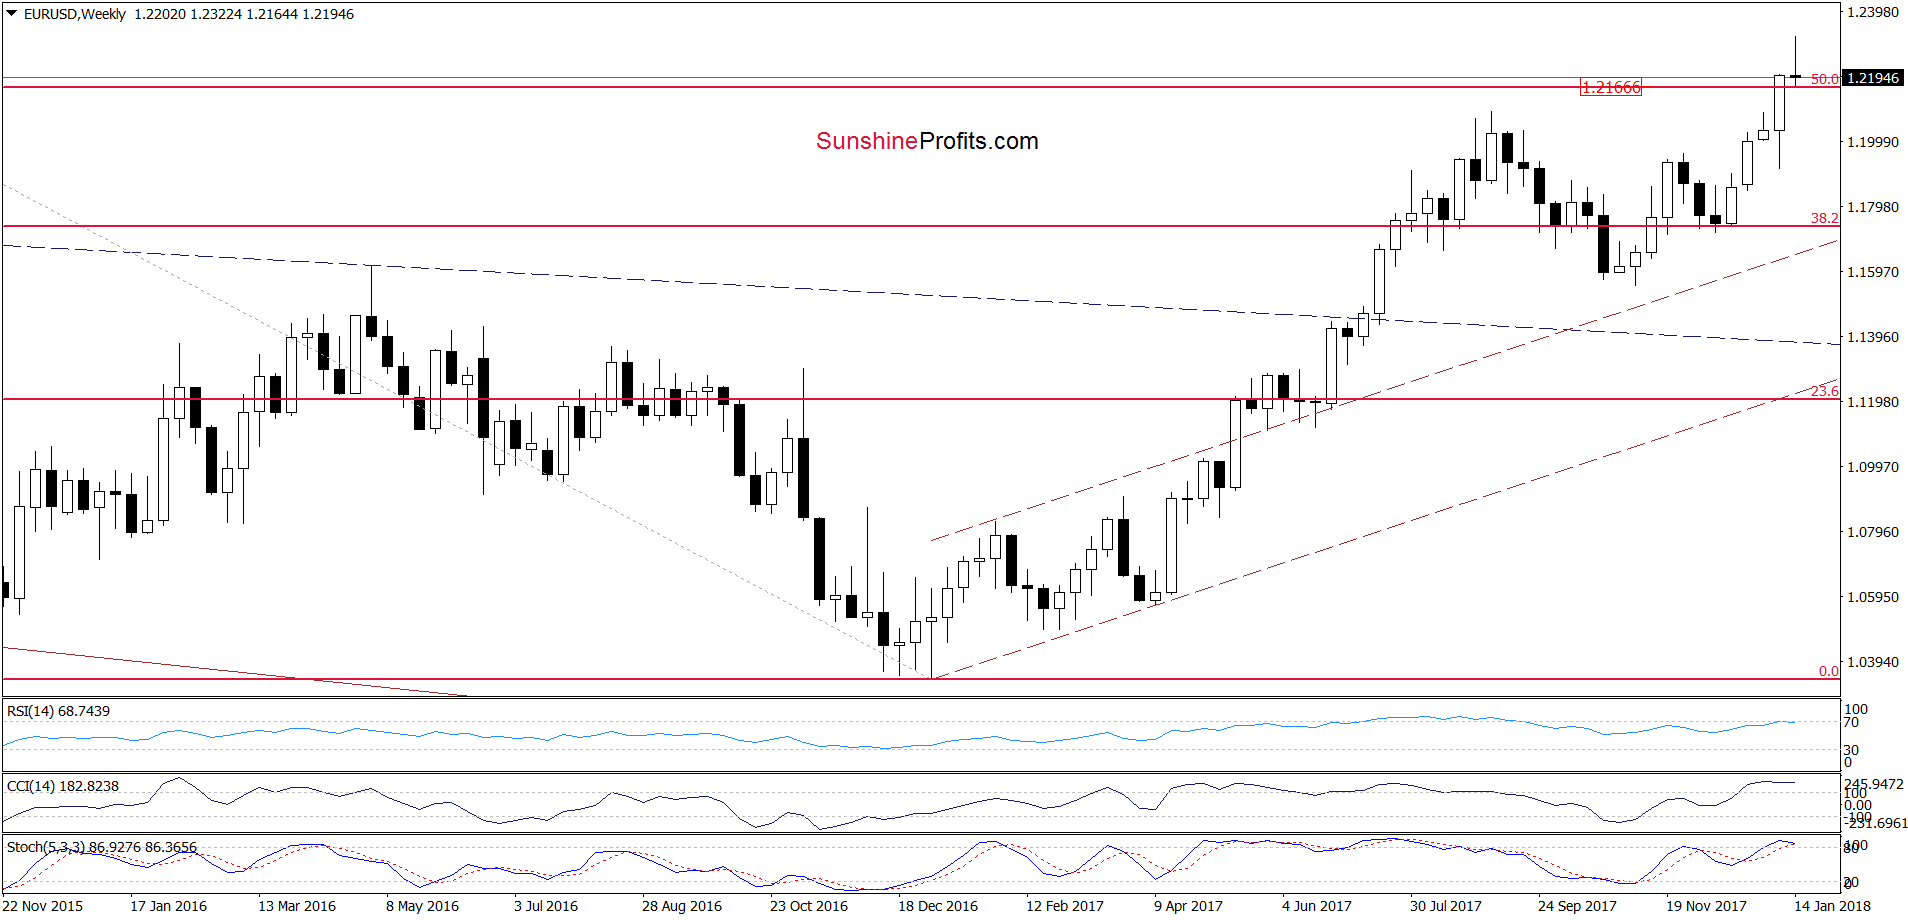
Looking at the weekly chart, we see tat although EUR/USD pulled back, the exchange rate is still trading above the previously-broken 50% Fibonacci retracement, which continues to serve as a support.
How did this drop affect the very short-term picture? Let’s check on the chart below.
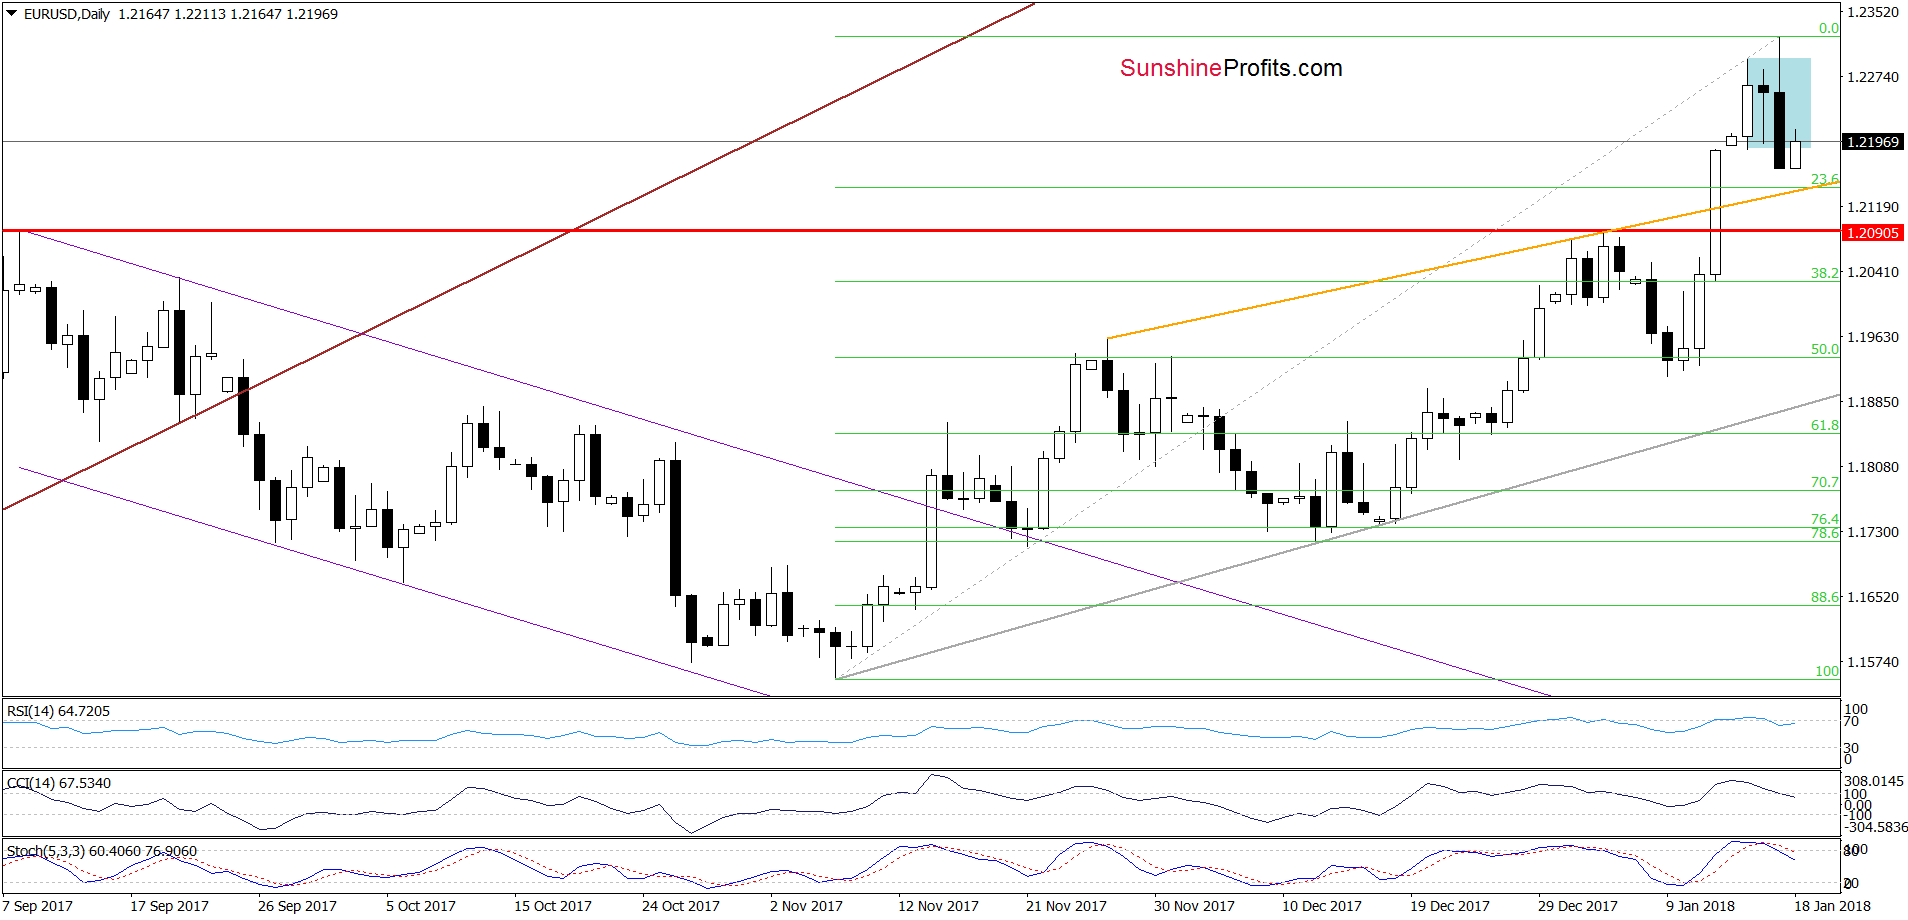
In our yesterday's alert, we wrote the following:
(…) although EUR/USD moved higher once again and hit a fresh 2018 peak, currency bears (…) erased almost entire today’s increase, which doesn’t bode well for further rally – especially when we factor in the current position of the daily indicators. As you see the Stochastic Oscillator generated the sell signal, while the RSI and the CCI are very close to doing the same, which suggests that lower values of EUR/USD are just around the corner.
As you see on the above chart, the situation developed in line with the above scenario and EUR/USD extended losses after our alert was posted. As a result, the pair closed Wednesday session under the Monday white candle low, which serves as the lower border of the blue consolidation.
Earlier today, currency bulls pushed the exchange rate a bit higher, which looks like a verification of the earlier breakdown. Additionally, the sell signals generated by the indicators remains in the cards, increasing the probability of another downswing.
Nevertheless, taking into account the proximity to the orange support line based on the previous highs (the upper border of the rising wedge) and the early January highs it seems to us that the space for declines is too small to justify opening short positions.
So, when can we expect a bigger move to the downside? In our opinion, such price action will be more likely and reliable only if we see an invalidation of the breakout above the above-mentioned 50% Fibonacci retracement and the January peak. Until this time, another downswing and a verification of the breakout above the September and January 2018 highs seems to be a more credible scenario.
Why? Because, we think that the USD Index will verify the breakdown under the lower border of the red declining trend channel at the same time. Therefore, in our opinion, as long as there is no invalidation of the breakdown under this line (you can see it on the chart below) opening full short positions in EUR/USD is not justified from the risk/reward perspective.
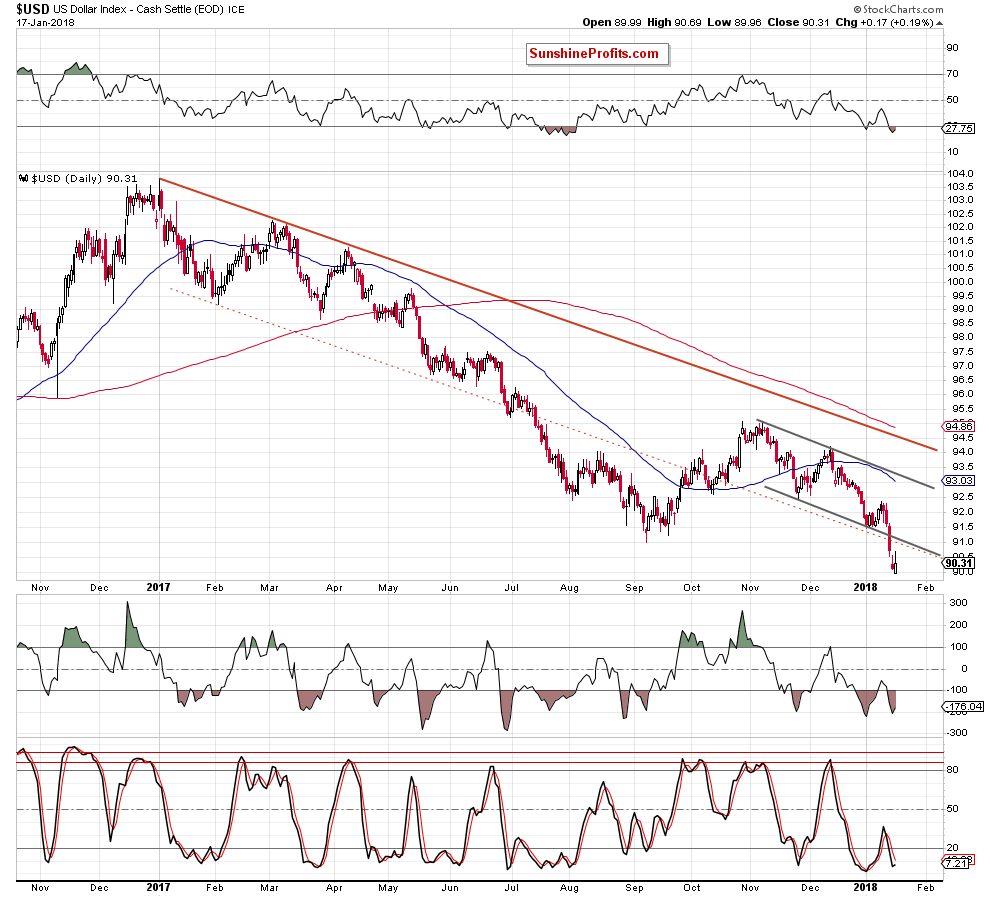
However, what could happen if the bulls do not manage to invalidate the above-mentioned breakdown? Let’s take a look at the chart below.
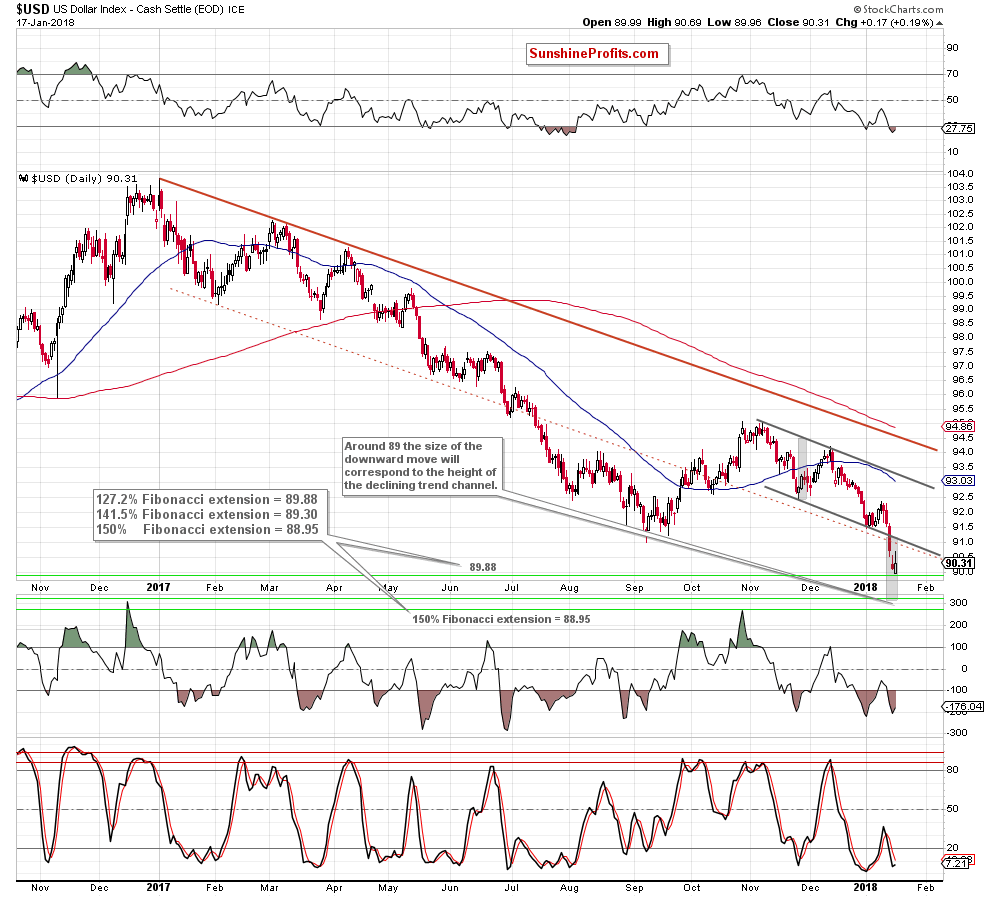
From this perspective, we see that potential bulls’ failure could trigger one more downward move and a drop to around 89, where the size of the downward move will correspond to the height of the declining trend channel.
What could happen at the same time with EUR/USD?
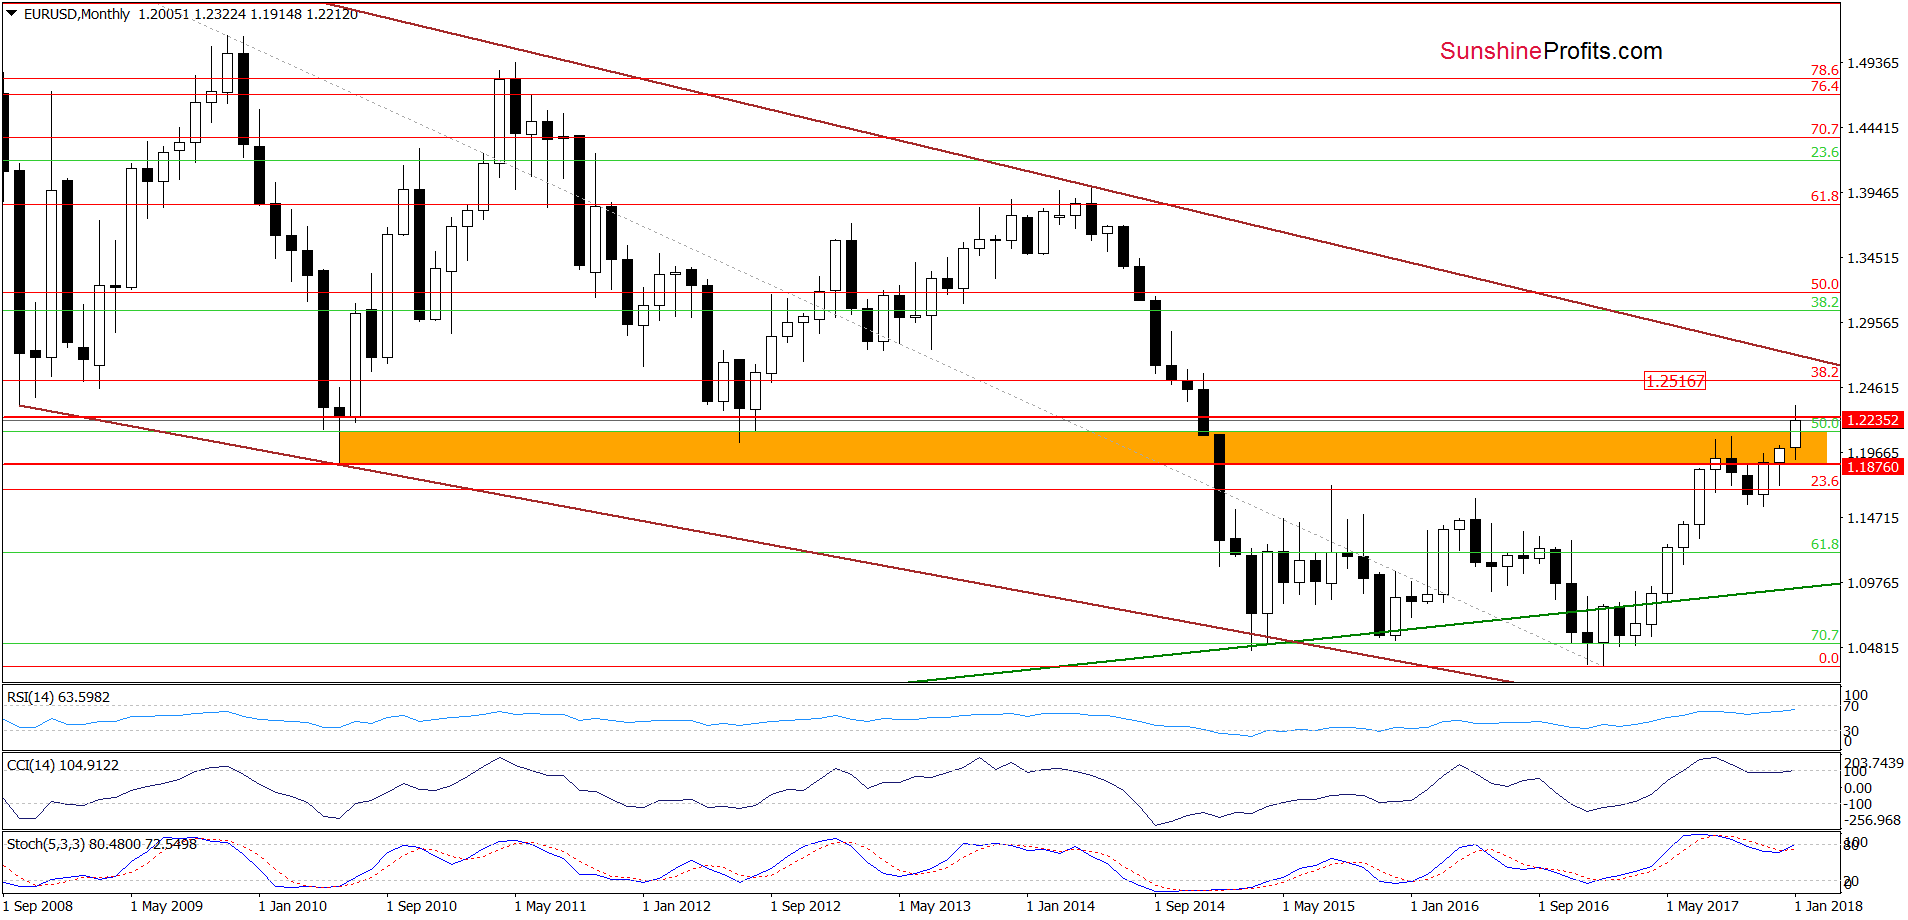
We think that such decline in the greenback could push the exchange rate to the 38.2% Fibonacci retracement based on the entire 2008-2017 downward move. Nevertheless, this is just a potential scenario and we will continue to monitor the market very closely in the coming days.
Trading position (short-term; our opinion): No positions are justified from the risk/reward perspective, however, if we see an invalidation of the breakout above the above-mentioned 50% Fibonacci retracement and the January peak, we’’ likely open short positions. We will keep you informed should anything change, or should we see a confirmation/invalidation of the above.
USD/JPY
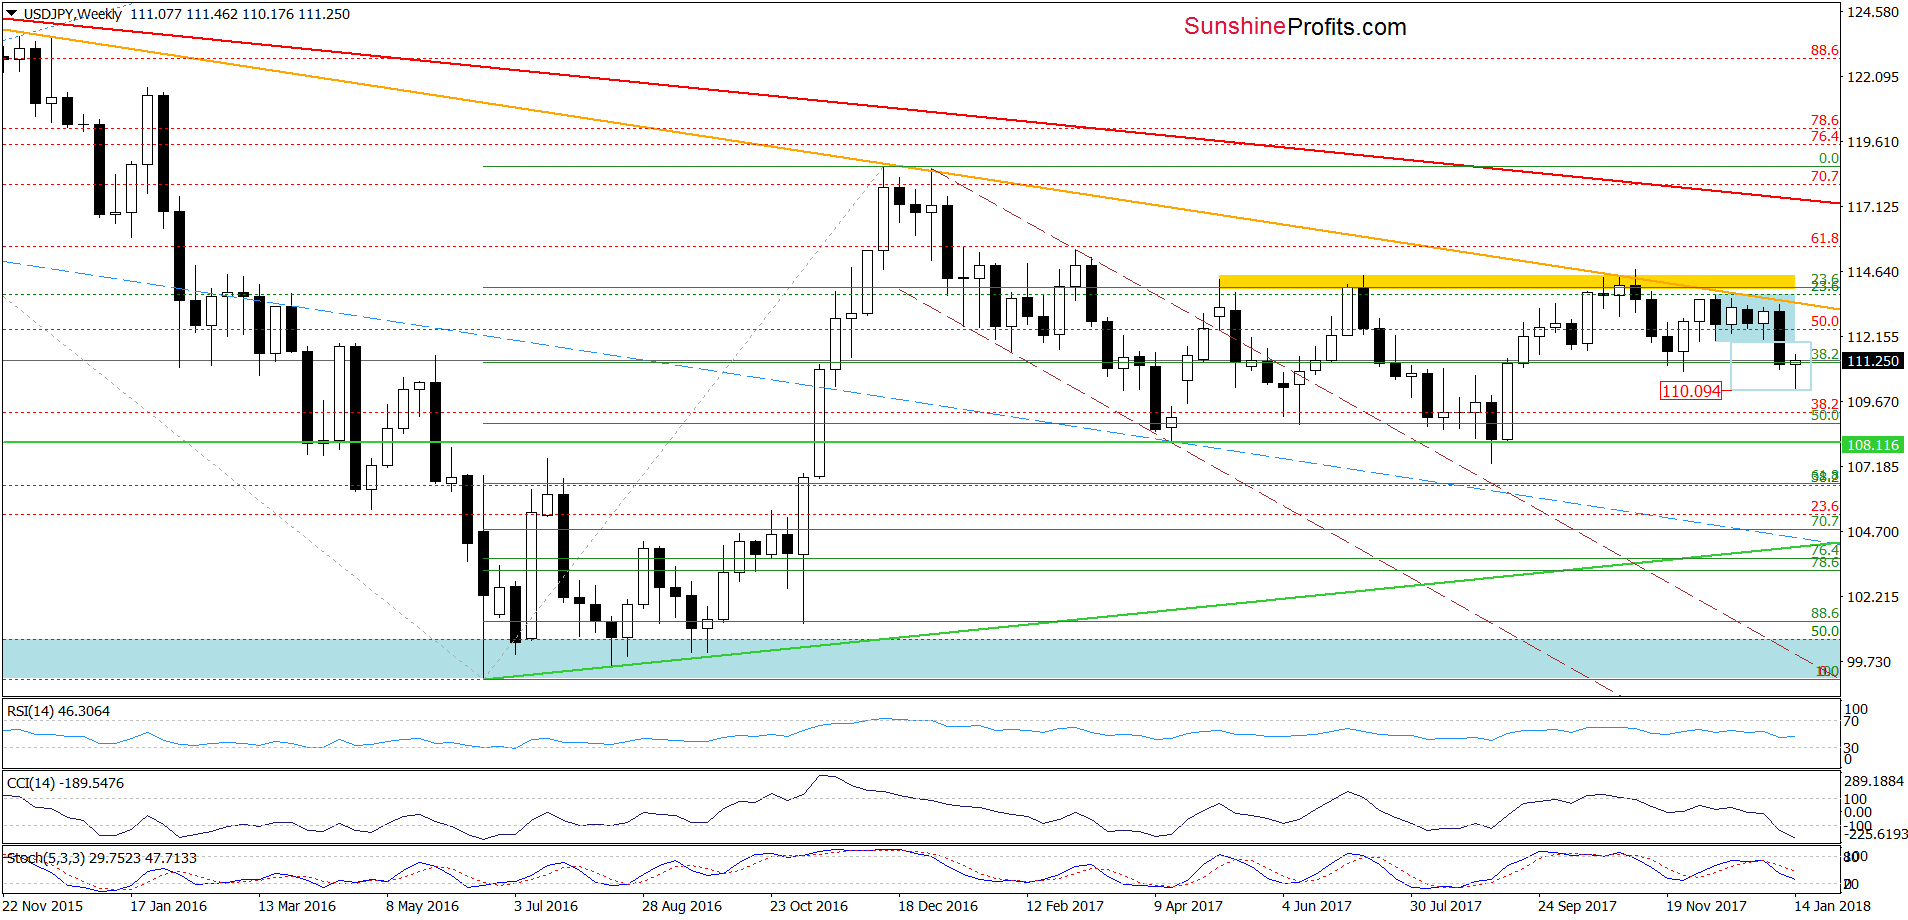
From today’s point of view, we see that USD/JPY extended losses yesterday and approached the 61.8% Fibonacci retracement, which triggered a sharp rebound. As a result, the exchange rate invalidated the earlier breakdown under the green support zone (created by the November lows and the 50% Fibonacci retracement), which together with the buy signals generated by the daily indicators suggests further improvement and a climb to the previously-broken lower border of the orange wedge in the coming days (which would be in tune with the rebound in the USD index to the lower border of the declining trend channel and a decline in the euro to the January peak).
Trading position (short-term; our opinion): No positions are justified from the risk/reward perspective now. We will keep you informed should anything change, or should we see a confirmation/invalidation of the above.
USD/CAD
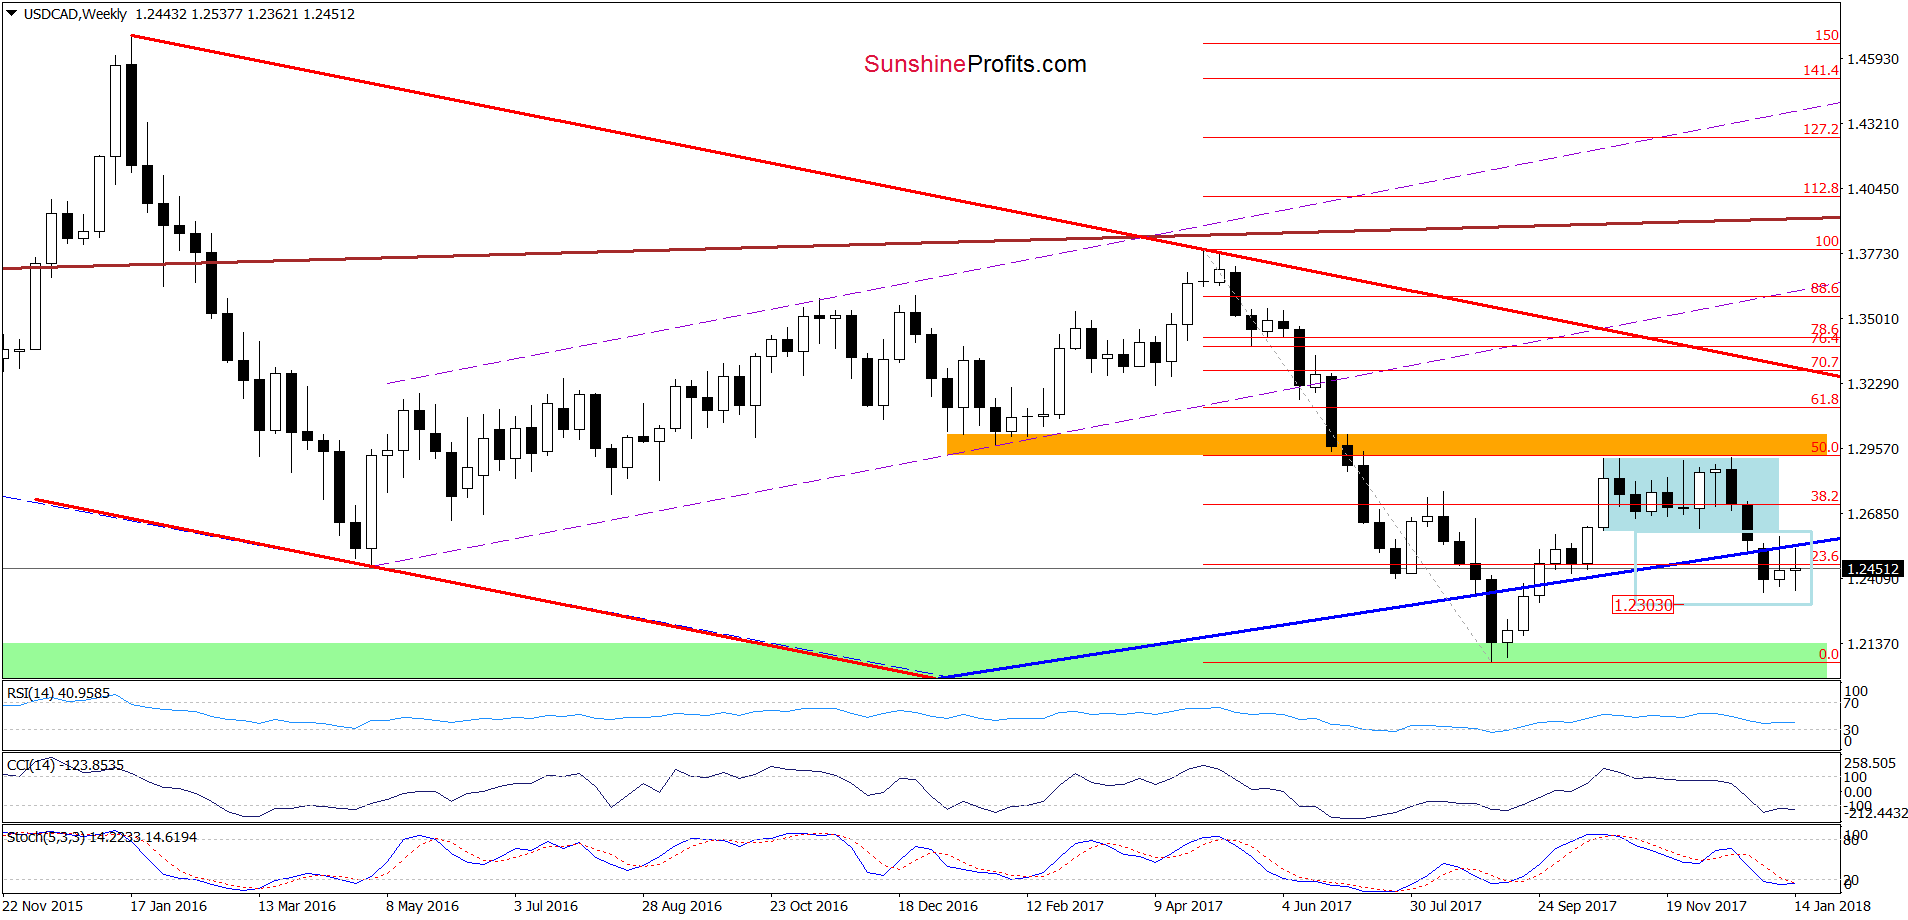
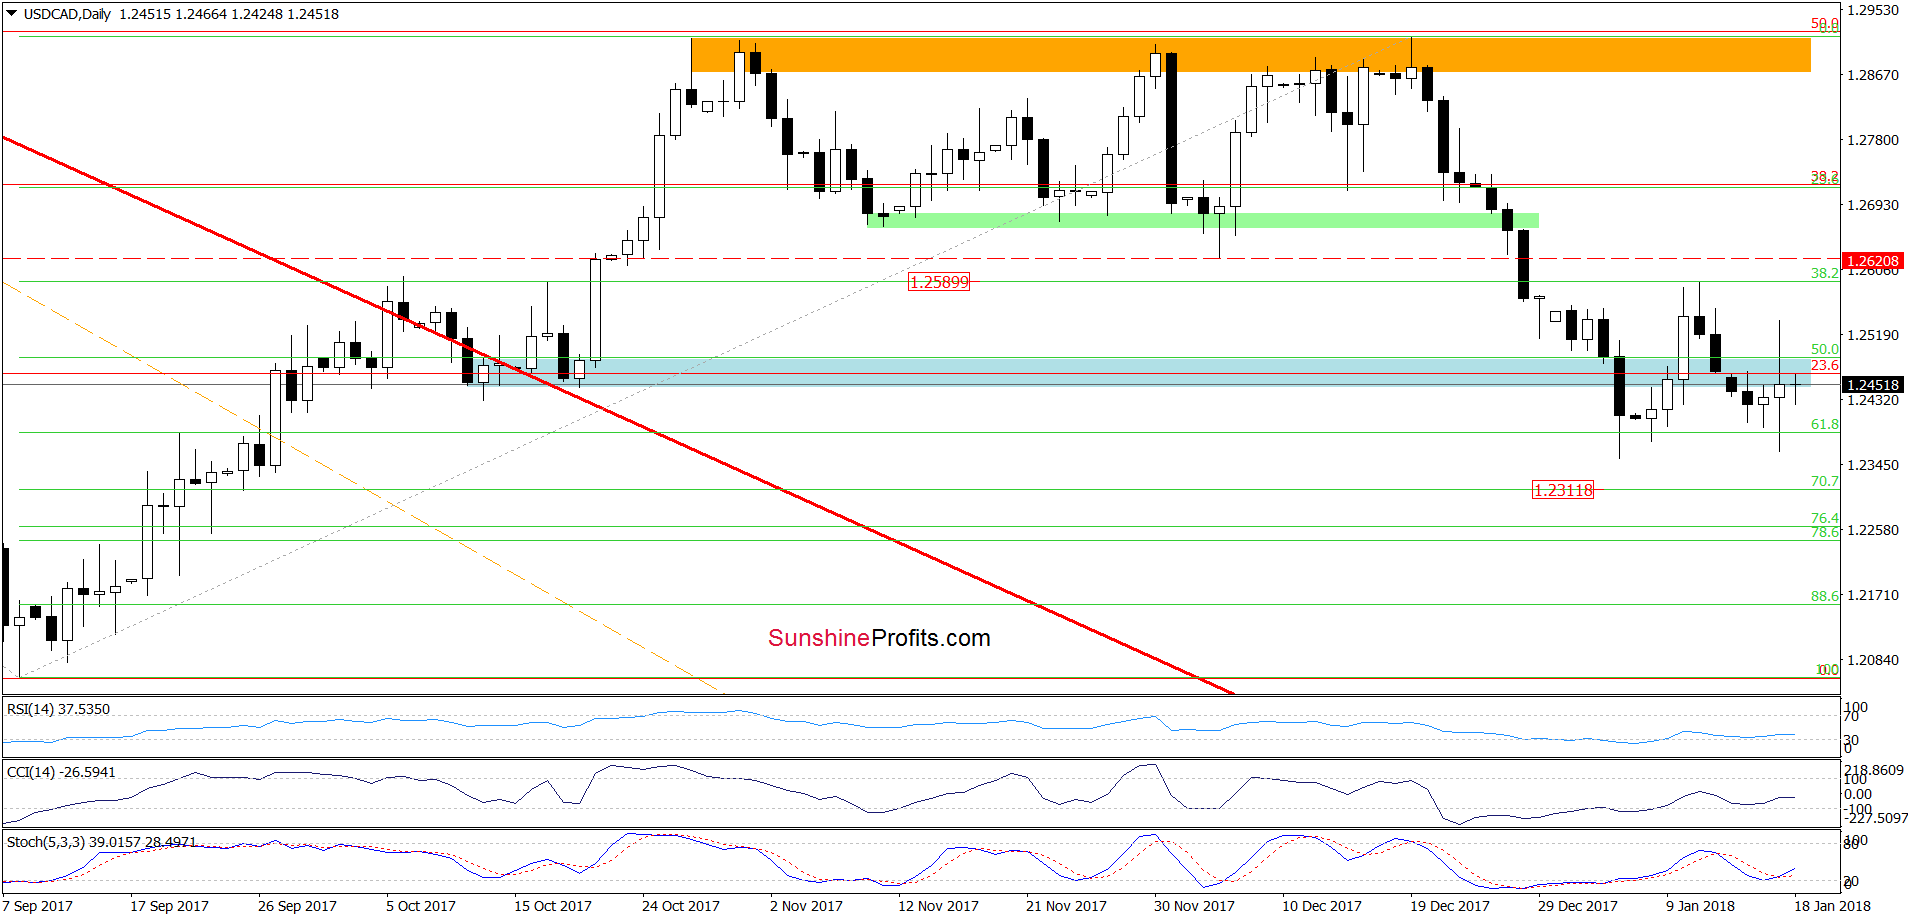
Looking at the charts, we see that although USD/CAD rebounded yesterday, this upswing was much weaker compared to what you saw in the case of USD/JPY. Why? In our opinion, the main reason, which caused such price action was the long-term blue line seen on the weekly chart. Thanks to this resistance the pair pulled back and closed the day under the blue zone, invalidating the earlier breakout.
Although this is a negative event, which suggests one more downswing and a test of the recent lows, the buy signals generated by the indicators indicate that currency bulls will try to push the pair higher in the coming days. If they succeed, we’ll see a test of the last week high o even the red dashed horizontal line based on the early December low.
Trading position (short-term; our opinion): no positions are justified from the risk/reward perspective now. We will keep you informed should anything change, or should we see a confirmation/invalidation of the above.
Thank you.
Nadia Simmons
Forex & Oil Trading Strategist
Przemyslaw Radomski, CFA
Founder, Editor-in-chief, Gold & Silver Fund Manager
Gold & Silver Trading Alerts
Forex Trading Alerts
Oil Investment Updates
Oil Trading Alerts

