

The recent downward move in the USD Index pushed AUD/USD to a fresh 2018 high, but will the rally continue?
In our opinion the following forex trading positions are justified - summary:
- EUR/USD: none
- GBP/USD: none
- USD/JPY: none
- USD/CAD: none
- USD/CHF: none
- AUD/USD: short (a stop-loss order at 0.8038; the initial downside target at 0.7730)
EUR/USD
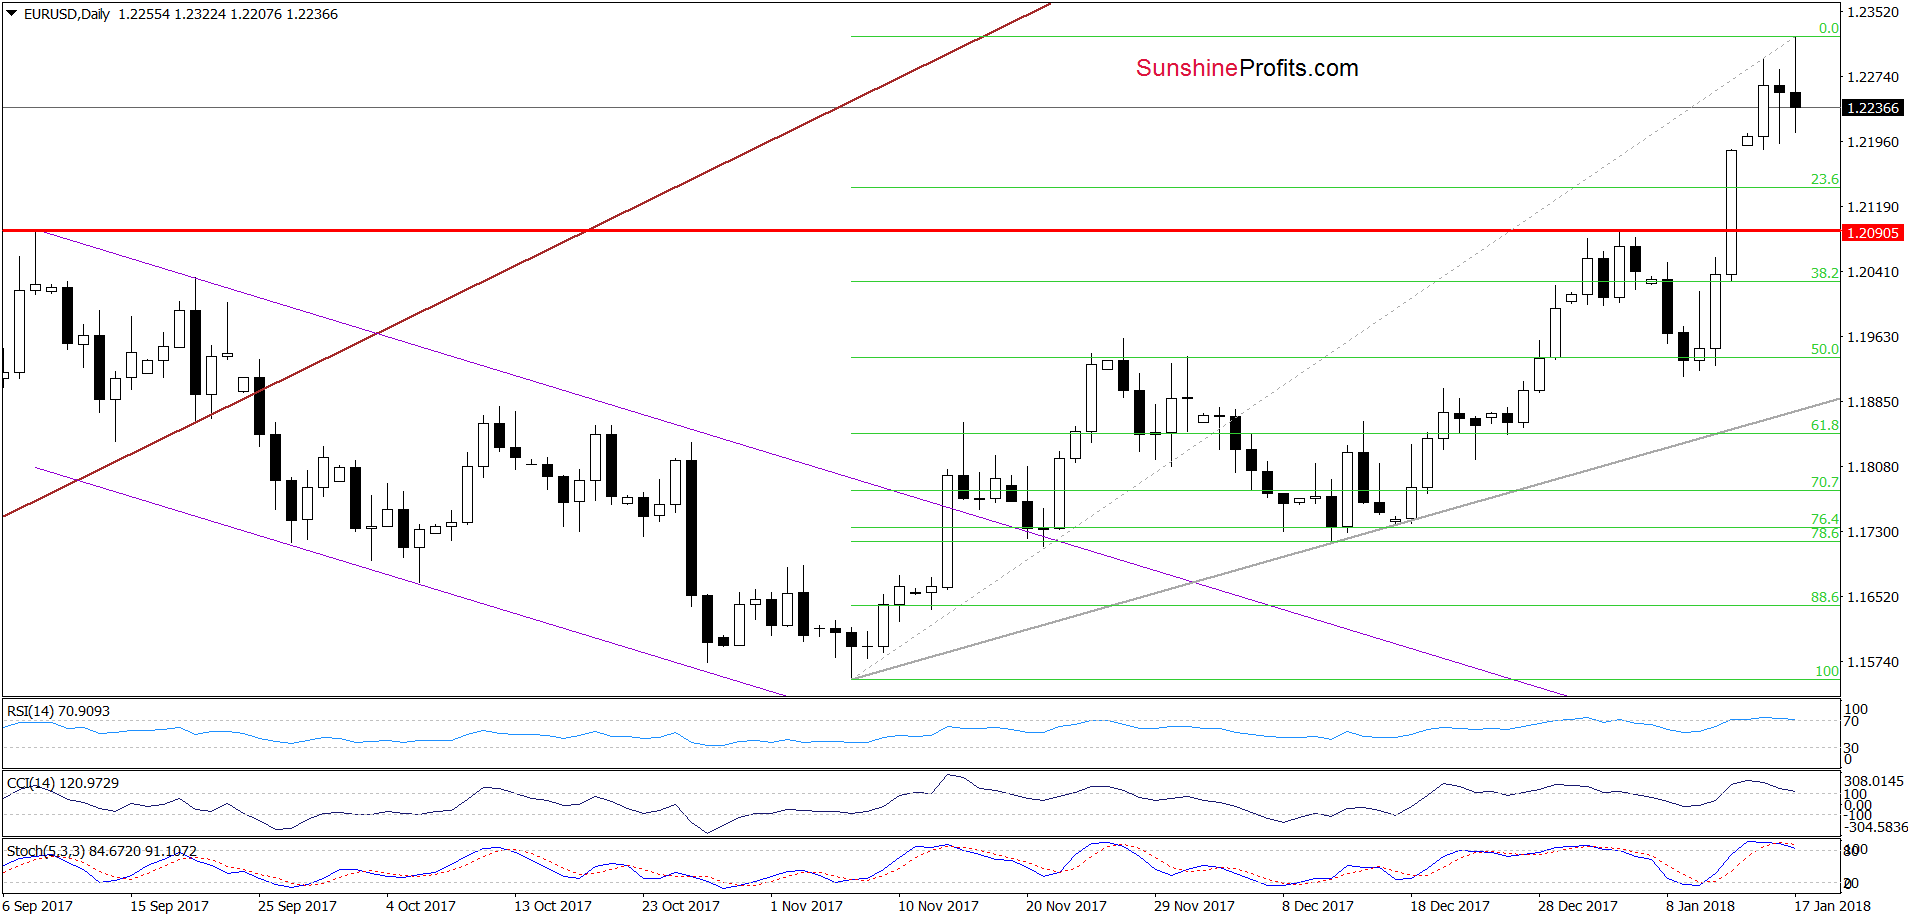
From today’s point of view, we see that although EUR/USD moved higher once again and hit a fresh 2018 peak, currency bears took control very quickly, which resulted in a reversal. In the following hours the exchange rate erased almost entire today’s increase, which doesn’t bode well for further rally – especially when we factor in the current position of the daily indicators. As you see the Stochastic Oscillator generated the sell signal, while the RSI and the CCI are very close to doing the same, which suggests that lower values of EUR/USD are just around the corner.
Therefore, if we see a daily closure under the Monday white candle low of 1.2186, we’ll consider opening small short positions with an initial downside target around 1.2100 (very probably only for a few days).
Nevertheless, please keep in mind what we wrote yesterday about a bigger move to the downside:
(…) in our opinion, a bigger move to the downside will be more likely and reliable only if we see an invalidation of the breakout above the above-mentioned Fibonacci retracement. Until this time, a pullback and a verification of the breakout above the September and January 2018 highs seems to be a more credible scenario.
Why? Because, we think that the USD Index will verify the breakdown under the lower border of the red declining trend channel at the same time. Therefore, in our opinion, as long as there is no invalidation of the breakdown under this line (you can see it on the chart below) opening [full] short positions in EUR/USD is not justified from the risk/reward perspective.
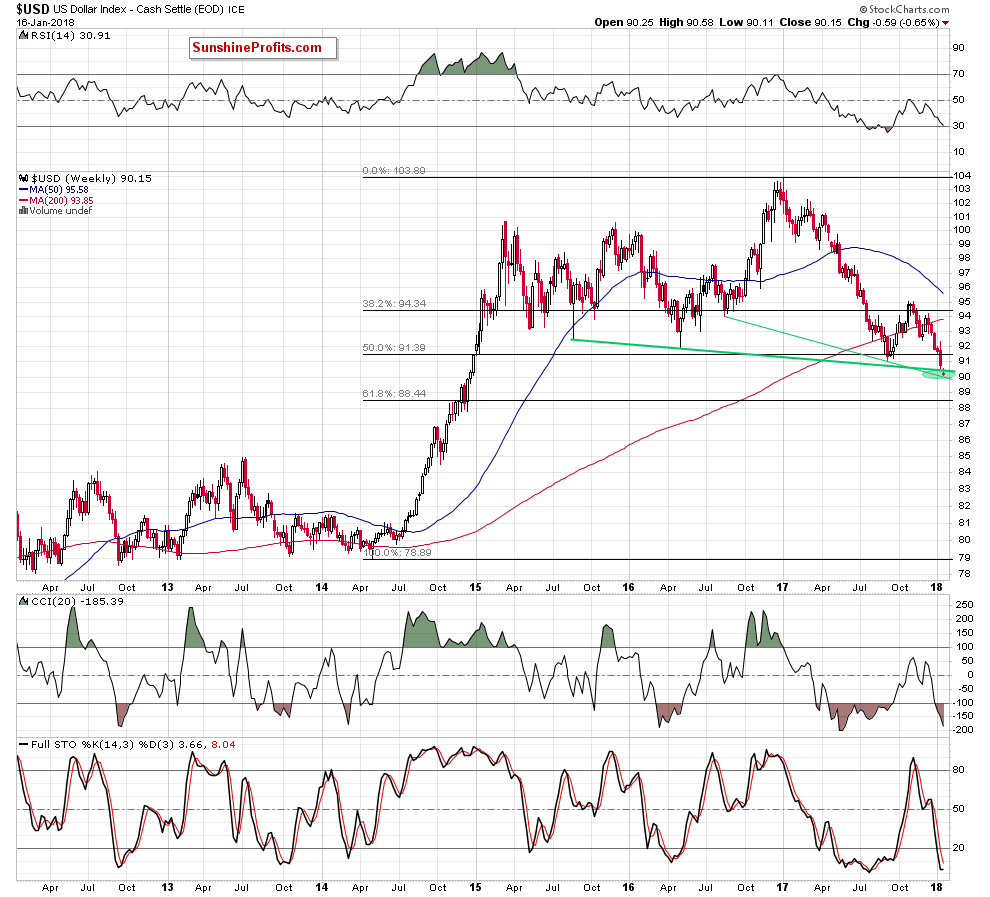
Finishing today’s commentary on this currency pair please note that the USD Index dropped to the green support zone created by two green support lines and the level of 90, which could encourage currency bulls to push the index higher (and the euro lower) in the coming days.
Trading position (short-term; our opinion): no positions are justified from the risk/reward perspective, however, if we see a daily closure under the Monday white candle low of 1.2186, we’ll consider opening small short positions with an initial downside target around 1.2100 (very probably only for a few days). We will keep you informed should anything change, or should we see a confirmation/invalidation of the above.
GBP/USD
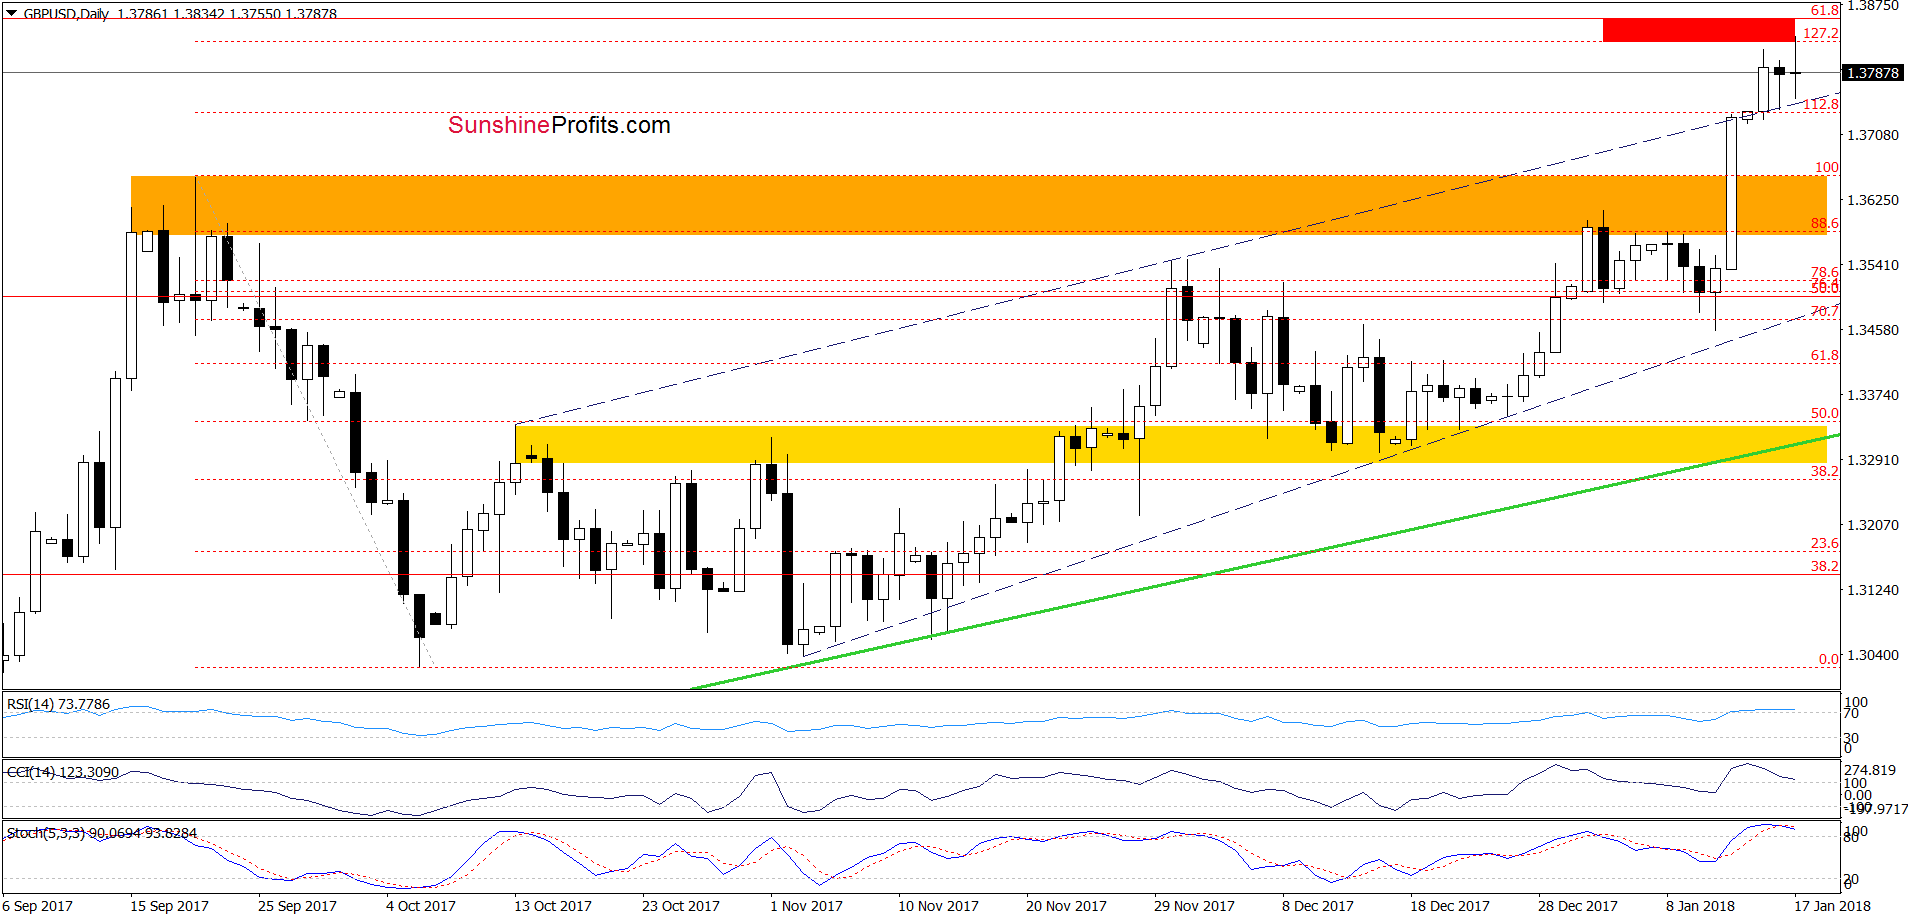
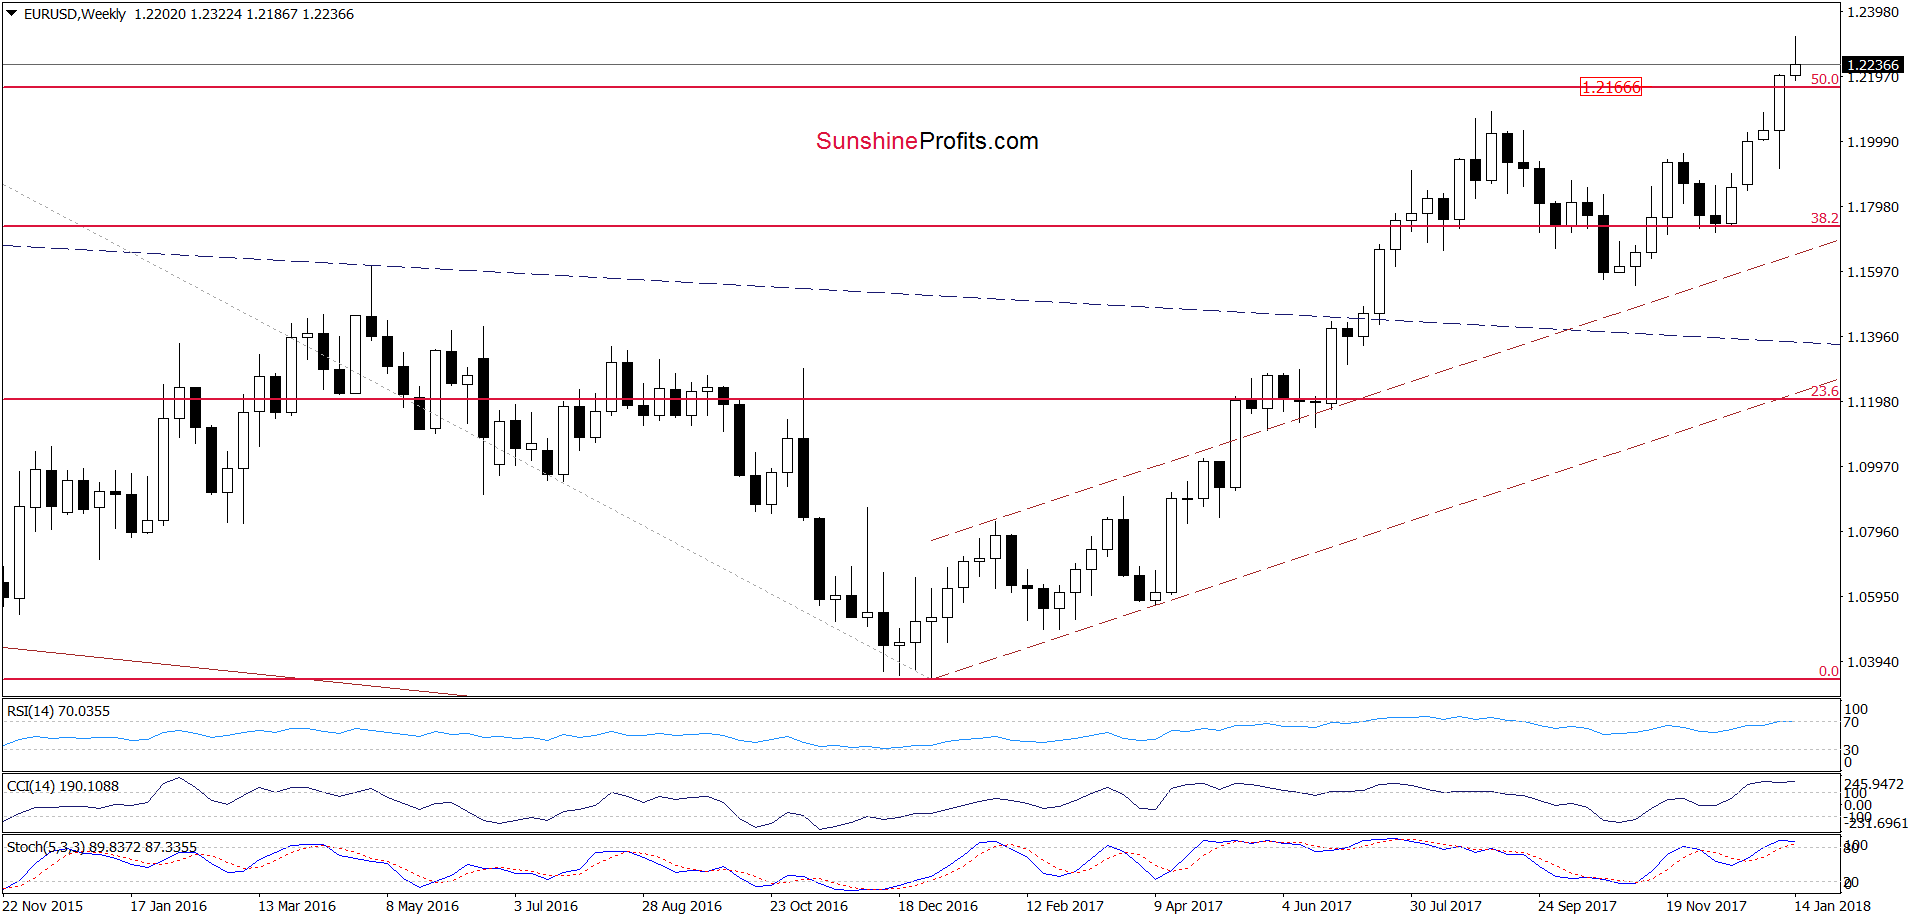
Looking at the daily chart, we see that GBP/USD broke above the upper border of the black rising trend channel (marked with dashed lines) and climbed to the red resistance zone created by the 61.8% Fibonacci retracement (it will be seen more clearly on the weekly chart below) and the 127.2% Fibonacci extension based on the entire September-October downward move.
Taking this fact into account and combining it with the current position of the daily indicators (similarly to what we wrote in the case of EUR/USD the Stochastic Oscillator generated the sell signal and the other two indicators are very close to doing the same), we think that reversal and declines should not surprise us in the coming days.
This pro-bearish scenario is also reinforced by the medium-term picture of the exchange rate. Let’s take a closer look at the chart below.
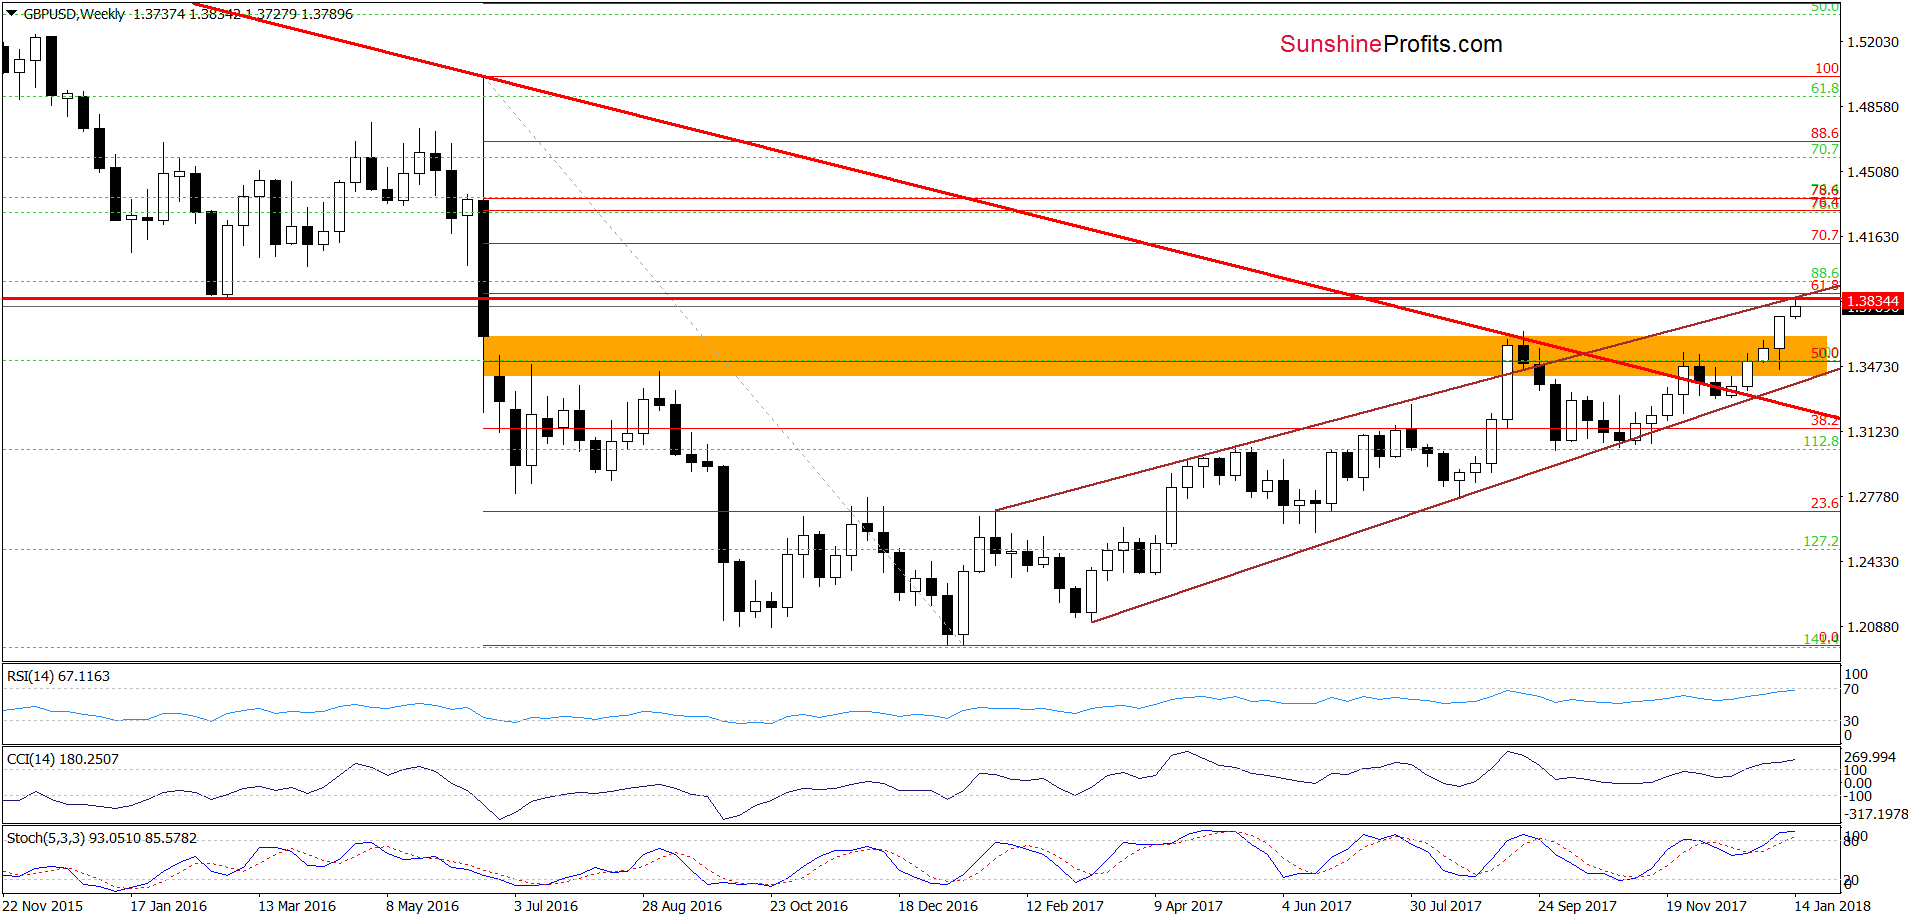
From this perspective, we see that GBP/USD also reached the red horizontal line based on the February 2016 lows and the upper border of the brown rising wedge, which together with the short-term resistances marked on the daily chart could encourage currency bears to act in the coming days.
Nevertheless, in our opinion, a bigger move to the downside will be more likely if the pair closes today’s or one of the following session under the upper line of the black rising trend channel (marked with dashed lines on the daily chart). Until this time, short-lived moves in both directions should not surprise us.
Trading position (short-term; our opinion): no positions are justified from the risk/reward perspective. We will keep you informed should anything change, or should we see a confirmation/invalidation of the above.
AUD/USD
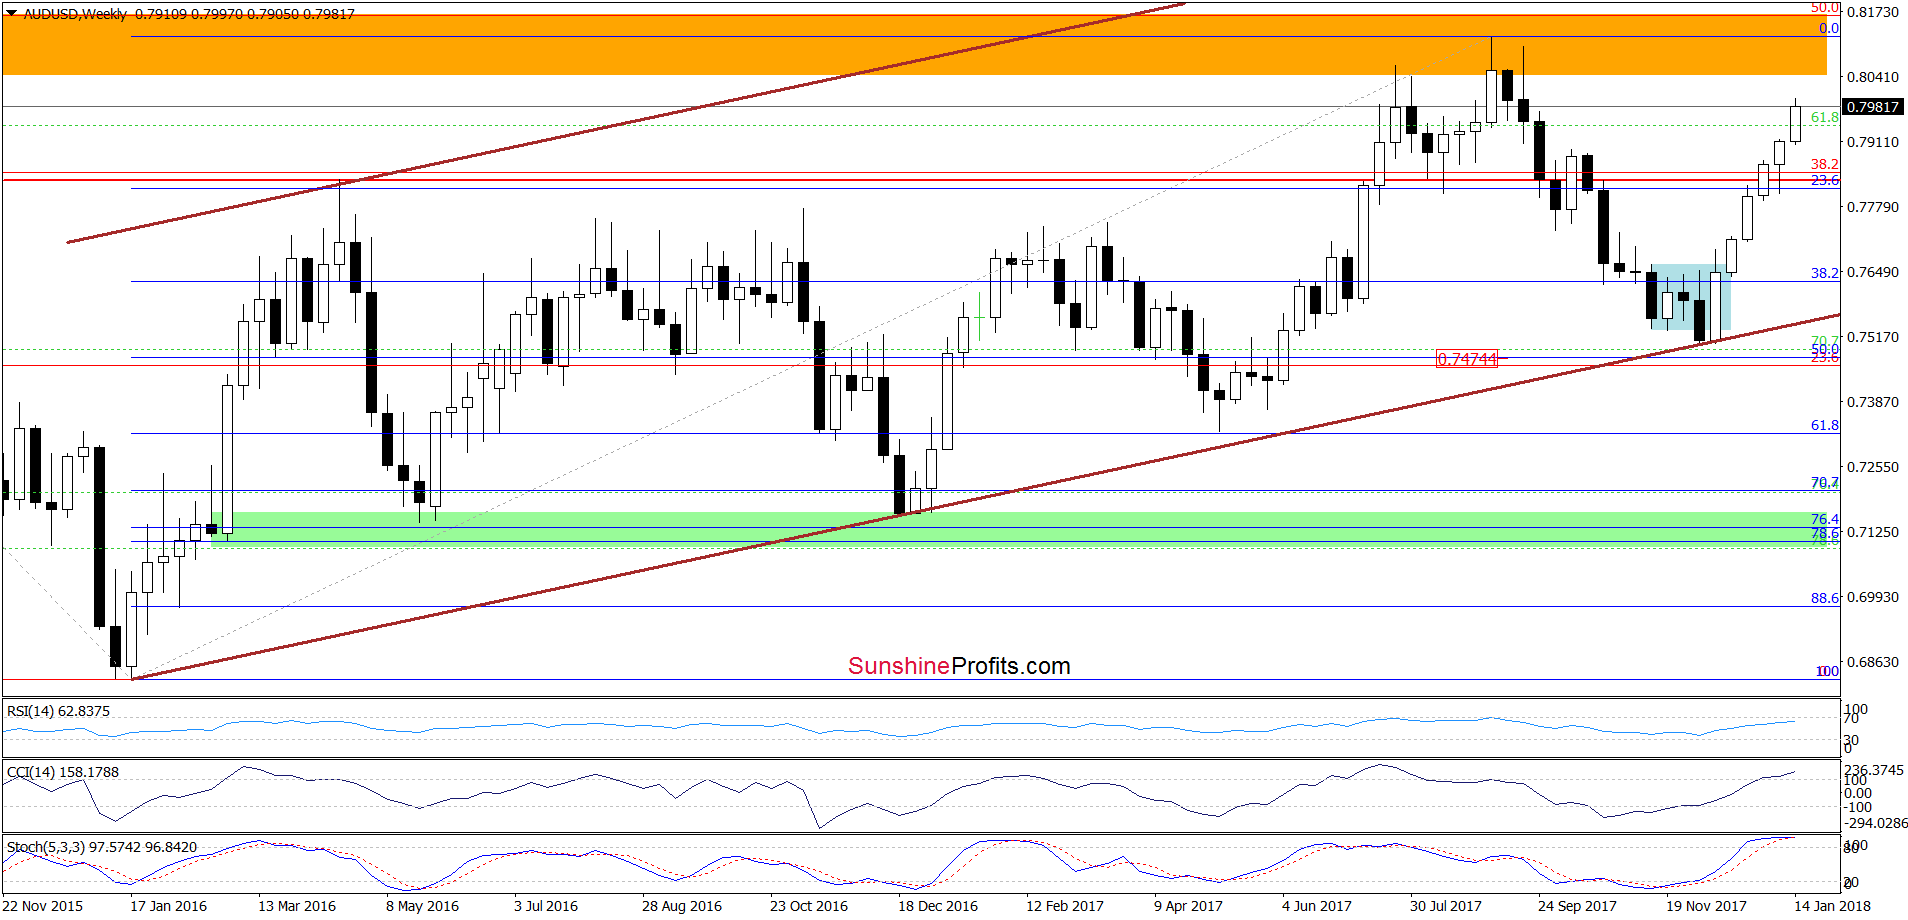
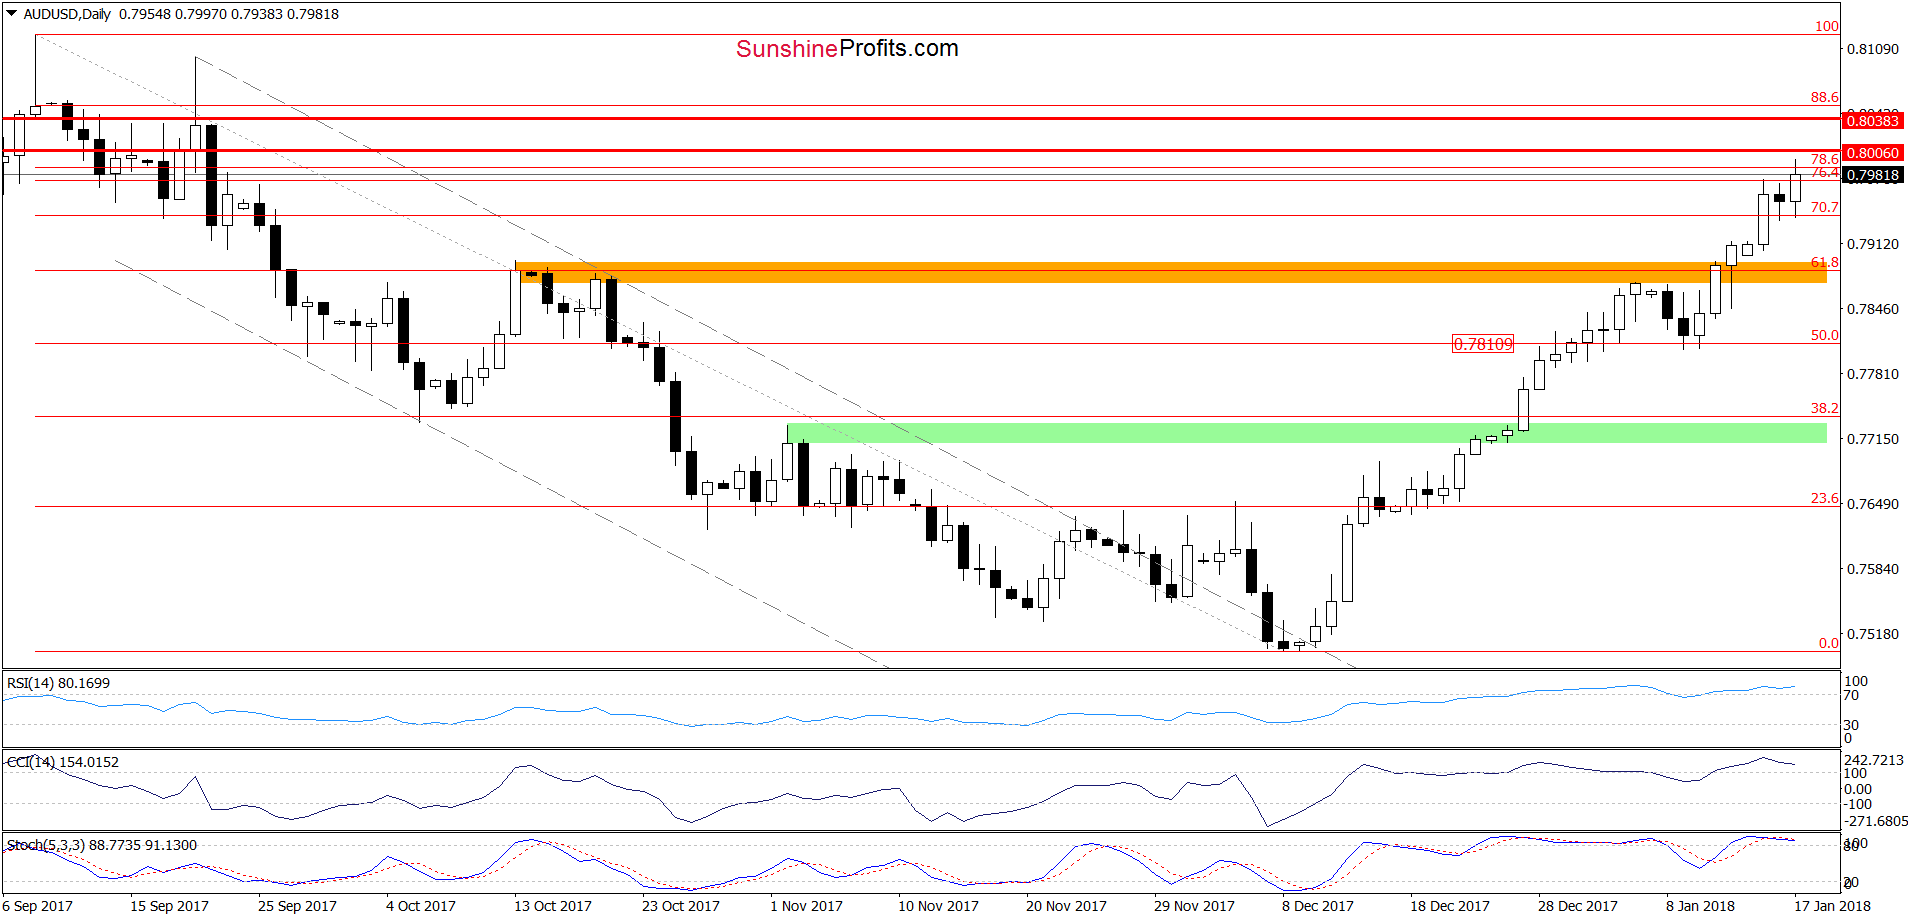
Looking at the charts, we see that AUD/USD extended gains and increased to the resistance zone created by the 76.4% and 78.6% Fibonacci retracements. Taking this fact into account, the current position of the indicators (they are very close to generating the sell signals just like in the case of EUR/USD and GBP/USD), we think that reversal and lower values of the exchange rate are just ahead of us.
Nevertheless, to have more confidence that our short positions won’t be closed by a nearby stop-loss order, we decided to pick it up to 0.8038. It is very likely that the above-mentioned resistance zone created by the Fibonacci retracements will be strong enough to stop currency bulls, which should translate into reversal and declines.
How low could AUD/USD go if we see such price action in this area? The first downside target will be around 0.7810, where the bottom of the last correction currently is. If this area is broken, we could see a downward move to around 0.7713-0.7730, where the November highs are.
Trading position (short-term; our opinion): short positions (with a stop-loss order at 0.8038 and the downside target at 0.7730) are justified from the risk/reward perspective now. We will keep you informed should anything change, or should we see a confirmation/invalidation of the above.
Thank you.
Nadia Simmons
Forex & Oil Trading Strategist
Przemyslaw Radomski, CFA
Founder, Editor-in-chief, Gold & Silver Fund Manager
Gold & Silver Trading Alerts
Forex Trading Alerts
Oil Investment Updates
Oil Trading Alerts

