

Euro looks to have made up its mind with respect to its direction after all. We also have one promising shorting candidate on our radar screen now. The kind of setup with significant upside and only limited, defined downside. The care and diligence invested simply pay off. A lot of action to talk about. We are proud to share our fresh analysis with you.
- EUR/USD: short (a stop-loss order at 1.1450; the initial downside target at 1.1260)
- GBP/USD: none
- USD/JPY: none
- USD/CAD: none
- USD/CHF: none
- AUD/USD: half of short positions (a stop-loss at 0.7228; the exit target at 0.7042)
EUR/USD
On Friday, we wrote:
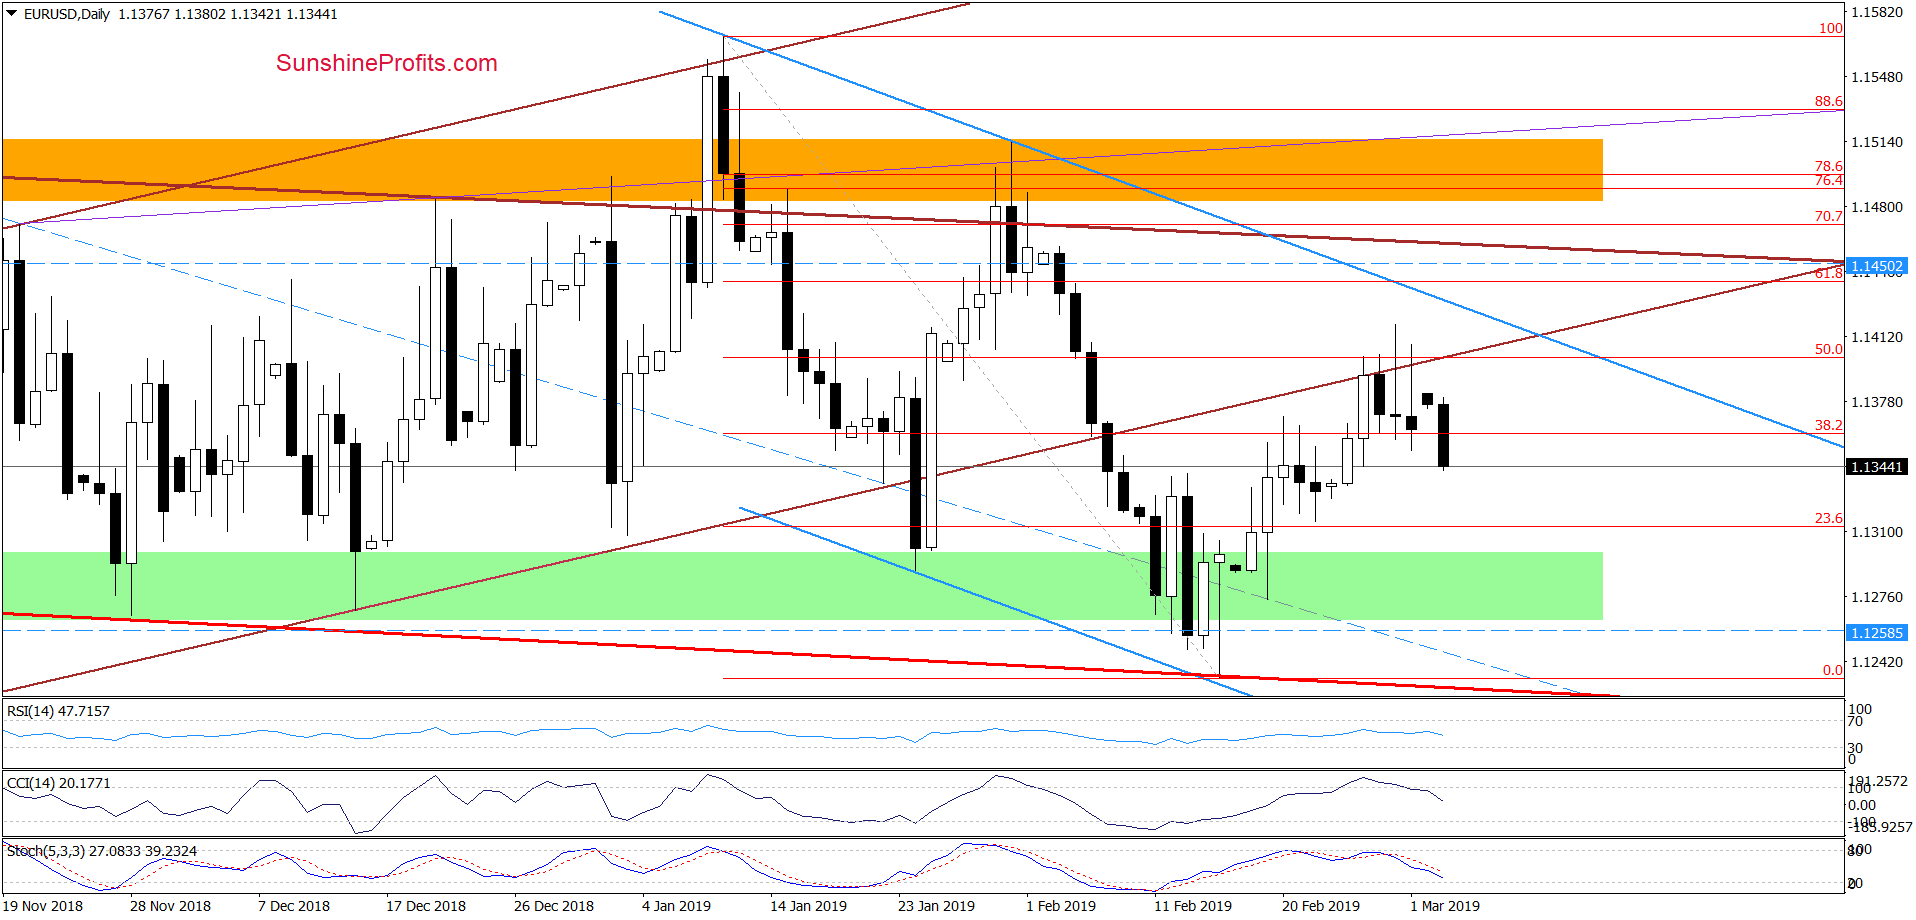
(…) the pair moved a bit higher, but taking into account yesterday’s price action, the shape of Thursday’s candlestick and the sell signals generated by the daily indicators, we think that further deterioration (and a drop to our previously mentioned targets: the last week’s lows or even the green support zone) is just around the corner.
Nevertheless, a verification of yesterday’s breakdown below the lower border of the brown trend channel before the next move down should not surprise us.
The situation developed in tune with our assumptions. EUR/USD moved higher during Friday’s session only to reverse and close the day in decline mode. This marks yet another close below the lower border of the brown rising trend channel. Combined with the sell signals generated by the daily indicators, this encouraged the sellers to act forcefully earlier today.
As a result, the exchange rate slipped below Friday’s low, which increases the probability that we’ll see our downside targets reached (the last week’s lows or even the green support zone – just like we mentioned on Friday) in the coming days.
Trading position (short-term; our opinion): already profitable short positions with a stop-loss order at 1.1450 and the initial downside target at 1.1260 are justified from the risk/reward perspective.
USD/JPY
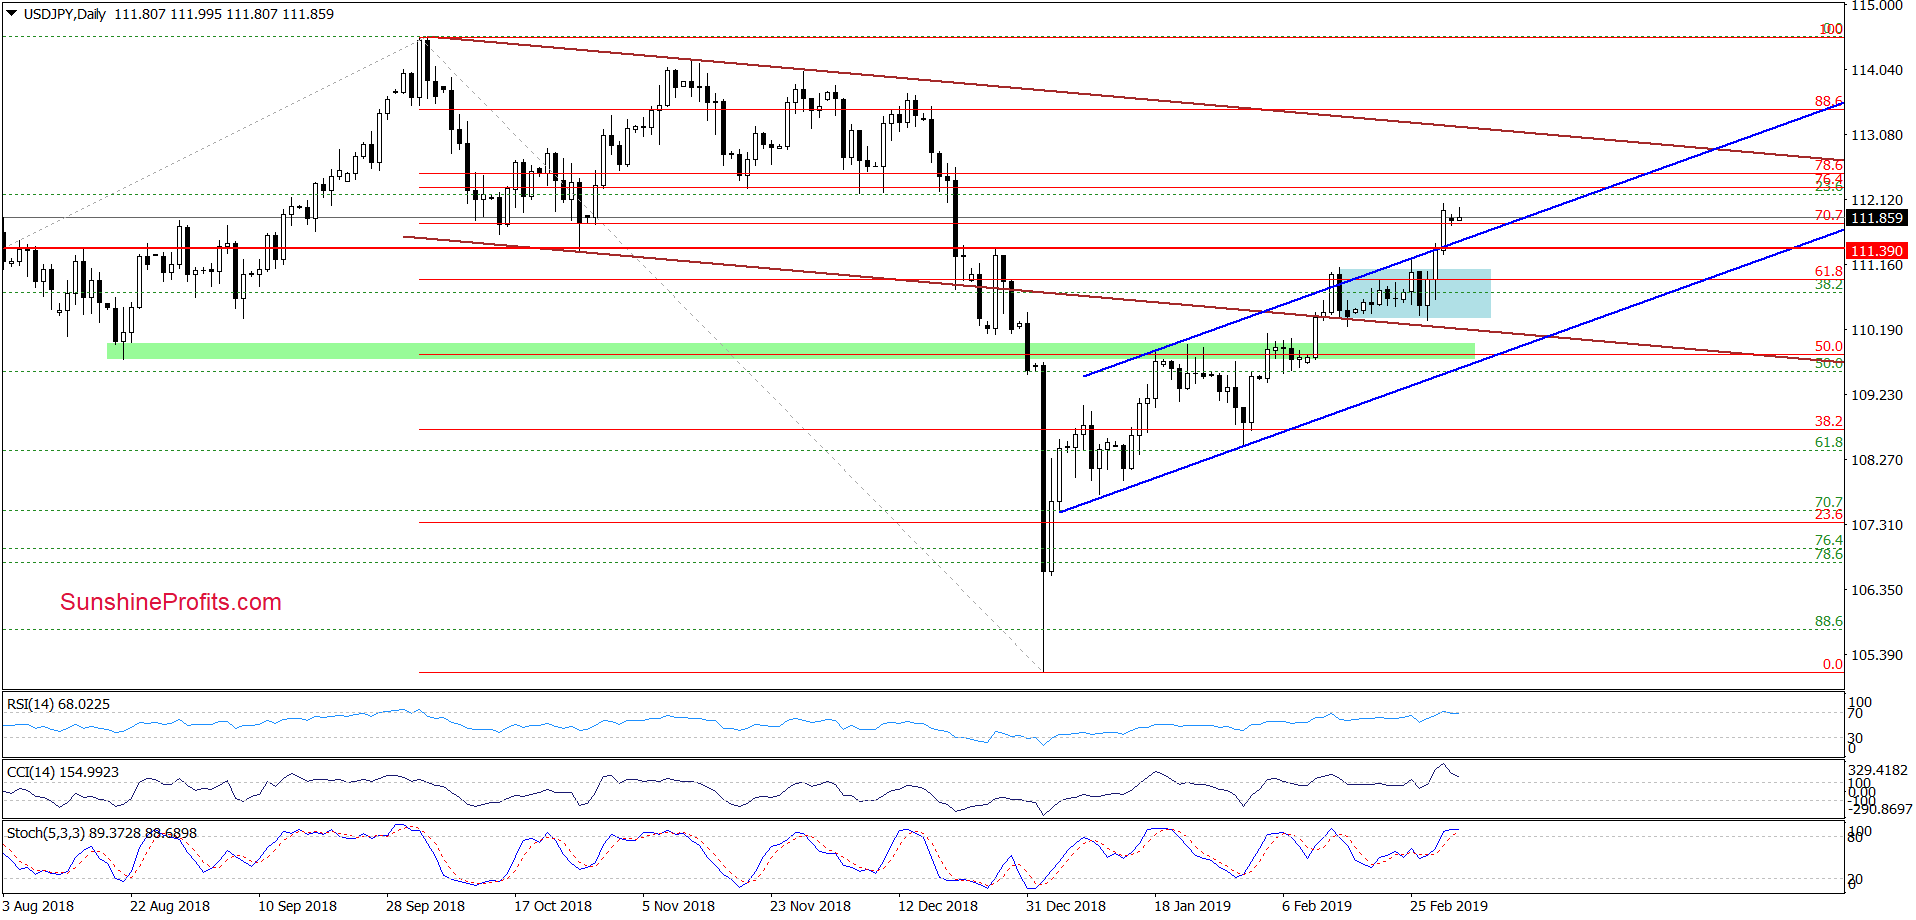
The highlight of Friday’s session was the breakout above the upper border of the blue rising trend channel. Currency bulls took USD/JPY also above the 70.7% Fibonacci retracement, which together with the lack of sell signals from the indicators suggests that we can see a test of the next resistance zone created by the 76.4% and 78.6% Fibonacci retracements in the very near future.
Nevertheless, taking into account the current position of the daily indicators, the space for gains looks to be limited and reversal later this week should not surprise. Therefore, if the sellers manage to push USD/JPY below the above mentioned upper blue trend channel line, we’ll consider opening short positions. We will keep you informed should anything change, or should we see a confirmation/invalidation of the above.
Trading position (short-term; our opinion): No positions are justified from the risk/reward perspective, but decision to open short positions is potentially just around the corner.
USD/CAD
Quoting our last commentary on this currency pair:
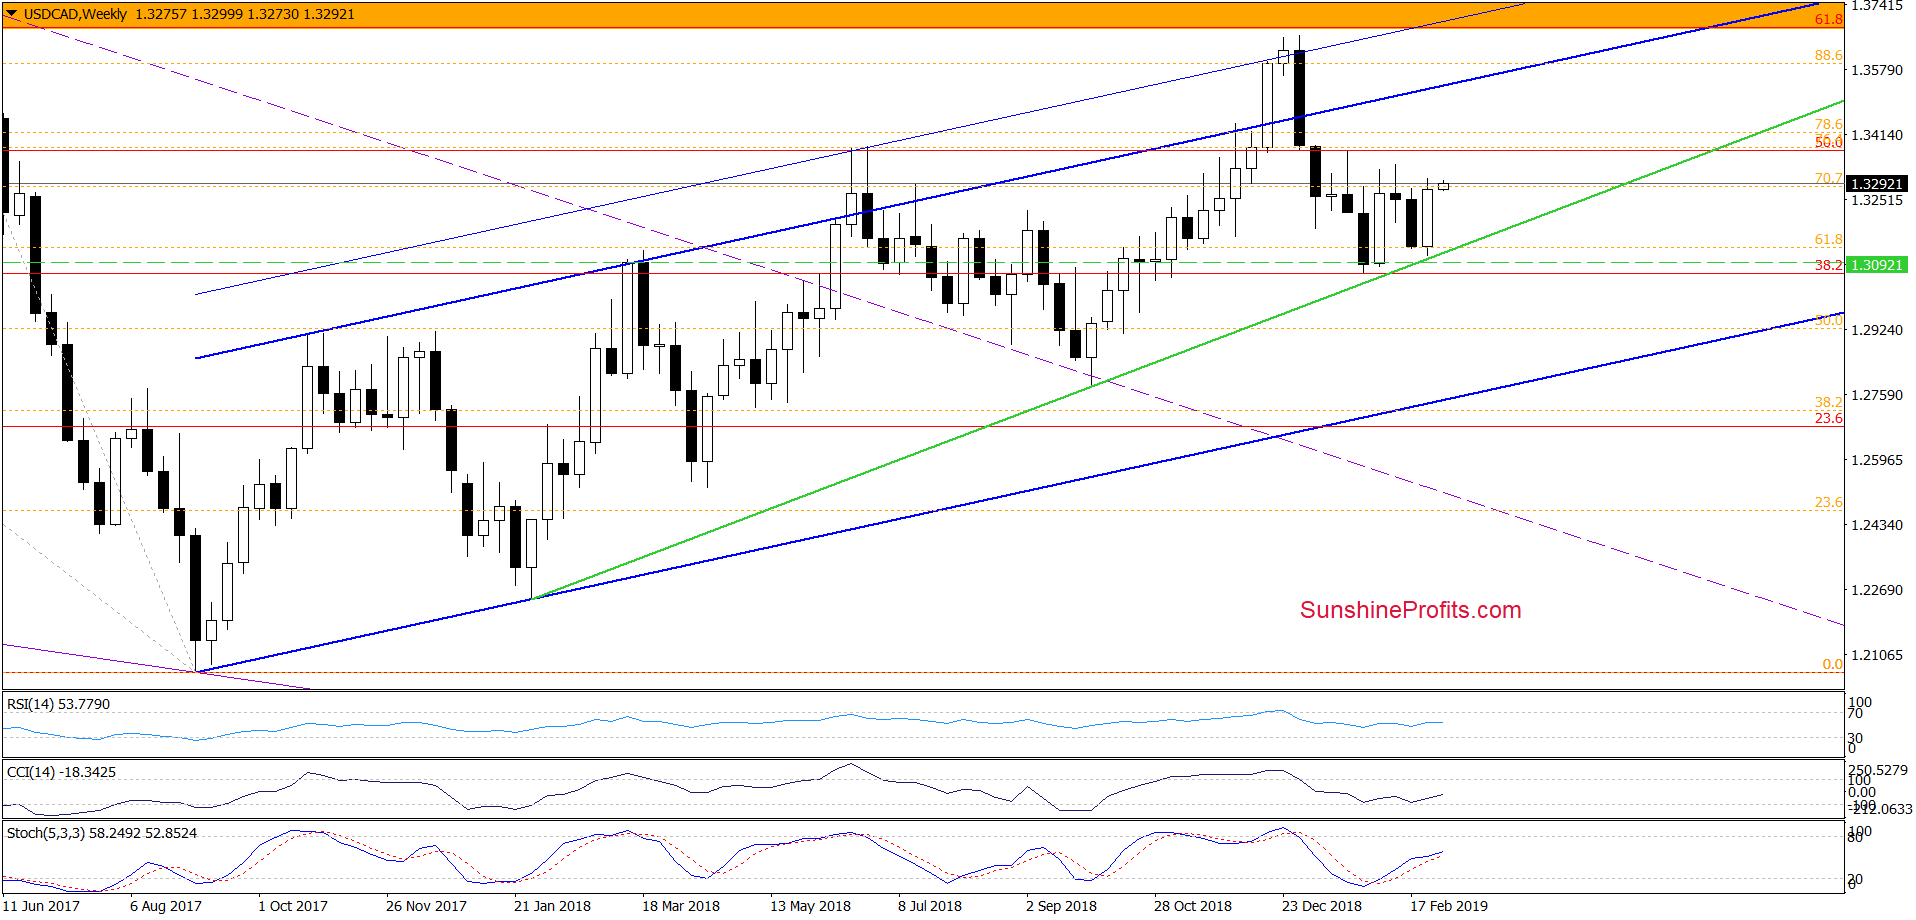
(…) the proximity to the long-term green support line encouraged the bulls to act.
Taking a closer look, we can notice that something similar happened at the beginning of the month. The history may rhyme again, which suggests higher values of the exchange rate possibly being just around the corner.
This scenario is also reinforced by the daily perspective.
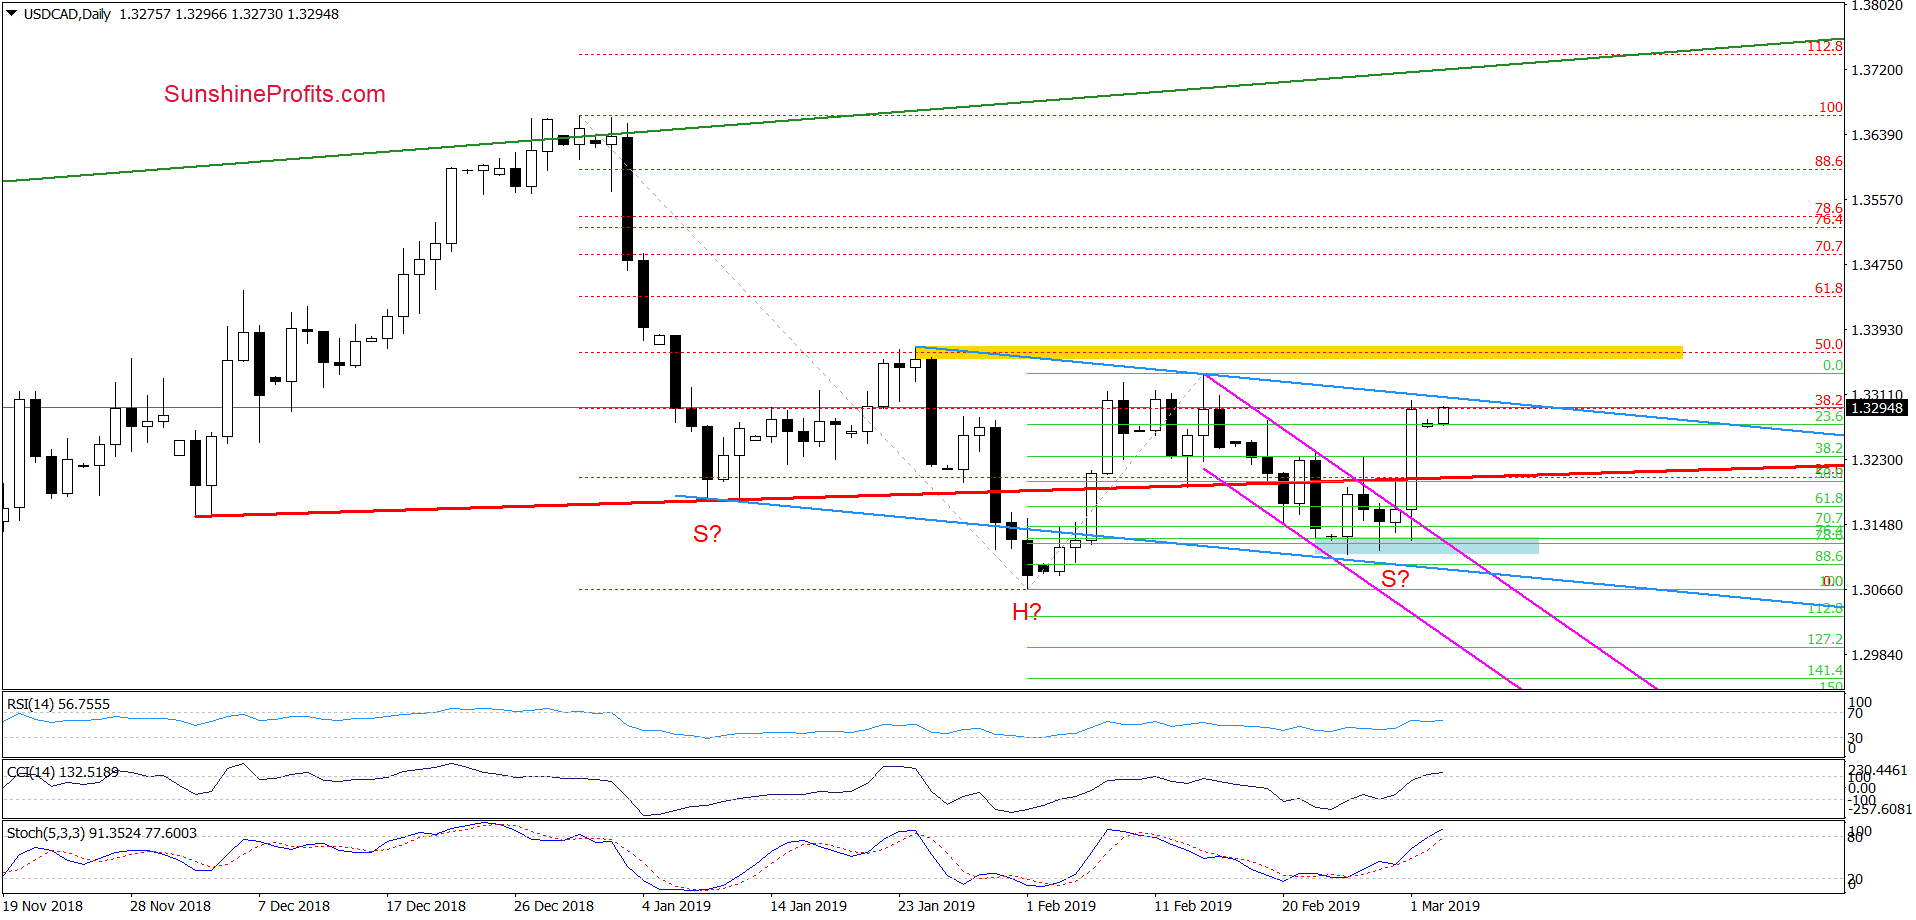
(…) the support zone based on the 76.4% and 78.6% Fibonacci retracements stopped the sellers three times in a row now, which increases the likelihood of another upside move in the near future.
Such scenario will be more likely and reliable only if the bulls manage to take USD/CAD above the upper border of the pink declining trend channel and also above the slightly rising red resistance line. If that happens, we’ll likely see a move targeting the upper blue resistance line that is based on the late-January and mid-February peaks. This would be the neck line of a potential reverse head and shoulders formation that we have marked with appropriate letters for your convenience on the chart.
The market proved us right. The currency bulls not only pushed USD/CAD above the upper line of the pink channel, but also approached our next upside target – the blue resistance line, which could be a neck line of a potential reverse head and shoulders pattern.
Should we see a breakout above this important line and the yellow resistance zone, we’ll consider opening long positions. We will keep you informed should anything change, or should we see a confirmation/invalidation of the above.
Trading position (short-term; our opinion): No positions are justified from the risk/reward perspective.
Thank you.
Nadia Simmons
Forex & Oil Trading Strategist

