

Seems like the euro can't make up its mind where to go next. That would be a cursory glance, that is. There are powerful signs building beneath the surface. Don’t forget the Swiss franc and Australian dollar either. Let’s take a close look at them all.
- EUR/USD: short (a stop-loss order at 1.1450; the initial downside target at 1.1260)
- GBP/USD: none
- USD/JPY: none
- USD/CAD: none
- USD/CHF: none
- AUD/USD: half of short positions (a stop-loss at 0.7228; the exit target at 0.7042)
EUR/USD
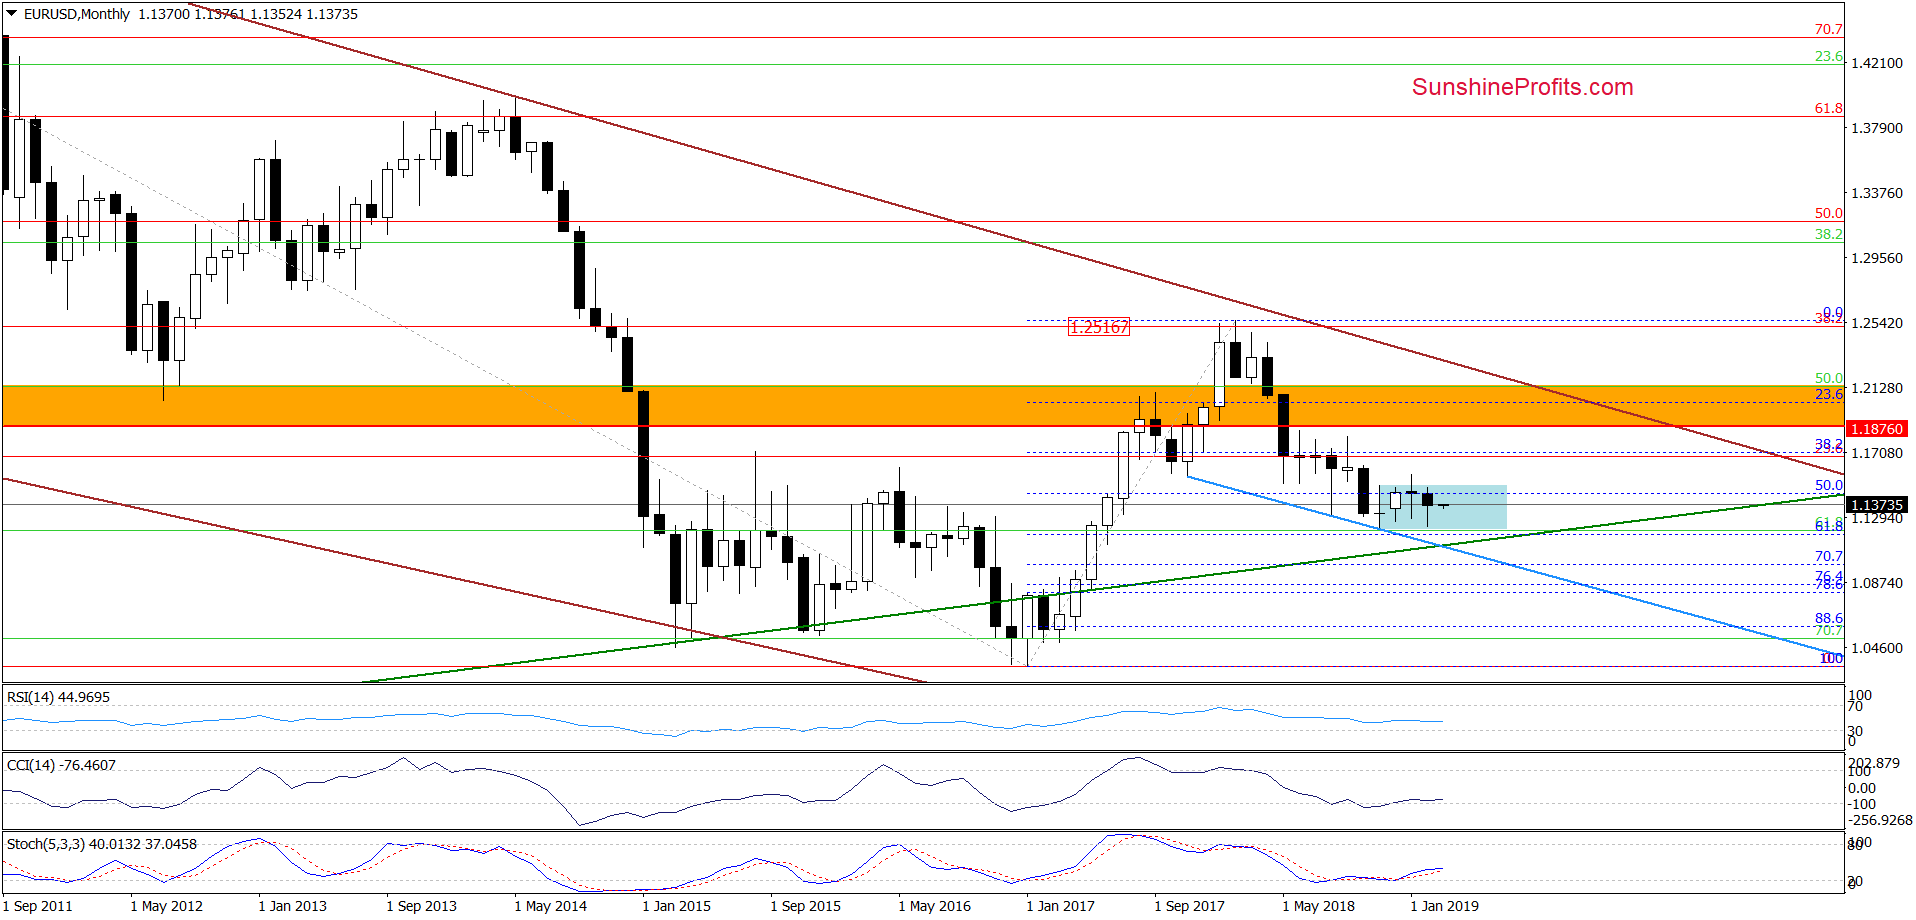
Looking at the monthly chart, we see that the overall situation in the long term hasn’t changed much. EUR/USD is still trading inside the blue consolidation slightly above three very important supports: the long-term green rising line, the blue declining line based on the November 2017 and August 2018 lows (which stopped the sellers in November 2018 and could be a neck line of a potential head and shoulders formation that has the late 2017 top as the head) and the 61.8% Fibonacci retracement based on the entire 2017-2018 upward move.
Such price action suggests that as long as there is no successful breakout above the upper line of the formation (confirmed by a monthly close) or a breakdown below the above-mentioned supports, another significant move is not likely to be seen.
Nevertheless, short-lived moves in both directions are very likely. Let’s take a look at the daily chart and find out where will EUR/USD would be likely heading in the coming week.
Yesterday, we wrote:
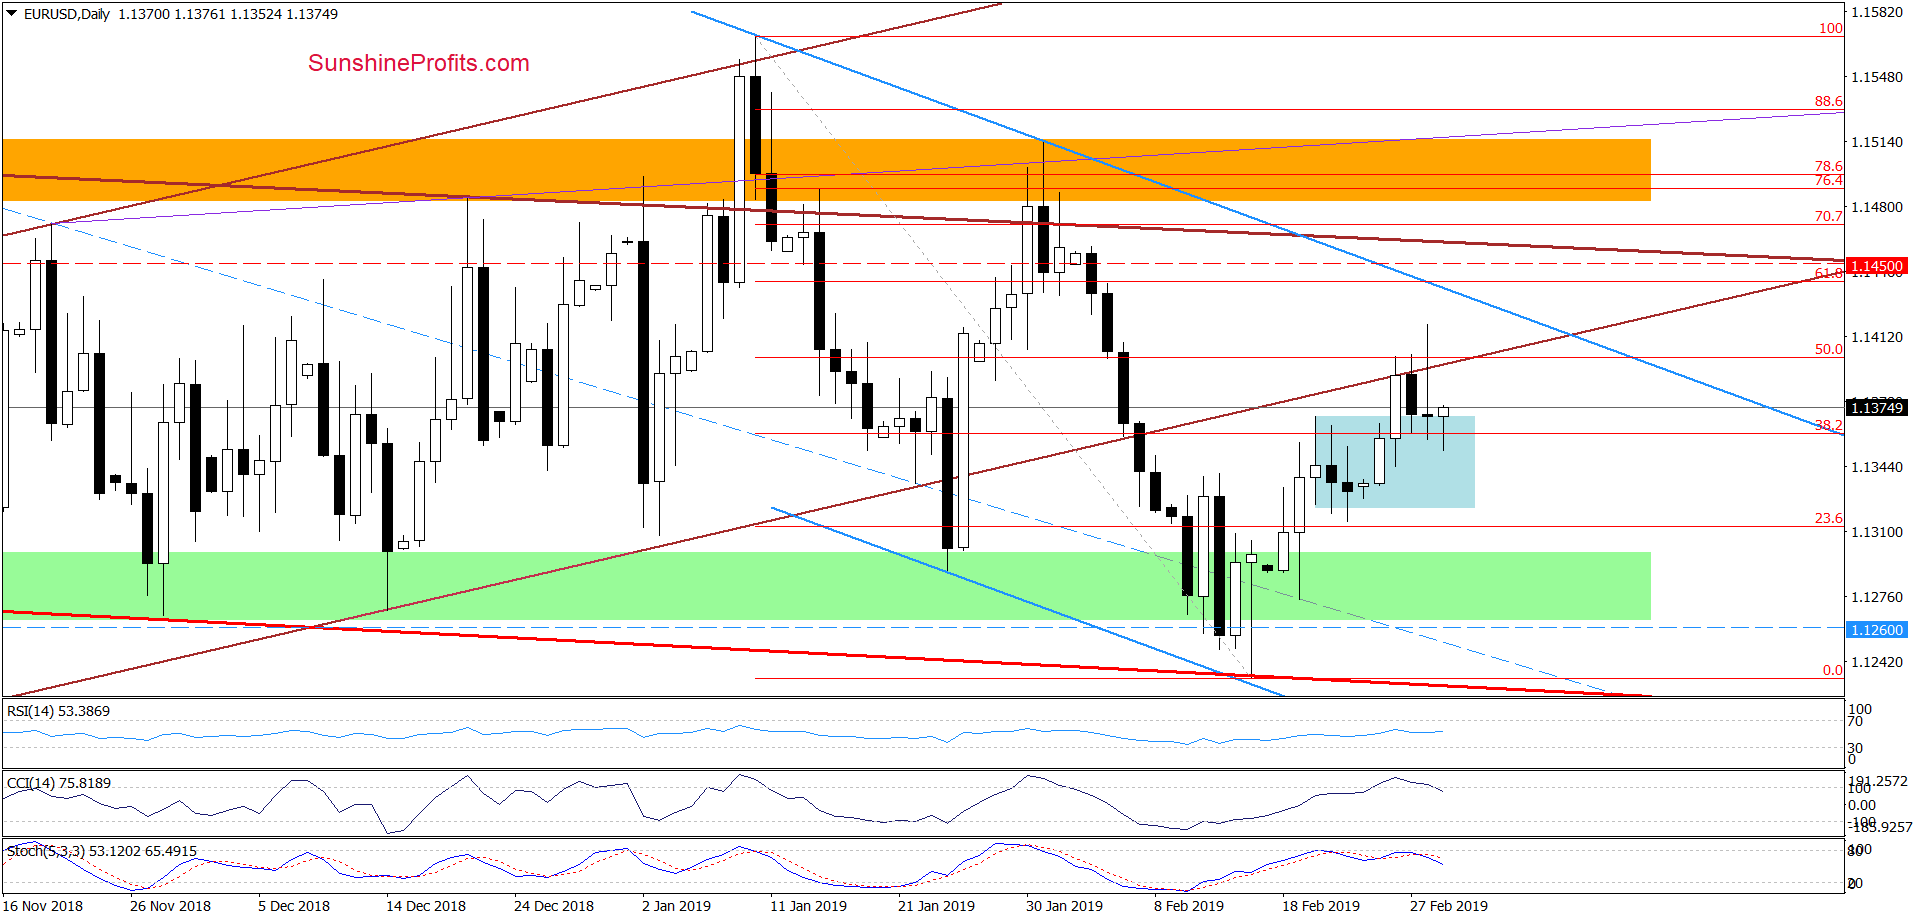
(…) taking into account the proximity to the 618% Fibonacci retracement based on the entire January-February downward move, the blue resistance line based on the January peaks and the current position of the indicators, we think that the space for further gains is limited.
Therefore, reopening short positions is justified from the risk/reward perspective.
Our assumptions turned out to be validated. Currency bears took the exchange rate back below the previously broken lower border of the brown rising trend channel and invalidated the earlier breakouts above this line, the recent peaks and the 50% Fibonacci retracement, making our short positions profitable.
Earlier today, the pair moved a bit higher, but taking into account yesterday’s price action, the shape of Thursday’s candlestick and the sell signals generated by the daily indicators, we think that further deterioration (and a drop to our previously mentioned targets: the last week’s lows or even the green support zone) is just around the corner.
Nevertheless, a verification of yesterday’s breakdown below the lower border of the brown trend channel before the next move down should not surprise us.
Trading position (short-term; our opinion): already profitable short positions with a stop-loss order at 1.1450 and the initial downside target at 1.1260 are justified from the risk/reward perspective.
USD/CHF
Quoting our Monday’s commentary:
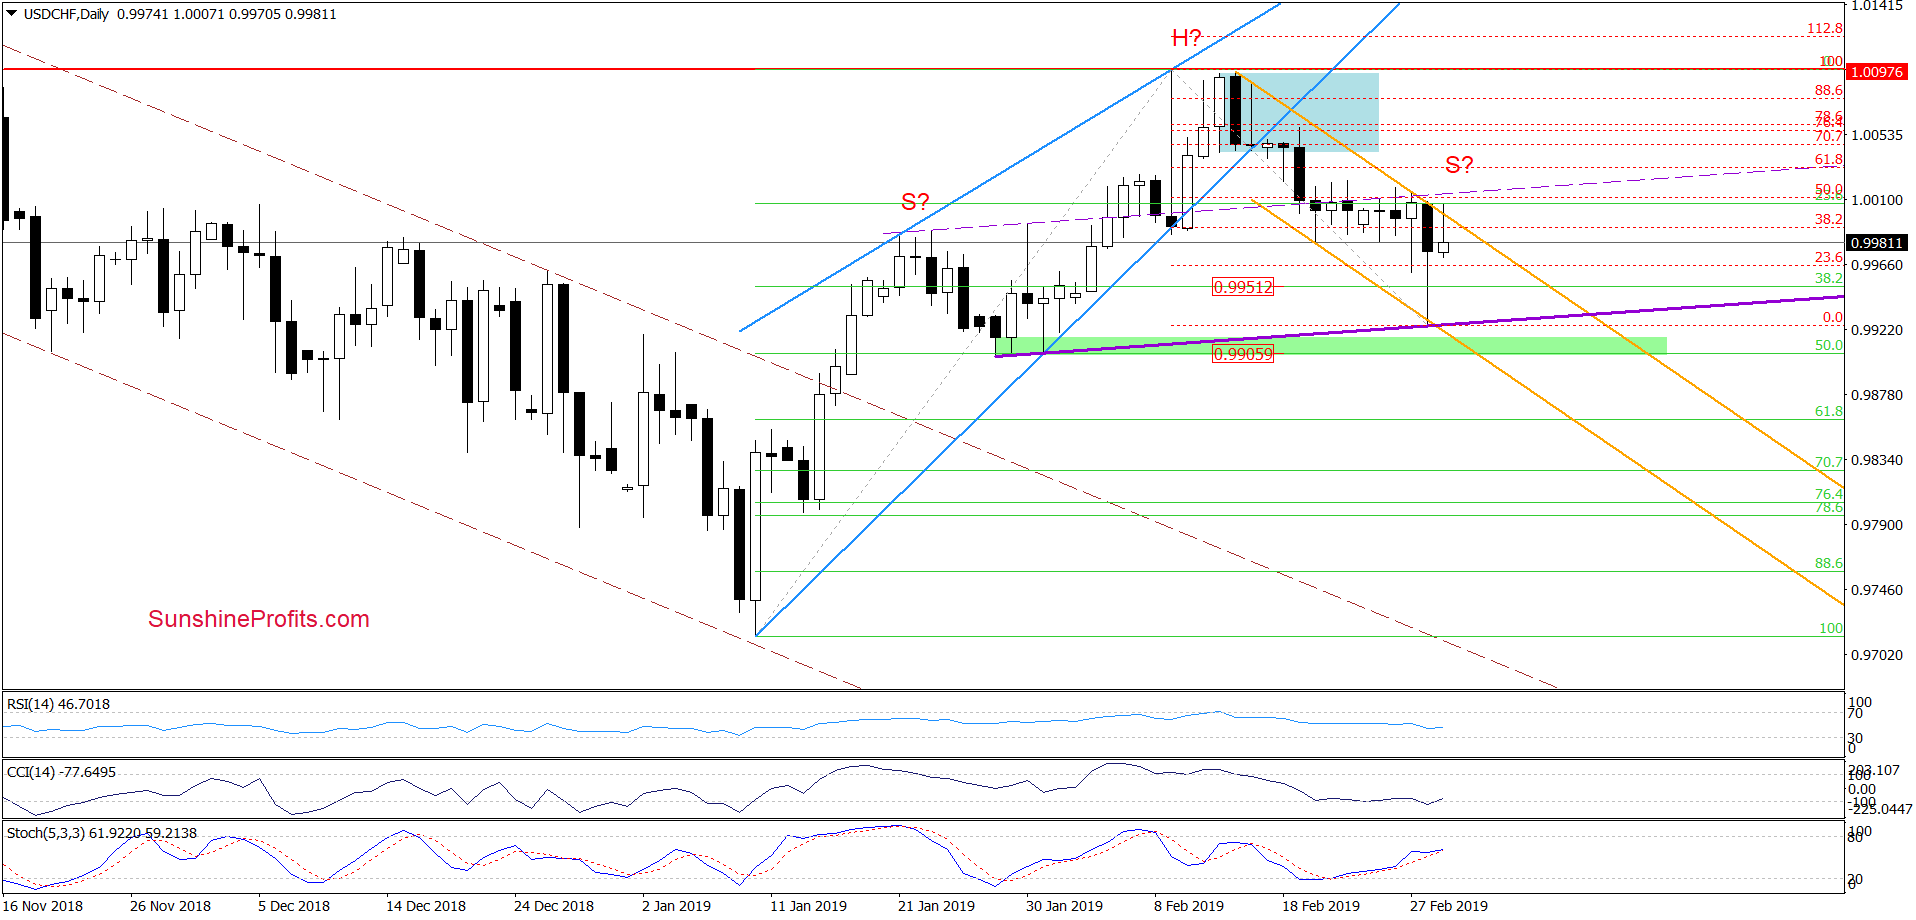
(…) considering the current position of the daily indicators (…) it seems that sellers can still try to push the exchange rate lower.
If they succeed, USD/CHF will likely test the 38.2% Fibonacci retracement based on the entire January-February upward move in the coming week.
On the daily chart, we see that USD/CHF not only tested, but also slipped slightly below the 38.2% Fibonacci retracement during yesterday’s session. Despite this deterioration, the breakdown was quickly invalidated, and the pair closed the day well above the Wednesday’s low.
This positive event encouraged the buyers to attempt more of the same also today, but the combination of the 50% Fibonacci retracement (based on the recent declines) and the upper line of the orange declining trend channel stopped them, triggering a pullback.
What’s next? The buy signals generated by the indicators support another attempt to move higher. However, as long as there is no breakout above the mentioned resistances, a retest of yesterday low and the purple support line can’t be ruled out.
Speaking about it, the purple support line could be a neck line of a potential head and shoulders top formation. However, only a daily close below it would activate any implications of that formation. Until that time, the potential right arm of the pattern would be underway – and that doesn’t have any implications yet. We will keep you informed should anything change, or should we see a confirmation/invalidation of the above.
Trading position (short-term; our opinion): No positions are justified from the risk/reward perspective.
AUD/USD
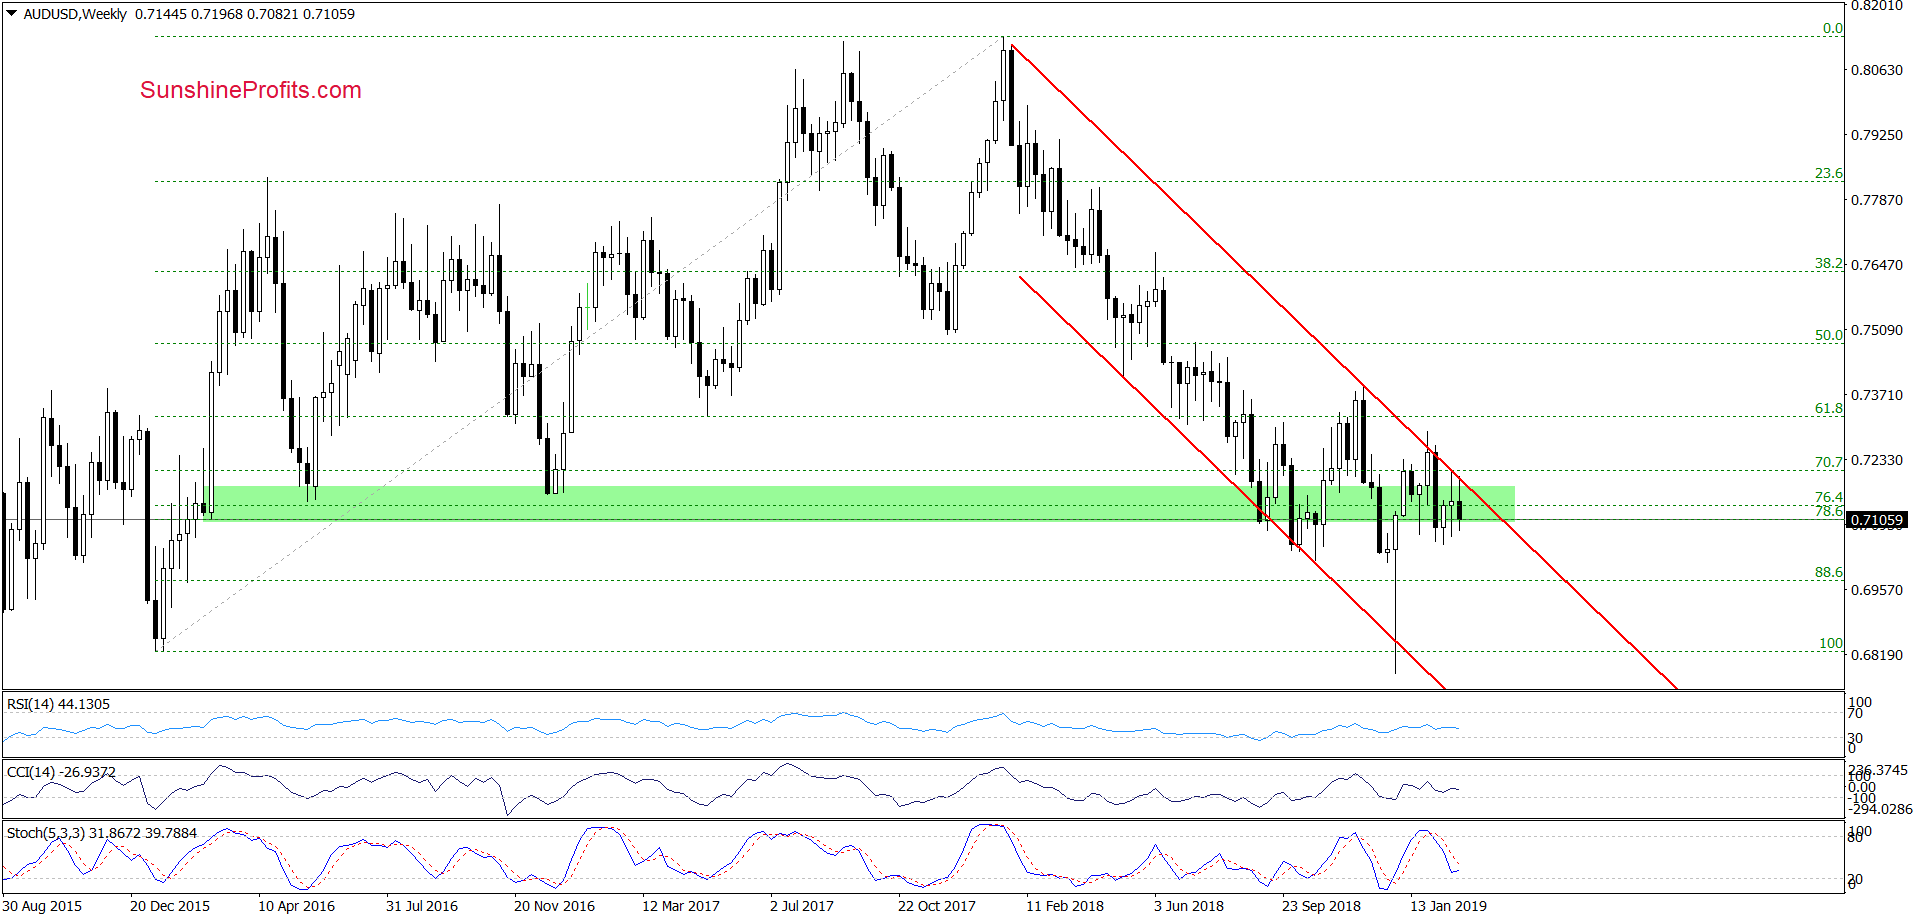
Looking at the weekly chart, we see that although currency bulls pushed AUD/USD higher earlier this week, the upper border of the red declining trend channel stopped them once again, triggering a move to the downside. The price action remains confined to the declining red trend channel.
How did this price action affect the daily chart?
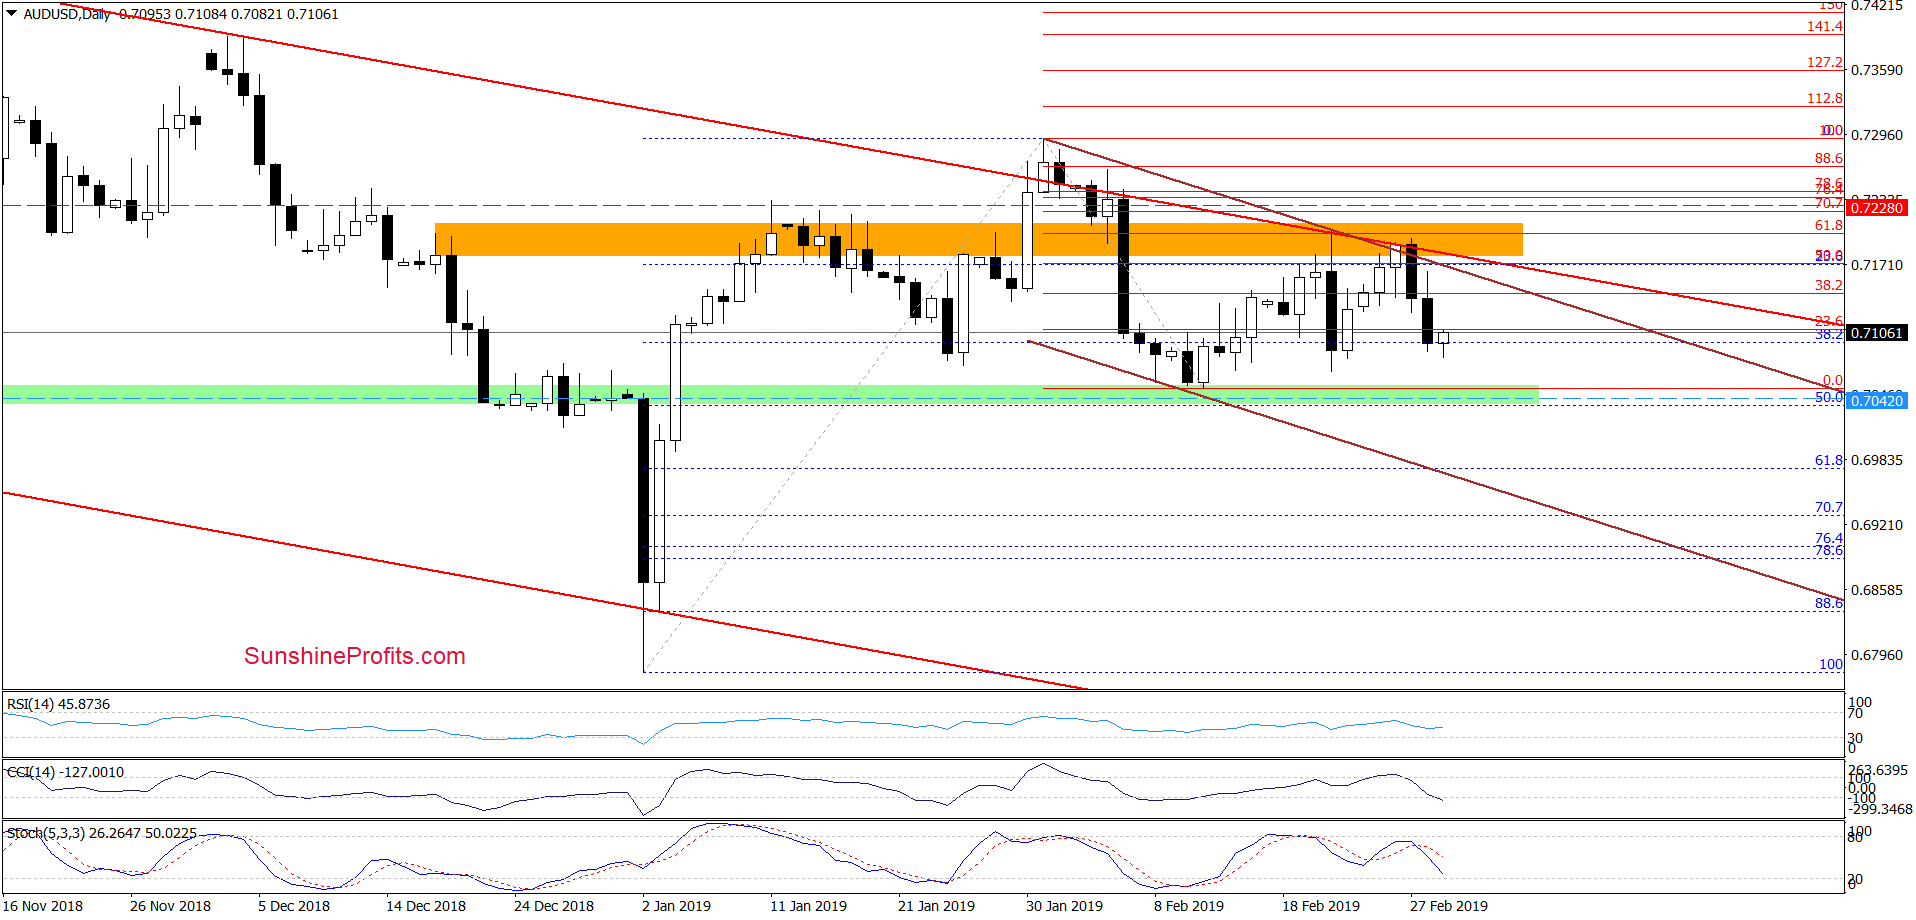
Before answering, let’s recall our Monday’s alert first:
(…) AUD/USD extended gains and came back to the major orange resistance area that is further supported by the 61.8% Fibonacci retracement based on the entire February decline, the upper border of the long-term red declining trend channel and the upper line of the short-term brown declining trend channel.
The combination of these resistances was strong enough to stop the buyers and trigger a sharp downswing in the previous week. It suggests that history can repeat itself once again in the very near future.
If the situation develops in tune with our assumptions and AUD/USD turns south, it’ll likely retest the green support zone or even slip to/below our exit downside target in the following day(s).
Our expectations were again validated and the situation developed in tune with the above scenario. Currency bears showed some nice downside momentum in recent days. Earlier today, we noticed a small rebound, but taking into account the sell signals generated by the weekly and daily indicators, we believe that the odds continue to favor lower values of AUD/USD.
Trading position (short-term; our opinion): Half of profitable short positions (with a stop-loss order at our entry level at 0.7228 and the exit target at 0.7042) are justified from the risk/reward perspective.
Thank you.
Nadia Simmons
Forex & Oil Trading Strategist

