

We have seen some sharp movements in prior day in the forex world. To your delight, namely in the euro. Don’t be deceived by today’s relative calm. Is there a storm brewing on the horizon? Let’s dive in to find out.
- EUR/USD: short (a stop-loss order at 1.1450; the initial downside target at 1.1260)
- GBP/USD: none
- USD/JPY: none
- USD/CAD: none
- USD/CHF: none
- AUD/USD: half of short positions (a stop-loss at 0.7228; the exit target at 0.7053 – we are slightly tightening, full explanation below)
EUR/USD
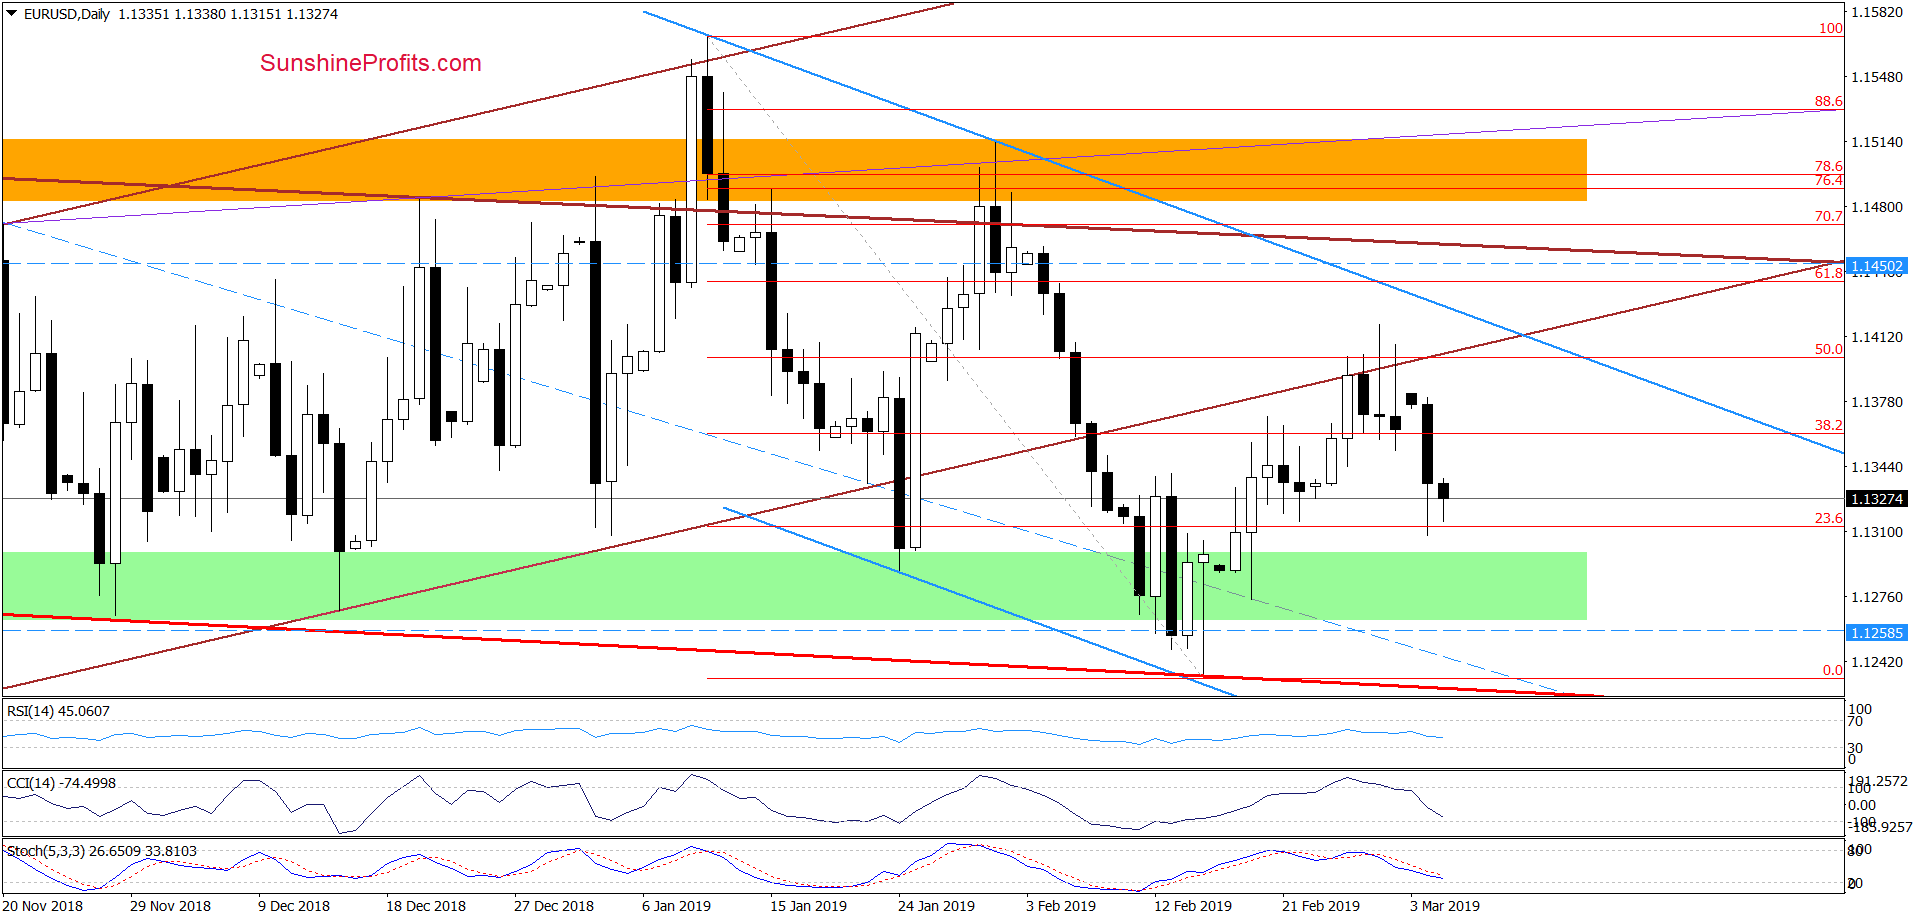
Although EUR/USD rebounded before yesterday’s close, the sellers took the exchange rate lower earlier today. The pair is approaching yesterday’s lows again. Combined with daily indicators’ sell signals, this suggests that further deterioration and a test of the green support zone is a question of time, any short-lived pause or even upside move attempt notwithstanding.
Trading position (short-term; our opinion): already profitable short positions with a stop-loss order at 1.1450 and the initial downside target at 1.1260 are justified from the risk/reward perspective.
USD/CHF
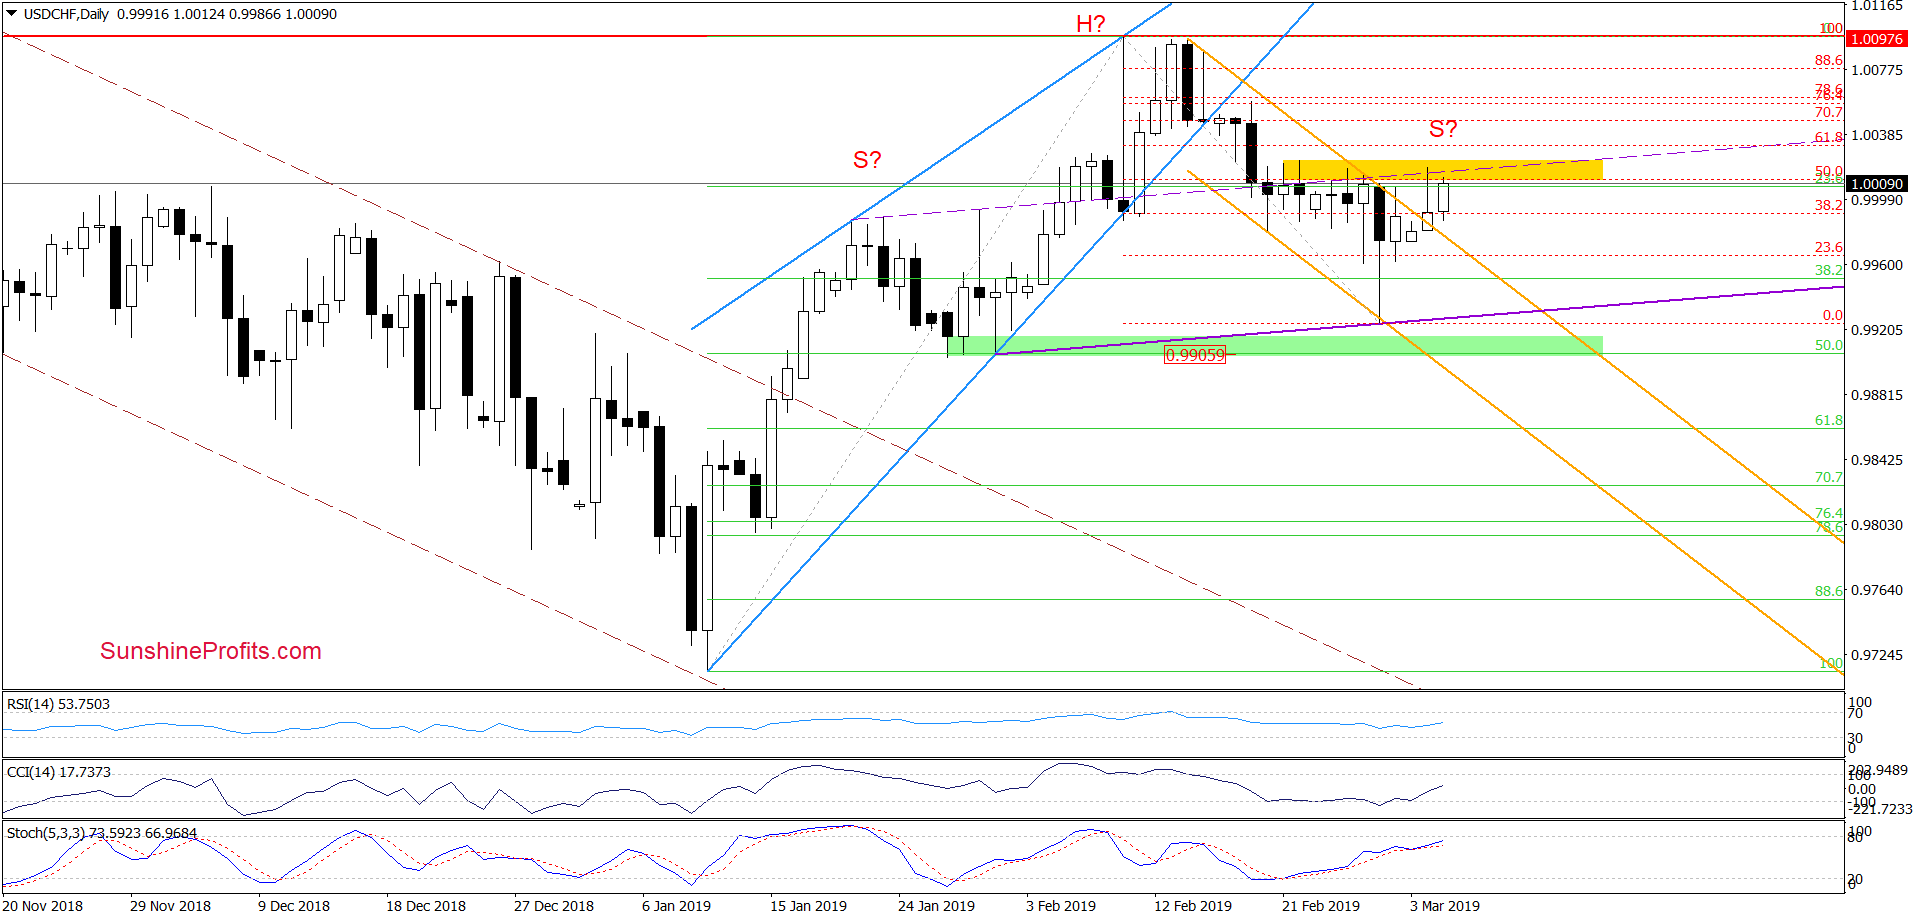
The yellow resistance zone (created by the previous highs and the 50% Fibonacci retracement) stopped the buyers yesterday, triggering a pullback as evidenced by the long upper knot. On the downside, the pair approached the previously broken upper border of the orange declining trend channel, but the bulls were strong enough to close the day above this support line.
This verification of the earlier breakout encouraged the buyers to act earlier today. They took the price back to the vicinity of the Monday’s peak and the above mentioned yellow resistance zone.
The buy signals generated by the daily indicators continue to support the bulls. In our opinion however, higher values of USD/CHF will be more likely and reliable only if we see a successful breakout above the yellow resistance first.
Finally, let’s remember what we wrote on Friday:
(…) the purple support line could be a neck line of a potential head and shoulders top formation. However, only a daily close below it would activate any implications of that formation. Until that time, the potential right arm of the pattern would be underway – and that doesn’t have any implications yet.
Trading position (short-term; our opinion): No positions are justified from the risk/reward perspective. We will keep you informed should anything change, or should we see a confirmation/invalidation of the above.
AUD/USD
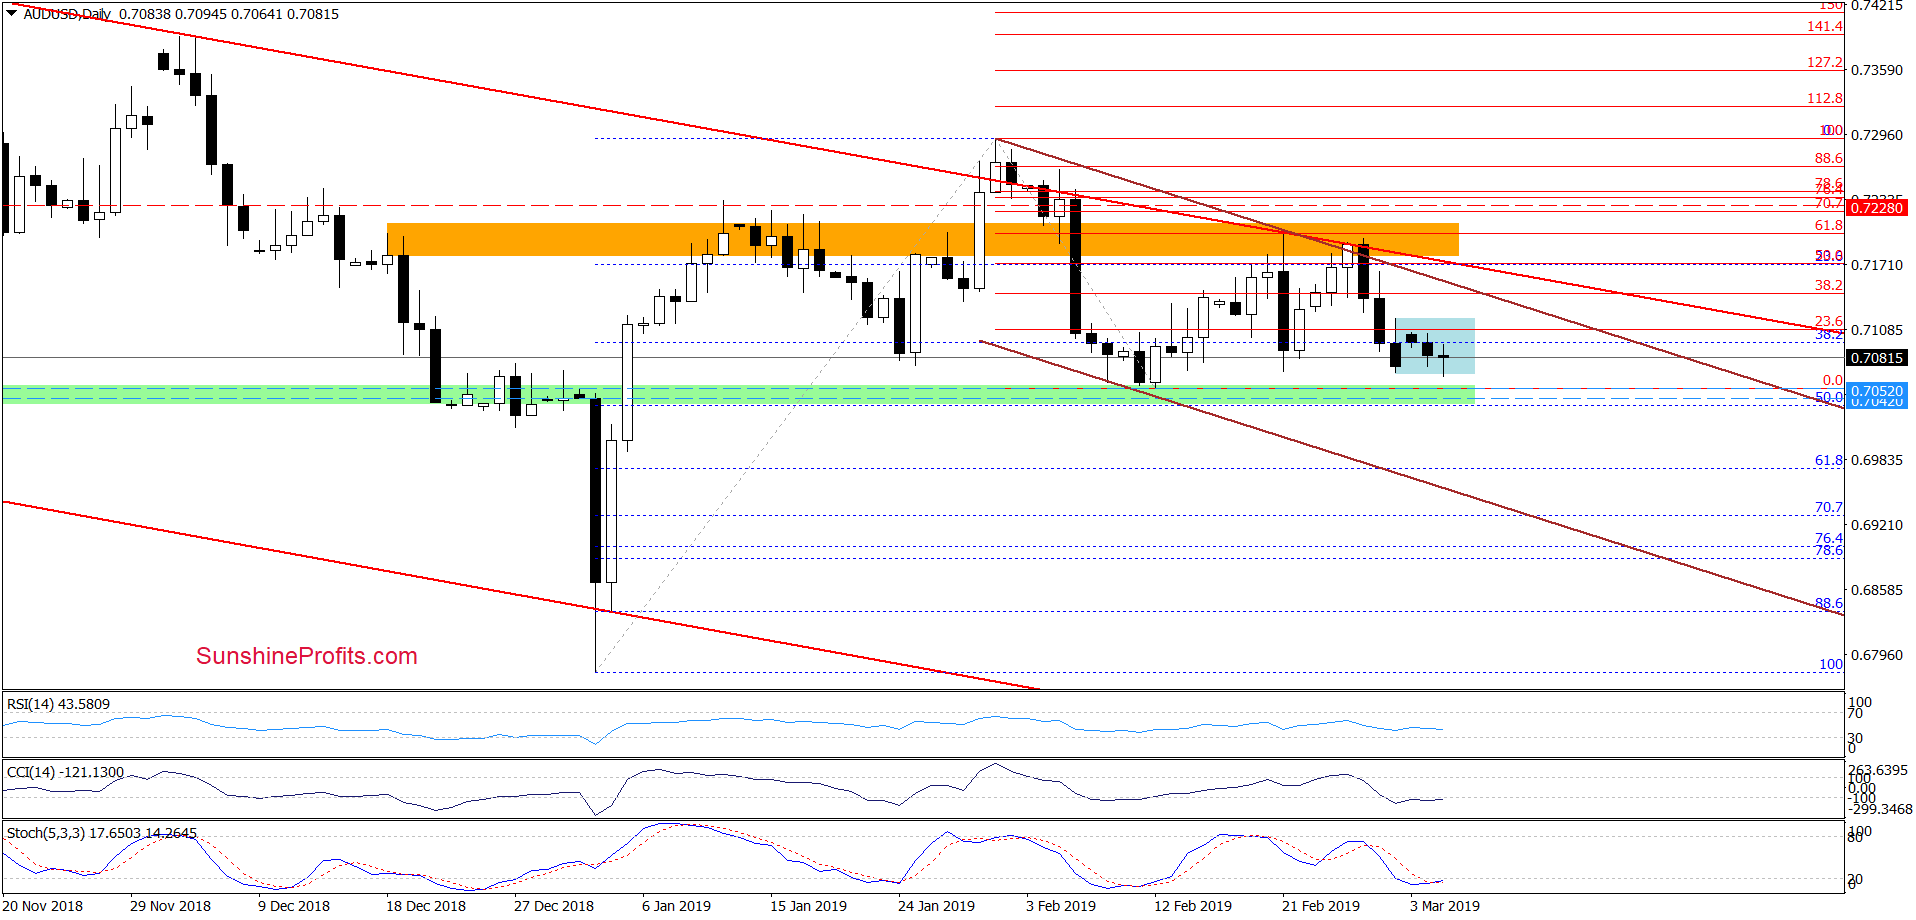
The overall situation in the very short term hasn’t changed much. AUD/USD is still trading inside the blue consolidation and slightly above last week’s lows.
Recently, the CCI and the Stochastic Oscillator slipped to their oversold areas and remained there without doing much in terms of a corresponding downside price action. This suggests that the space for declines may be limited. We already saw similar readings of these indicators in the first half of February and analogically, the upside pressure inside the pair may be building in the current circumstances, too. Therefore, we decided to move our exit target a bit higher (to 0.7053) to avoid a potential reversal without taking profits first.
Trading position (short-term; our opinion): Half of profitable short positions (with a stop-loss order at our entry level at 0.7228 and the new exit target at 0.7053) are justified from the risk/reward perspective.
Thank you.
Nadia Simmons
Forex & Oil Trading Strategist

