

Although the USD Index invalidated the earlier breakdown under the lower border of the declining trend channel and broke above the upper line of different formation, we didn’t notice a sharp upward move in the following days. This show of weakness brought dark clouds over the U.S. currency in recent days. Will rain fall from them and take the greenback to March lows?
In our opinion the following forex trading positions are justified - summary:
- EUR/USD: none
- GBP/USD: none
- USD/JPY: none
- USD/CAD: short (a stop-loss order at 1.2852; the next downside target at 1.2510)
- USD/CHF: none
- AUD/USD: none
EUR/USD
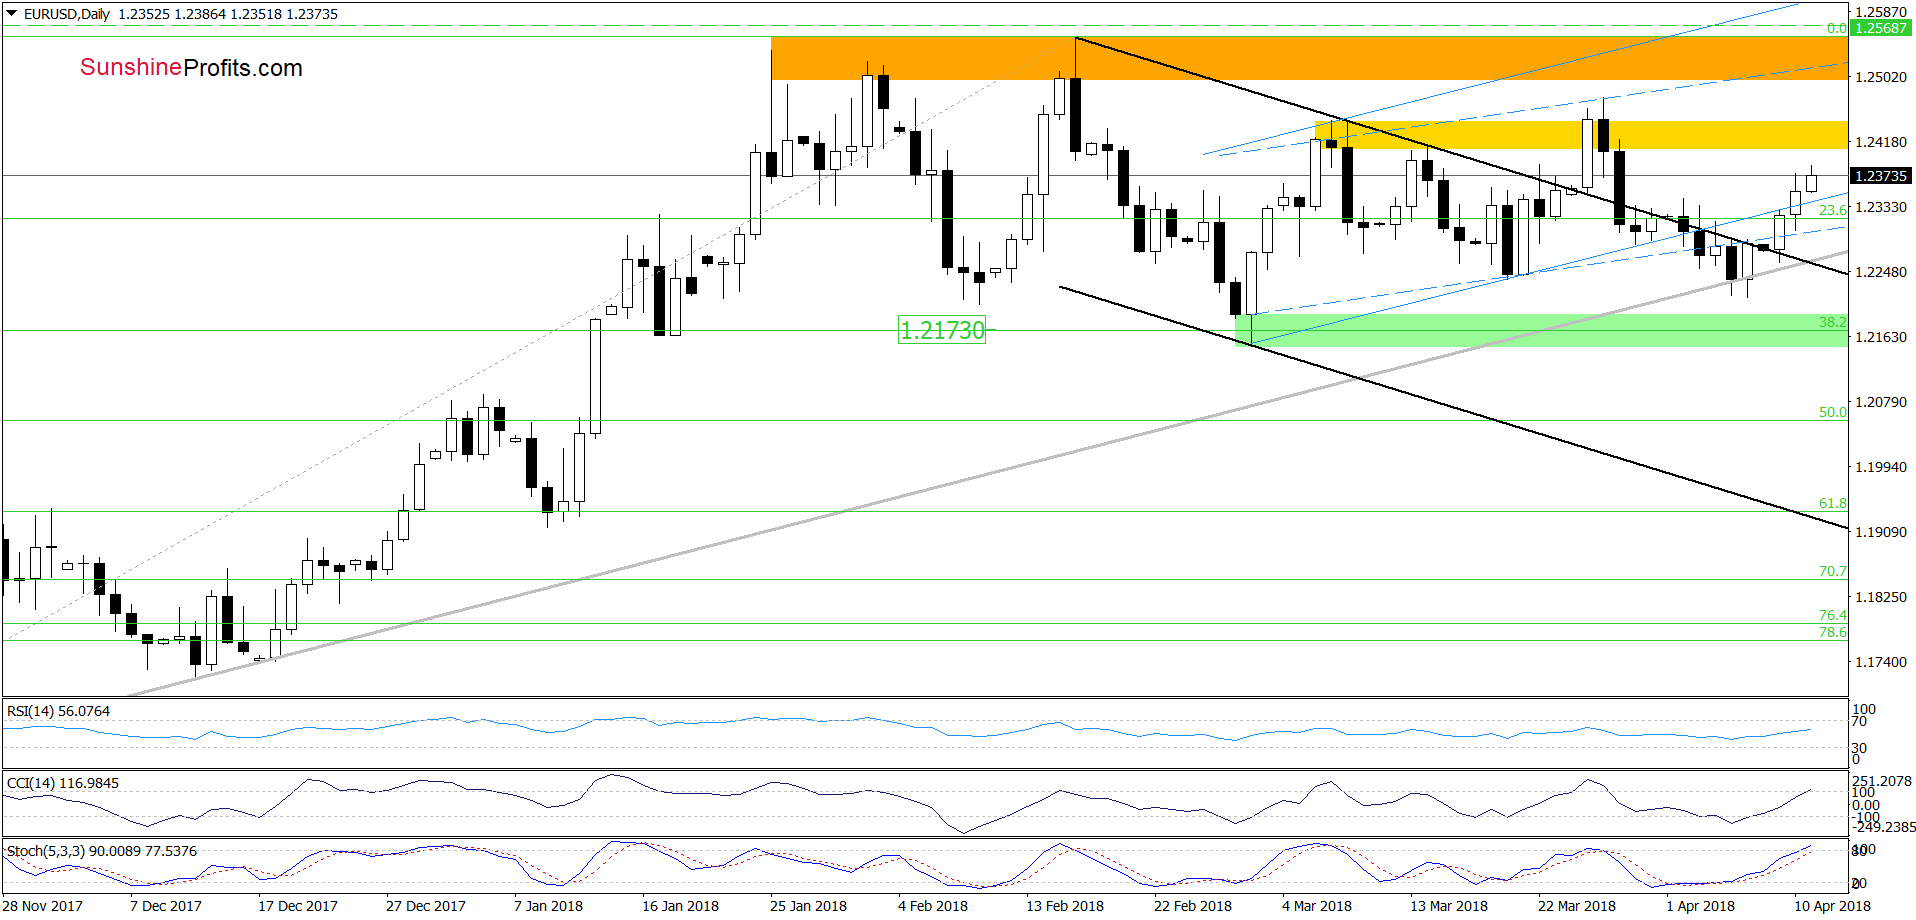
An invalidation of the breakdown under the grey medium-term support line based on the November and December 2017 lows encouraged currency bulls to act and resulted in a rebound, which took the exchange rate above the previously-broken lower line of the blue rising trend channel.
In this way, the pair invalidated the earlier breakdown, which suggests that we’ll see a test of the yellow resistance zone and the late March peak in the coming day(s).
Trading position (short-term; our opinion): No positions are justified from the risk/reward perspective. We will keep you informed should anything change, or should we see a confirmation/invalidation of the above.
USD/JPY
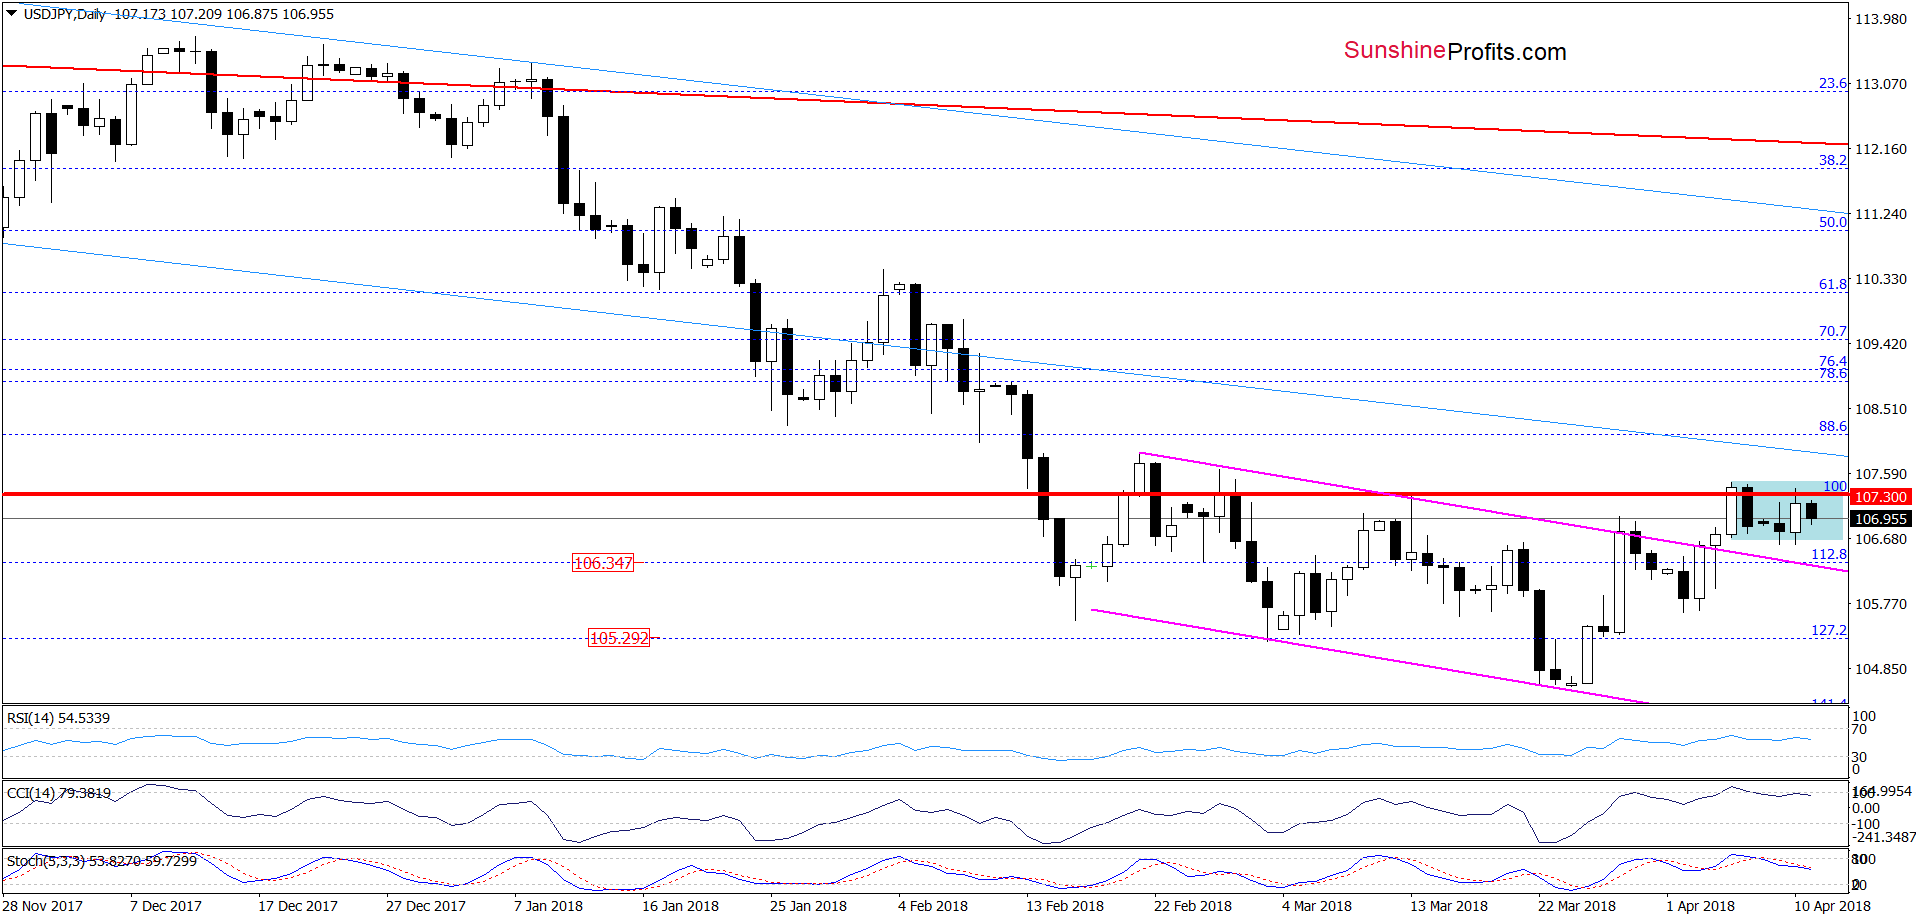
Looking at the daily chart, we see that although USD/JPY rebounded yesterday, the red horizontal line based on the September low and the proximity to the upper border of the blue consolidation sopped further improvement. As a result, the pair closed the day under the red line, which triggered another downswing earlier today.
Additionally, the sell signals generated by the CCI and the Stochastic Oscillator, suggesting that a test of yesterday’s low or even the previously-broken upper border of the purple declining trend channel should not surprise us.
Nevertheless, as long as the pair remains in the blue consolidation and there is no daily closure under the lower line of the formation, short-lived moves in both directions are very likely. Therefore, waiting at the sidelines for another opportunity remains the best decision.
Trading position (short-term; our opinion): No positions are justified from the risk/reward perspective. We will keep you informed should anything change, or should we see a confirmation/invalidation of the above.
USD/CAD
Yesterday, we wrote the following:
Where will USD/CAD head next?
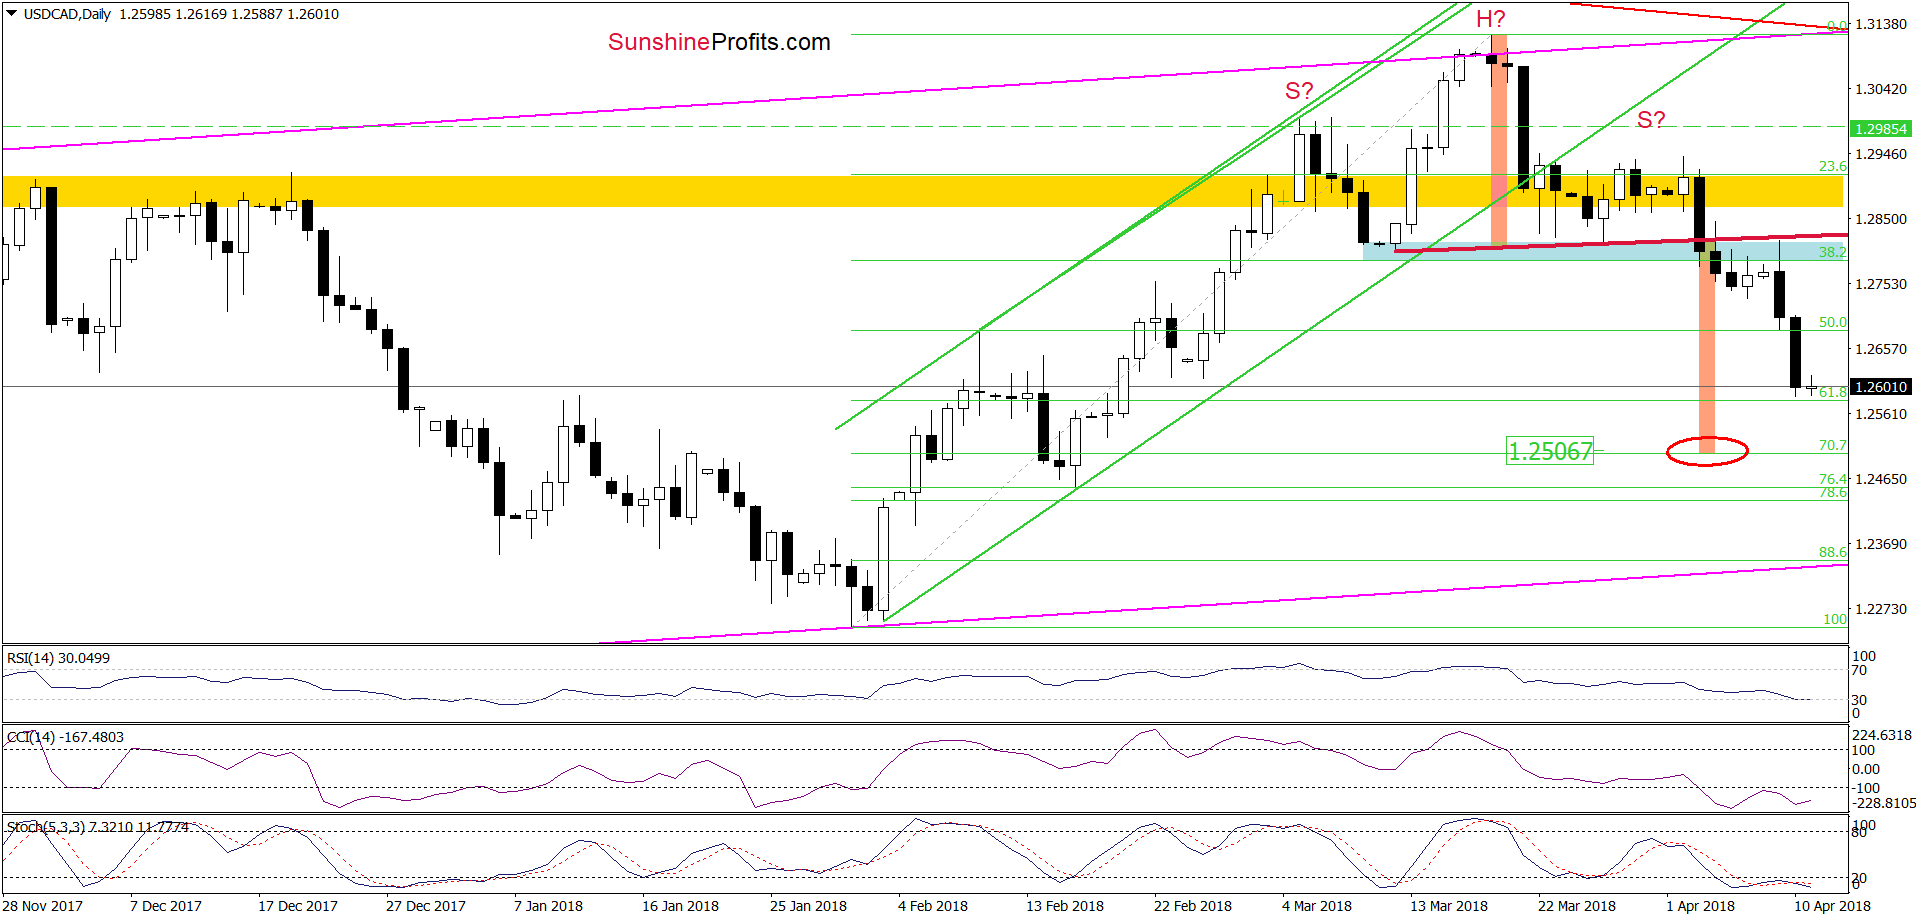
In our opinion, the next downside target will be around 1.2580, where the 61.8% Fibonacci retracement is. Taking this fact into account, we decided to lower the stop loss order once again (to 1.2852) to protect more of our earlier profits and at the same time, we move our downside target lower once again (to 1.2580) to let our profits grow.
Looking at the daily chart, we see that we didn’t have to wait long for currency bears’ attack. Yesterday’s drop below the 50% Fibonacci retracement encouraged the sellers to act, which resulted in another sharp downswing, which approached USD/CAD to our next downside target.
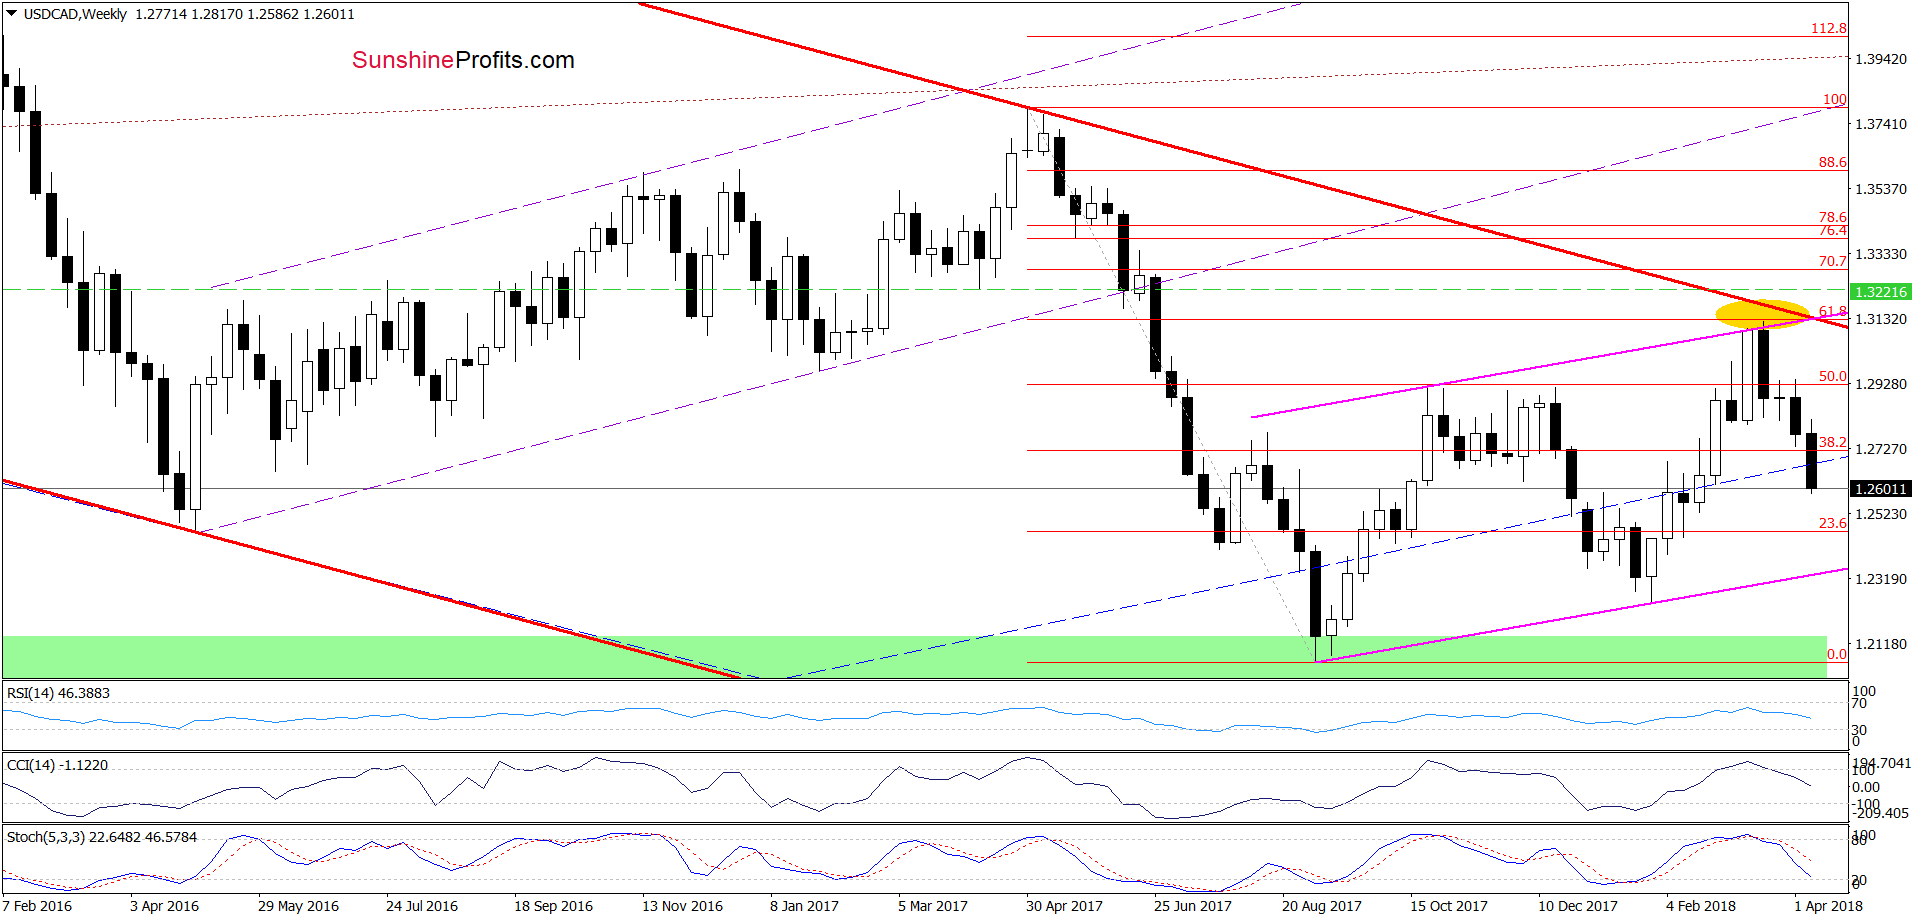
Taking into account the importance of the 61.8% Fibonacci retracement, we decided to close 80% of our short positions and take sizable profits off the table (as a reminder, we opened them on March 19, when USD/CAD was trading at around 1.3116).
Why we didn’t close the whole position? In our opinion, the space for losses has not been exhausted yet, because the size of the downward move will correspond to the height of the head and shoulders formation around 1.2506. Additionally, the sell signals generated by the weekly and daily indicators remain in the cards, supporting at least one more downswing and a drop to the above-mentioned downside target in the coming day(s).
Connecting the dots, 20% of our profitable short positions with a stop-loss order at 1.2852 and the next downside target at 1.2510 are justified from the risk/reward perspective. We will keep you informed should anything change, or should we see a confirmation/invalidation of the above.
Finishing today’s Forex Trading Alert, let’s take a look at yesterday’s price action in the USD Index. What can we infer from it?
Greenback Disappoints
Quoting our last commentary:
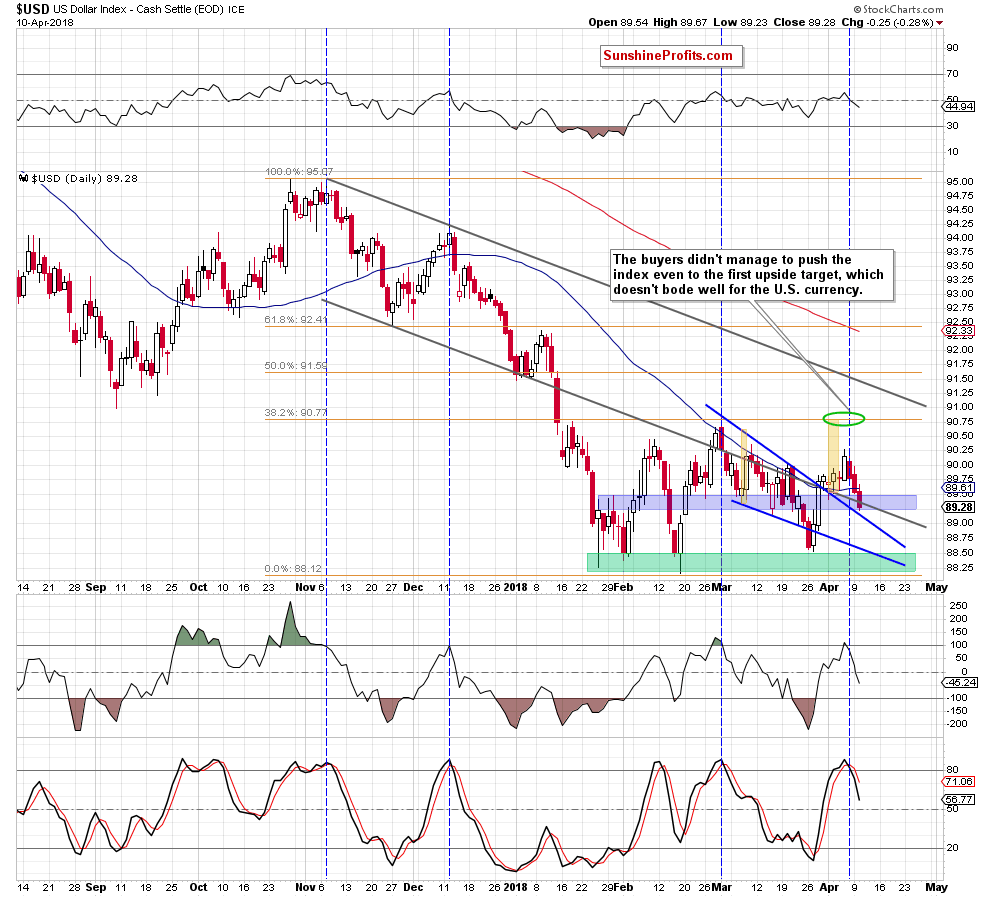
(…) the index slipped to the previously-broken blue zone and dropped under the 50-day moving average, closing yesterday’s session under this support. Additionally, the CCI and the Stochastic Oscillator generated the sell signals, suggesting further deterioration in the coming days.
Can we trust them? Looking at the chart above, we see that in all previous cases, similar situations (we marked them with the blue vertical dashed lines) preceded bigger moves to the downside, which increases the probability that the history will repeat itself once again in the very near future.
From today’s point of view, we see that the USD Index extended losses and came back below the previously-broken lower border of the grey declining trend channel, which together with the sell signals generated by the indicators doesn’t bode well for the greenback.
At the moment of writing these words, the only hope for the bulls seems to be the upper line of the blue declining wedge, which serves as the nearest support. If it holds and the U.S. currency comes back above the grey line, we’ll see a test of the last week’s peak. Nevertheless, if the buyers do not manage to hold this line, the way to the lower border of the formation (currently around 88.60) will be open.
Thank you.
Nadia Simmons
Forex & Oil Trading Strategist
Przemyslaw Radomski, CFA
Founder, Editor-in-chief, Gold & Silver Fund Manager
Gold & Silver Trading Alerts
Forex Trading Alerts
Oil Investment Updates
Oil Trading Alerts

