

In the previous week, the U.S. dollar moved sharply higher against its Canadian counterpart, which resulted not only in a fresh May high, but also in a new 2018 peak. But is the road to higher levels really open?
In our opinion the following forex trading positions are justified - summary:
- EUR/USD: none
- GBP/USD: none
- USD/JPY: none
- USD/CAD: short (a stop-loss order at 1.3221; the initial downside target at 1.2918)
- USD/CHF: none
- AUD/USD: none
EUR/USD
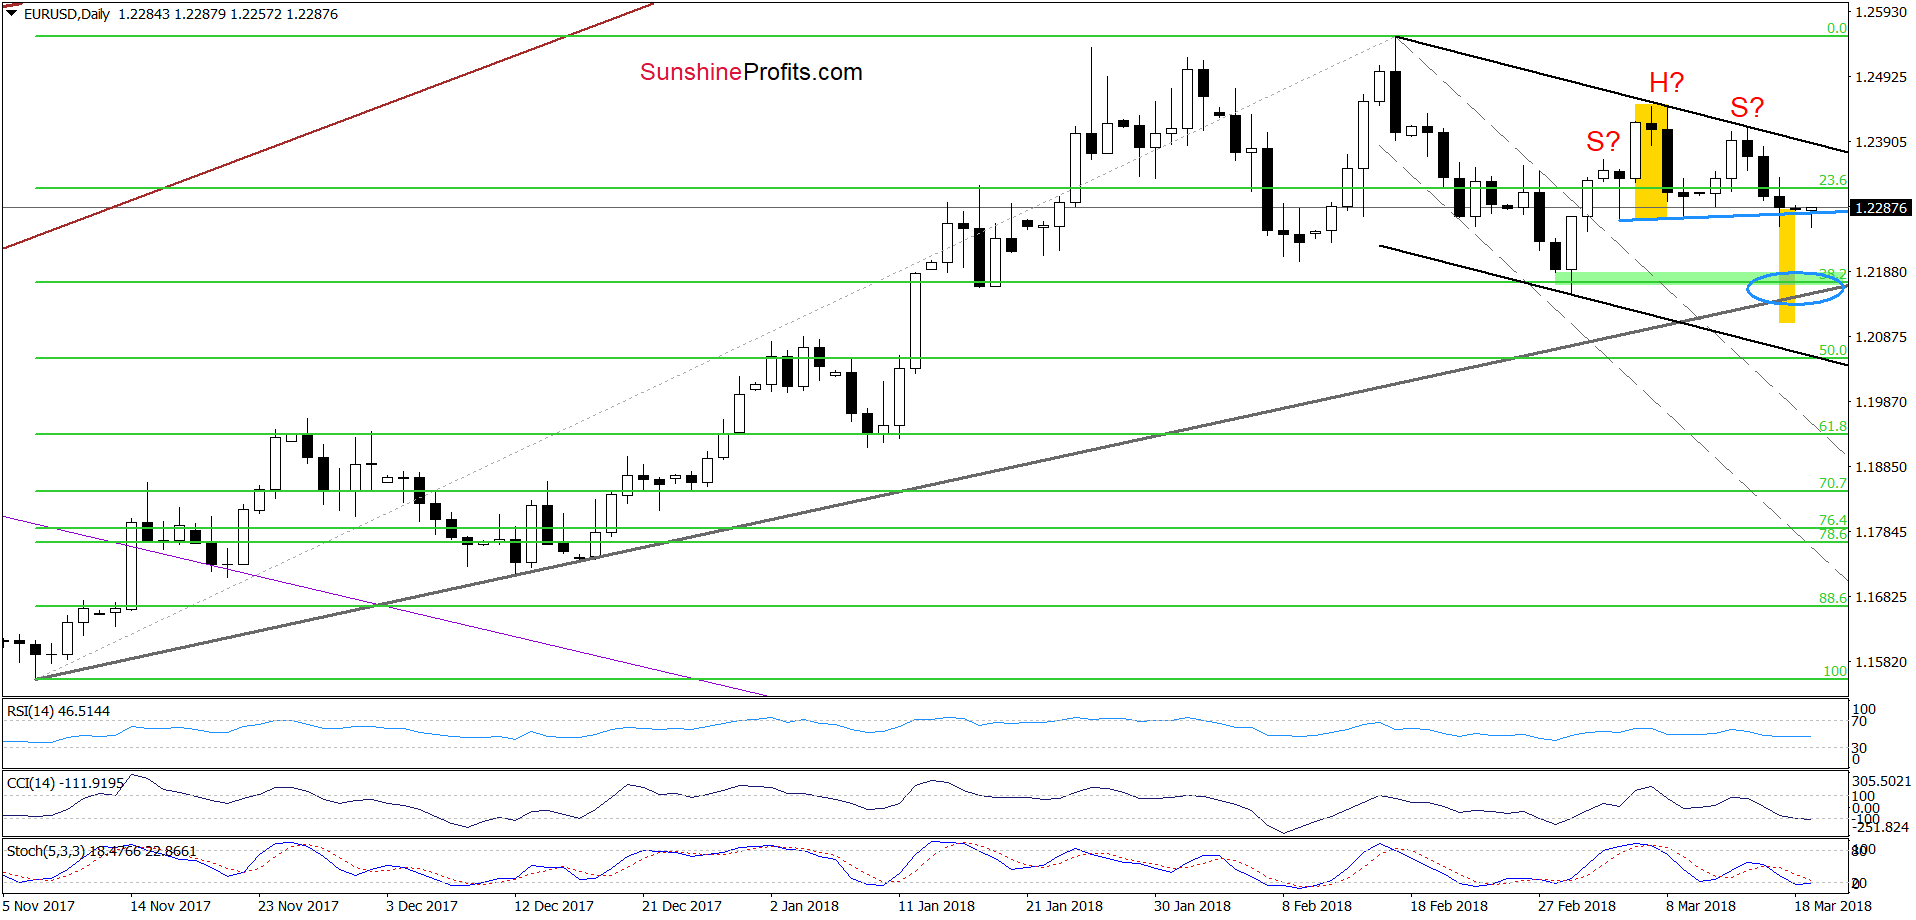
Although EUR/USD slipped slightly below the blue support line based on the previous lows (the neck line of the potential head and shoulders formation), there was no daily closure under this line, which means that there are no enough bearish implications of that move to justify the opening of short positions.
Earlier today, we saw another attempt to move lower, but currency bulls intervened once again, triggering a tiny rebound and another comeback above the blue line. Therefore, as long as there is no daily closure under this line one more upswing and a re-test of the black declining line can’t be ruled out – especially when we factor in the medium-term picture.
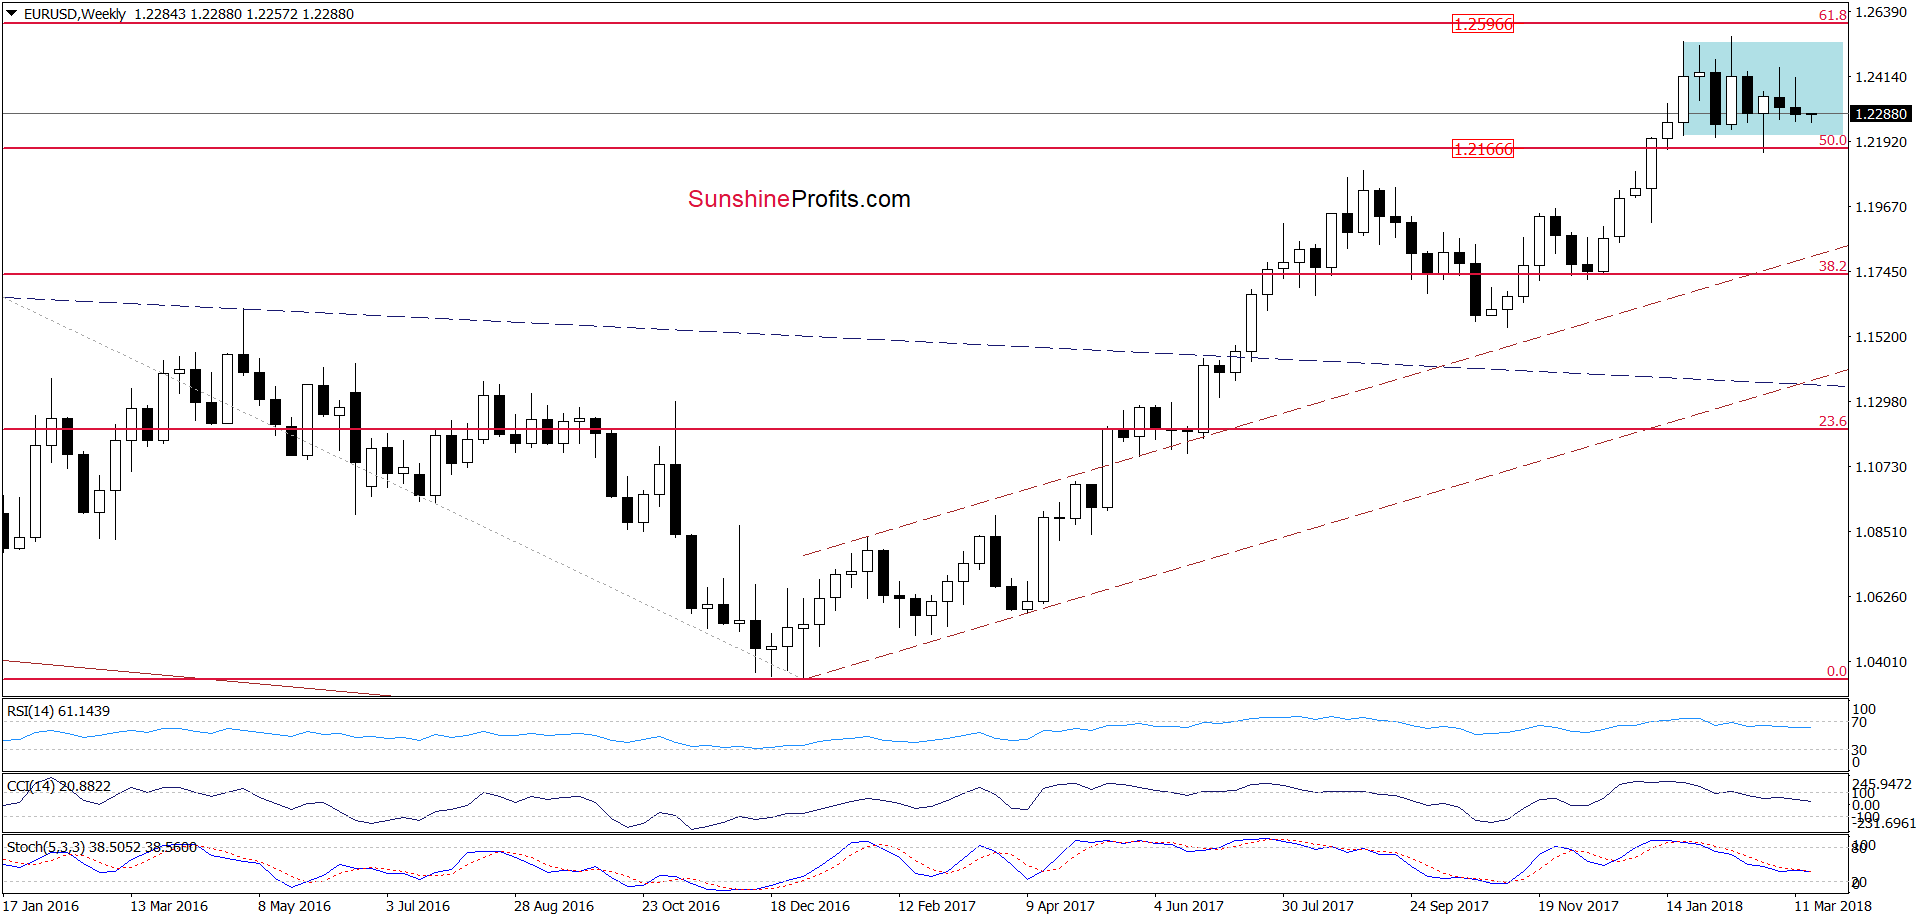
Looking at the broader perspective, we see that the overall situation remains almost unchanged as EUR/USD is still trading inside the blue consolidation. Therefore, the comments that we made on Thursday remain up-o-date also today.
Trading position (short-term; our opinion): no positions are justified from the risk/reward perspective now. We will keep you informed should anything change, or should we see a confirmation/invalidation of the above.
USD/CAD
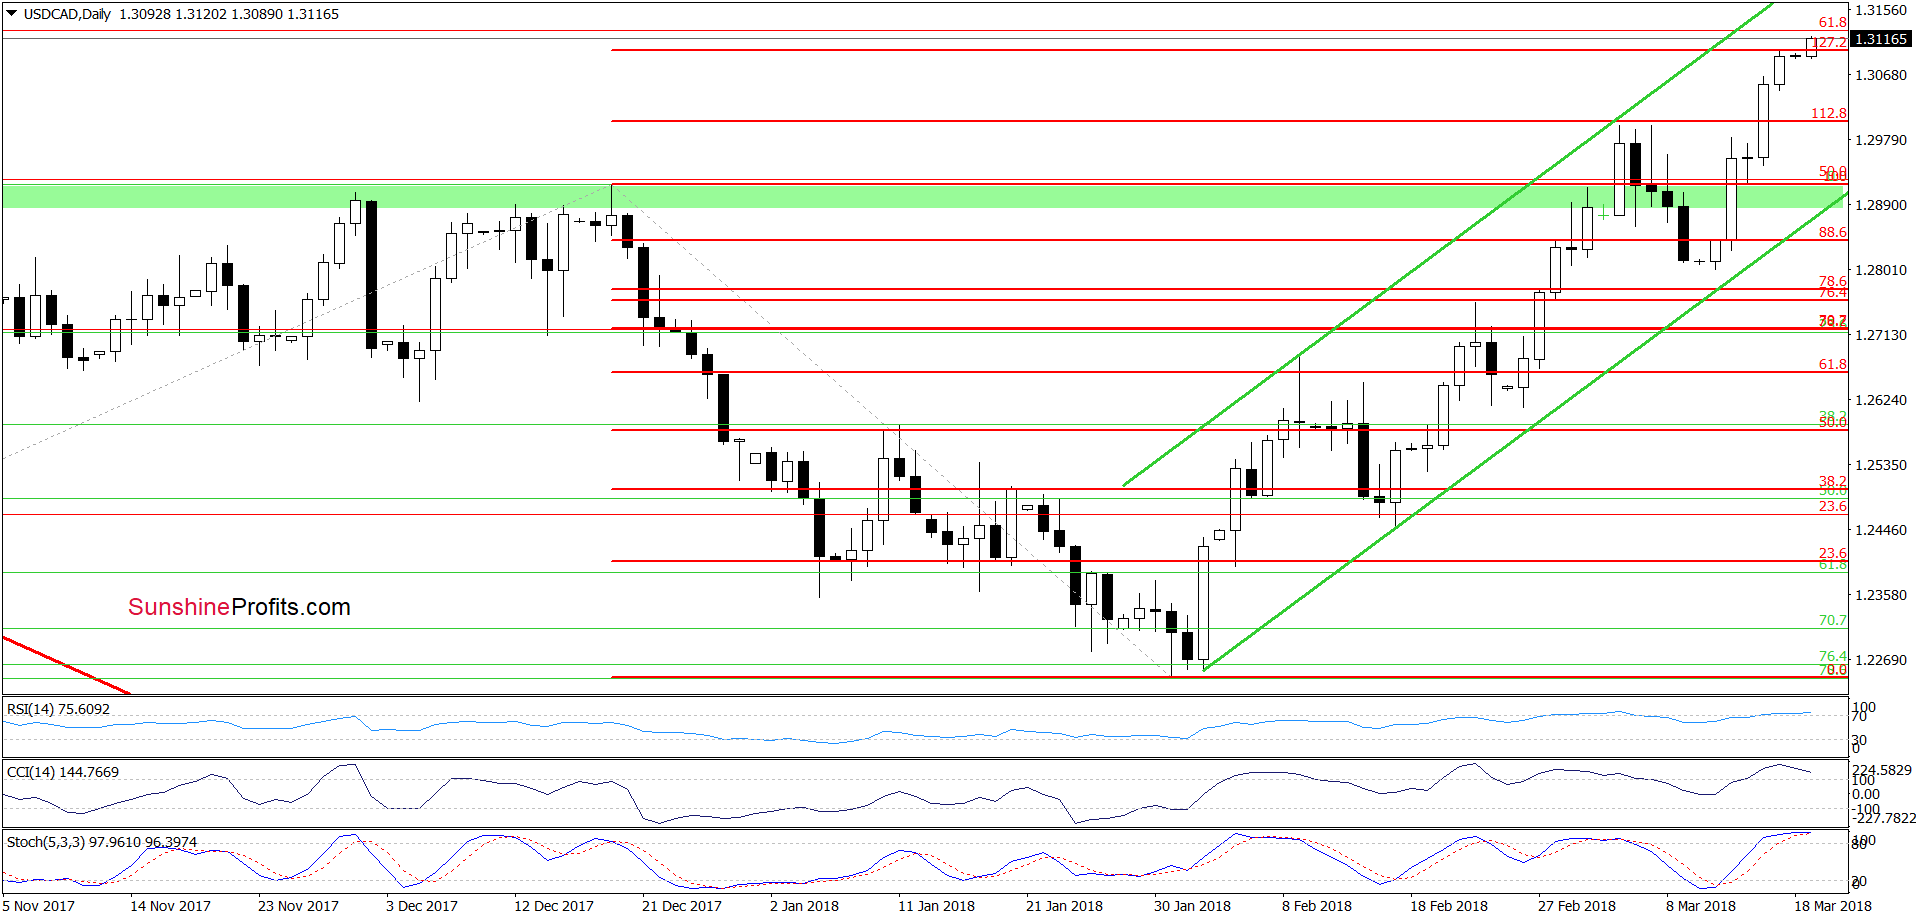
On the daily chart, we see that USD/CAD extended gains in the previous week, which resulted in a climb to the 127.2% Fibonacci extension. Thanks to this move the pair also approached the 61.8% Fibonacci (seen more clearly on the weekly chart below), which together with the current position of the daily indicators suggest that reversal is just around the corner.
Are there any other technical factors that could encourage currency bears to act? Let’s examine the medium-term chart.
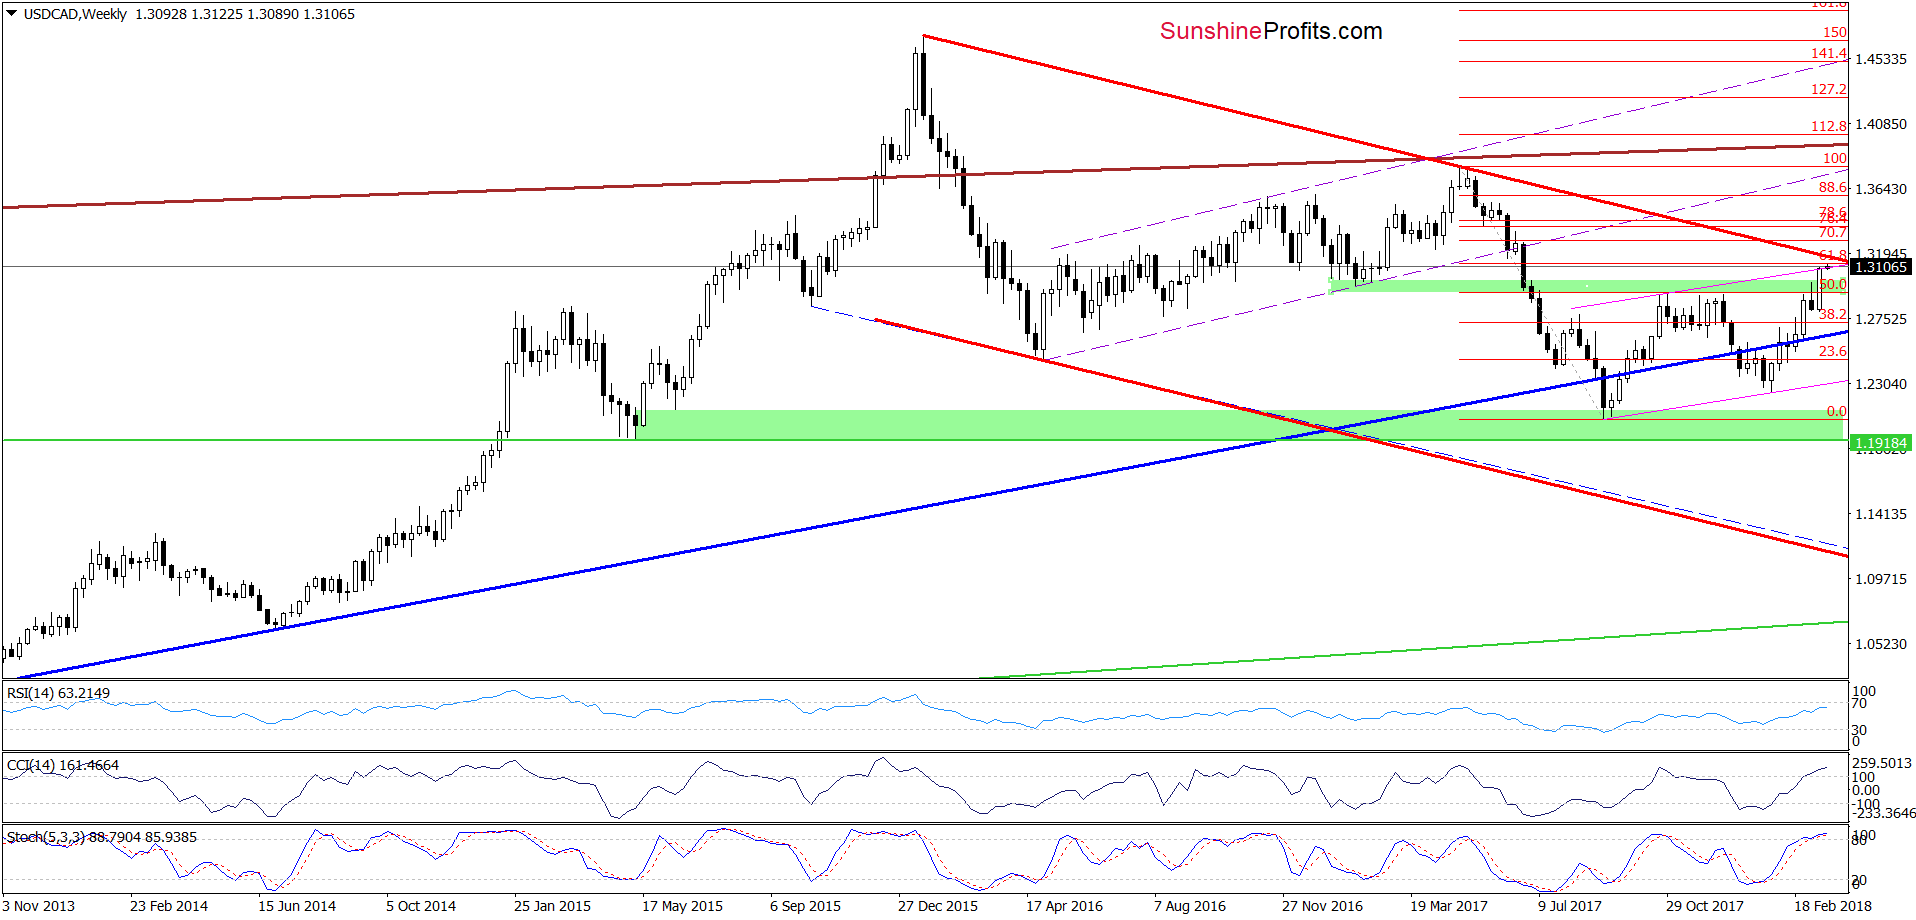
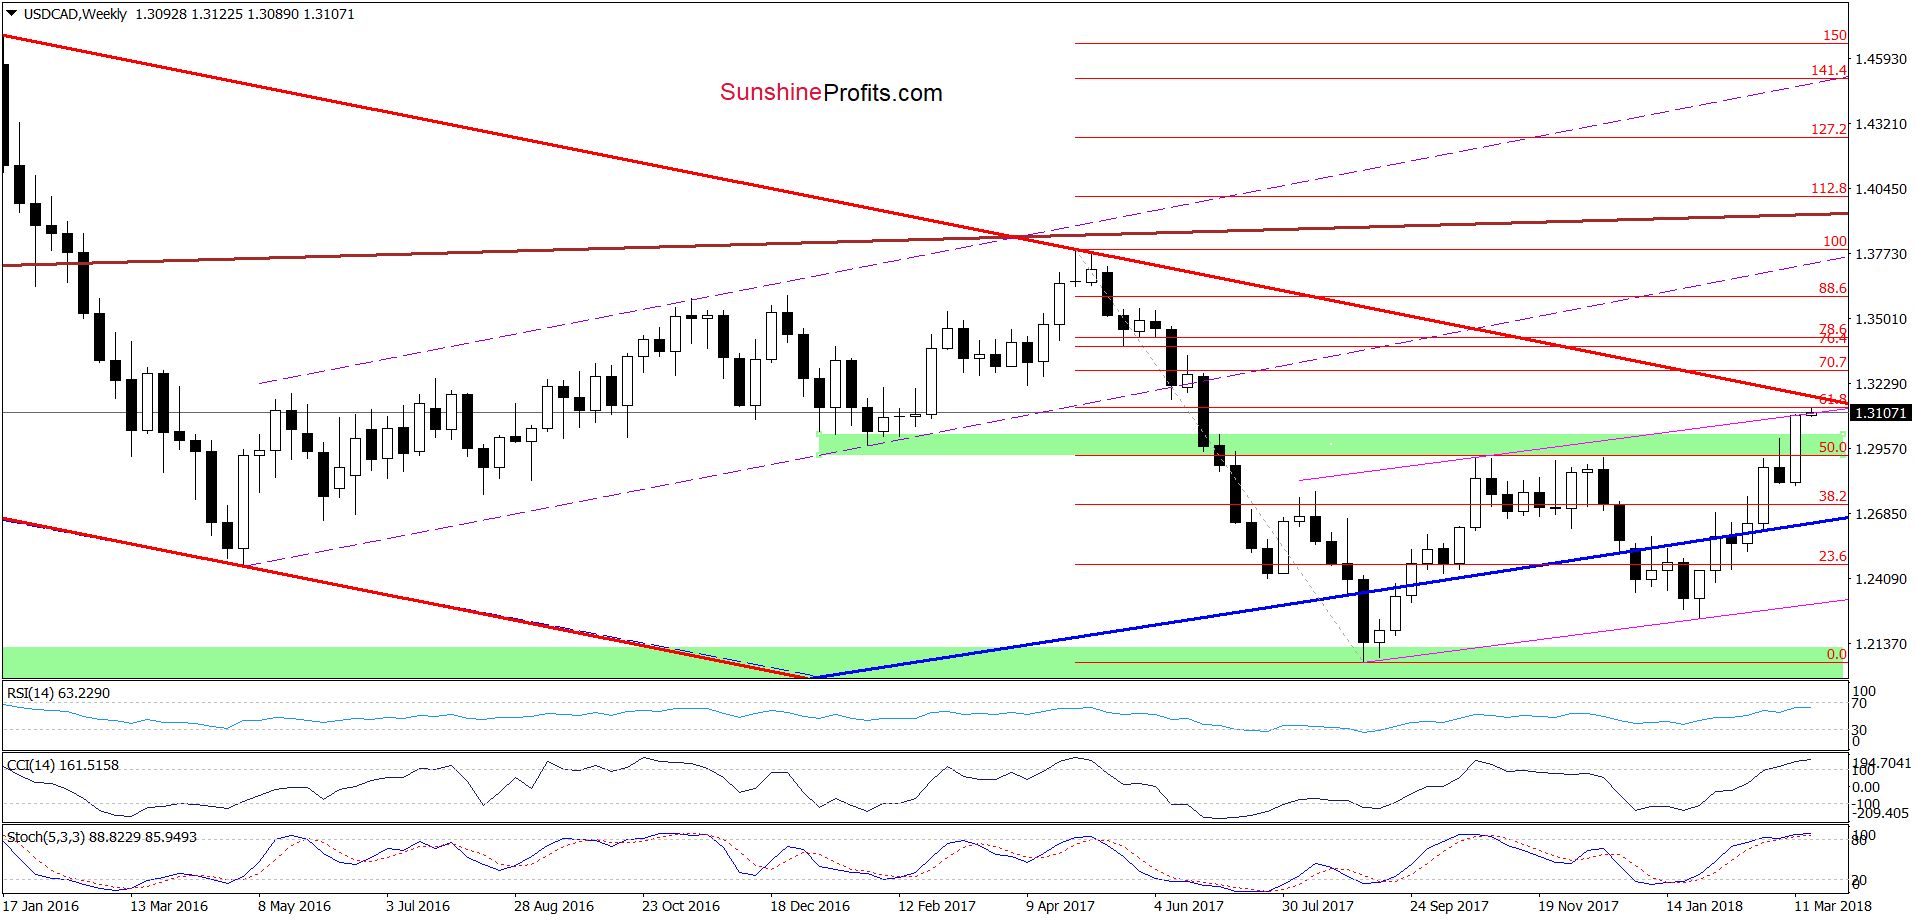
From this perspective, we see that USD/CAD not only reached the above-mentioned resistances, but also the upper border of the long-term red declining trend channel and the upper line of the pink rising trend channel, which in combination with the current position of the weekly indicators significantly increase the probability of reversal in the very near future.
Taking all the above into account, we think that the above-mentioned resistance area is strong enough to stop currency bulls and trigger a downward move in the coming week. Therefore, opening short positions is justified from the risk/reward perspective at the moment of writing these words.
How low could USD/CAD go?
In our opinion, the initial downside target will be the lower border of the green rising trend channel marked on the daily chart (currently around 1.2875). However, if this support is broken, we’ll likely see a test of the March lows (around 1.2800-1.2813) in the following days.
Trading position (short-term; our opinion): Short positions (with a stop-loss order at 1.3221 and the initial downside target at 1.2918 are justified from the risk/reward perspective now. We will keep you informed should anything change, or should we see a confirmation/invalidation of the above.
USD/CHF
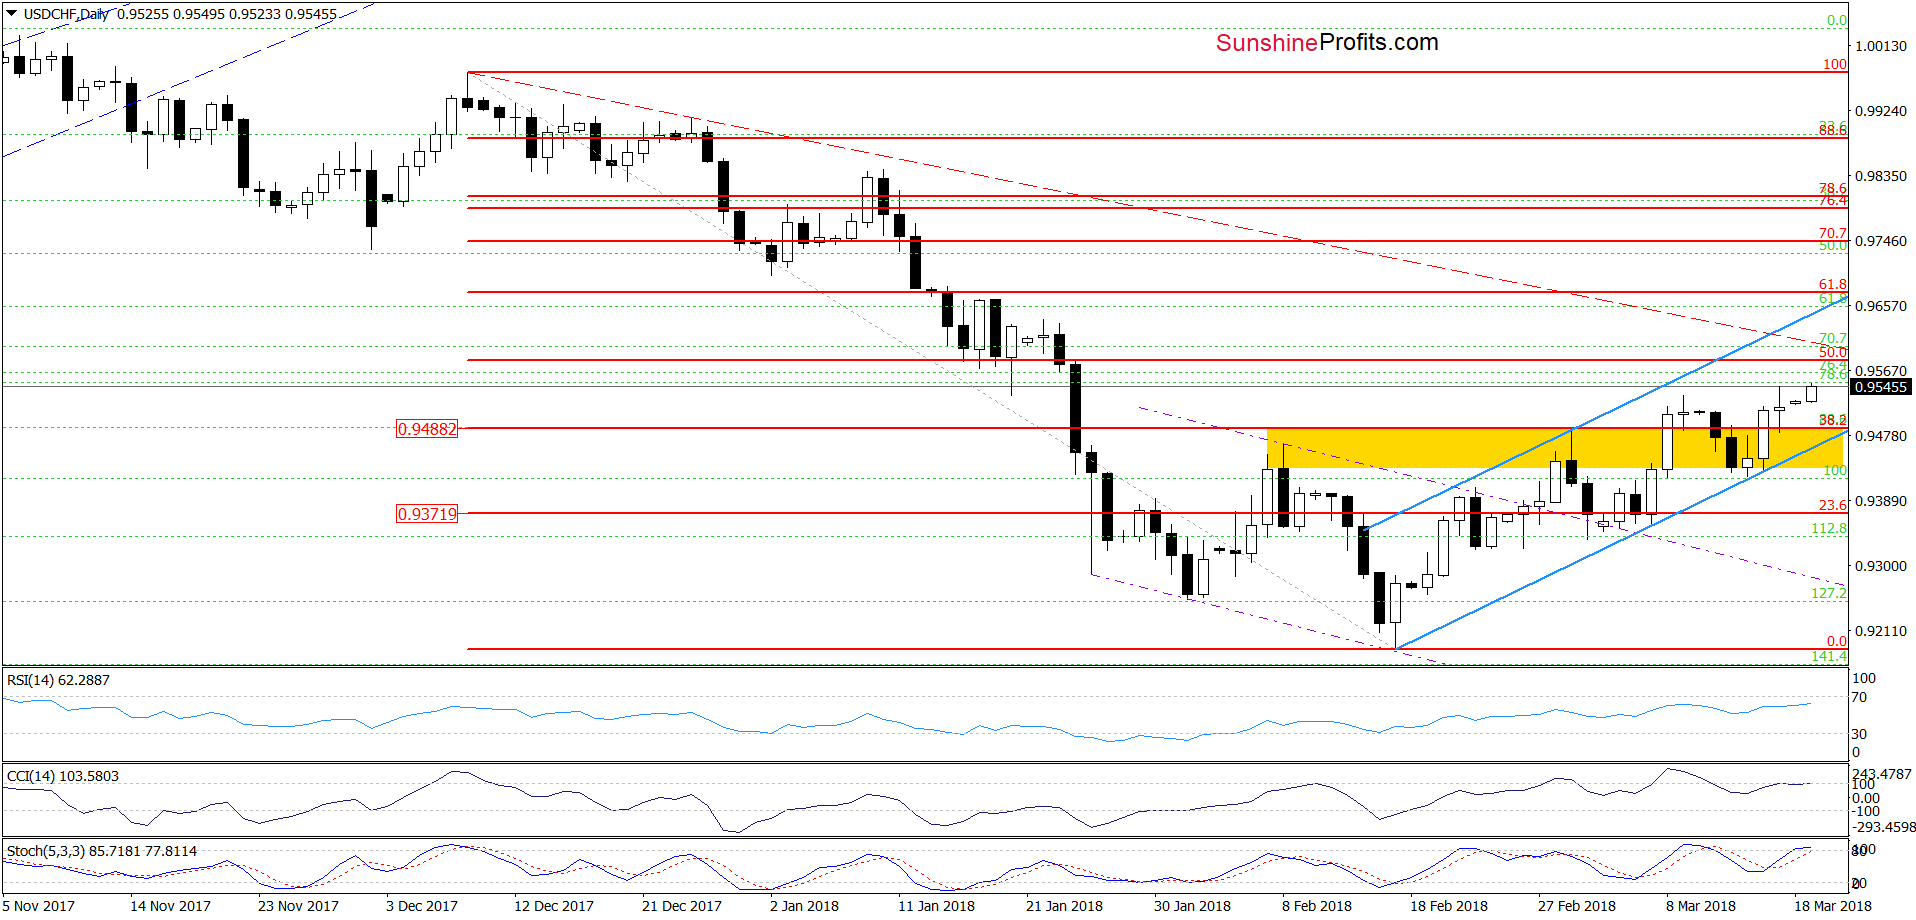
On Thursday, USD/CHF bounced off the lower border of the blue rising trend channel, which resulted in a fresh March peak. Will we see further improvement in the coming days? Looking at the daily chart, we see that although indicators increased to their overbought areas there are no sell signals at the moment of writing these words, which could encourage currency bears to act.
Nevertheless, in our opinion, even if the exchange rate moves higher from here, the space for gains seems limited as the 50% Fibonacci retracement and the medium-term red declining dashed resistance line are quite close.
And speaking about the resistance lines… let’s zoom out our picture and examine the weekly chart below. What can we infer from it?
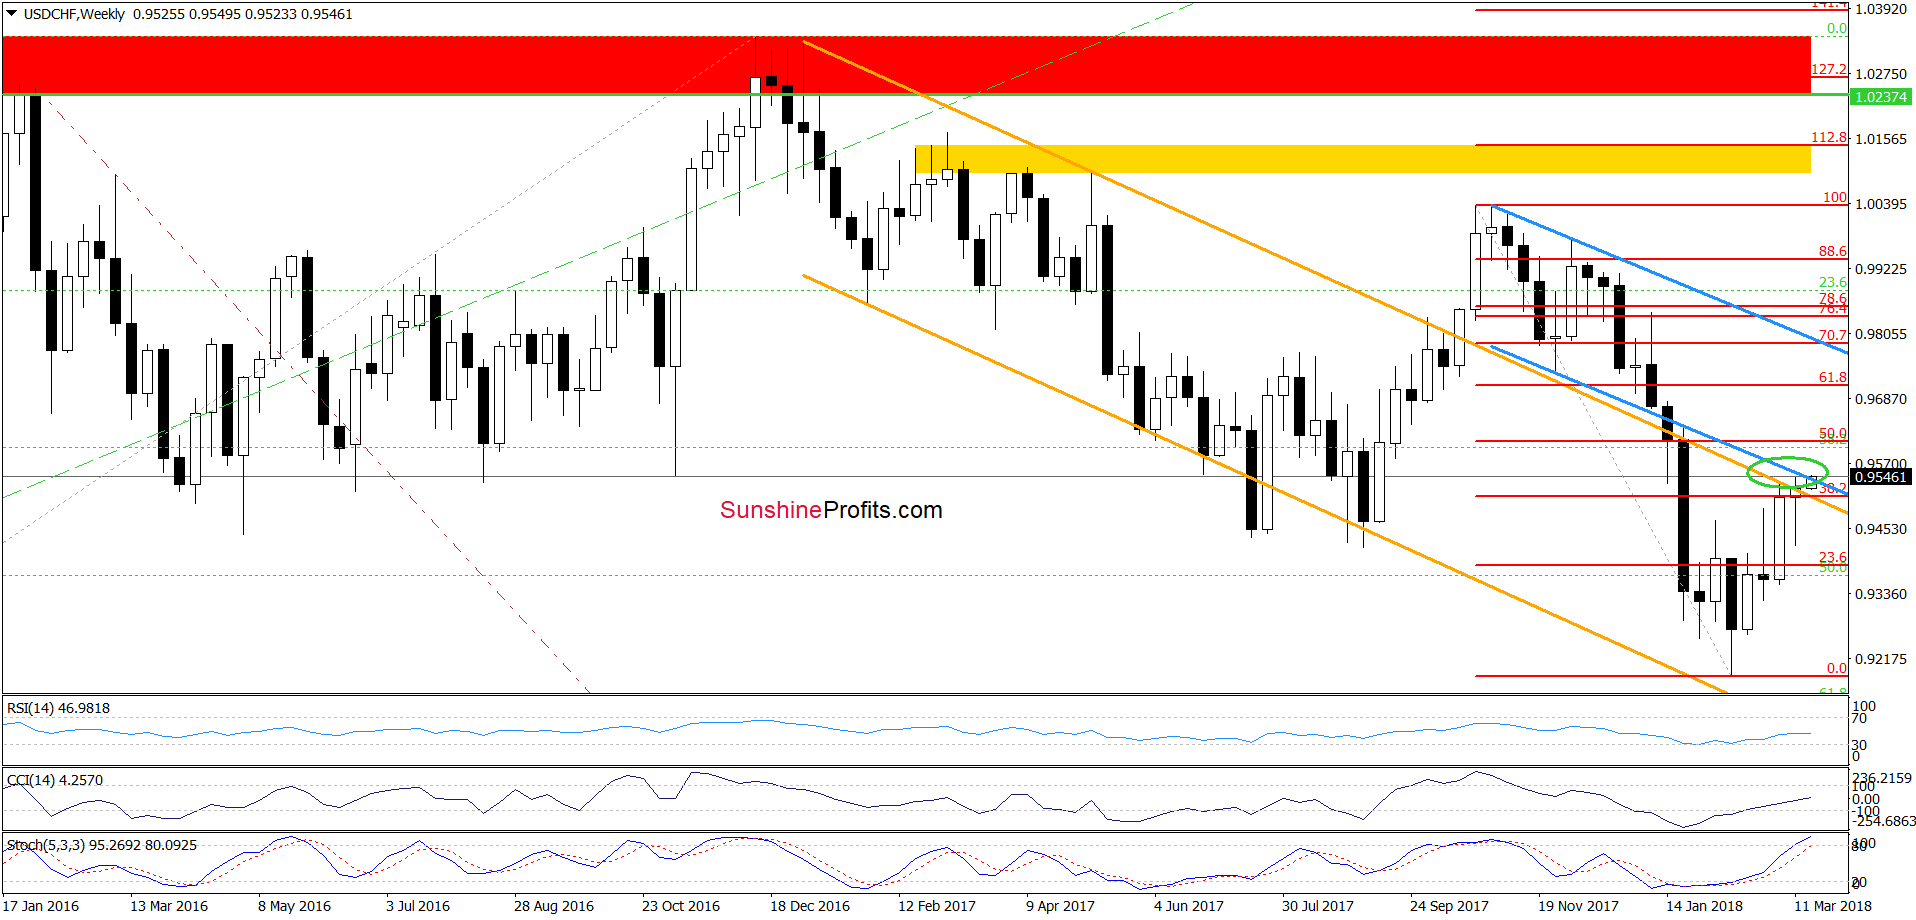
From this perspective, we see that USD/CHF climbed above the 38.2% Fibonacci retracement and the upper line of the orange declining trend channel in the previous week, which is a bullish development.
Nevertheless, we think that as long as there is no invalidation of the earlier breakdown under the previously-broken lower line of the blue declining trend channel the way to the north is not open yet. In other words, if we see a climb above the blue resistance line, we’ll consider opening long positions - especially if there are no obstacles on the daily chart.
Trading position (short-term; our opinion): No positions are justified from the risk/reward perspective. We will keep you informed should anything change, or should we see a confirmation/invalidation of the above.
Thank you.
Nadia Simmons
Forex & Oil Trading Strategist
Przemyslaw Radomski, CFA
Founder, Editor-in-chief, Gold & Silver Fund Manager
Gold & Silver Trading Alerts
Forex Trading Alerts
Oil Investment Updates
Oil Trading Alerts

