

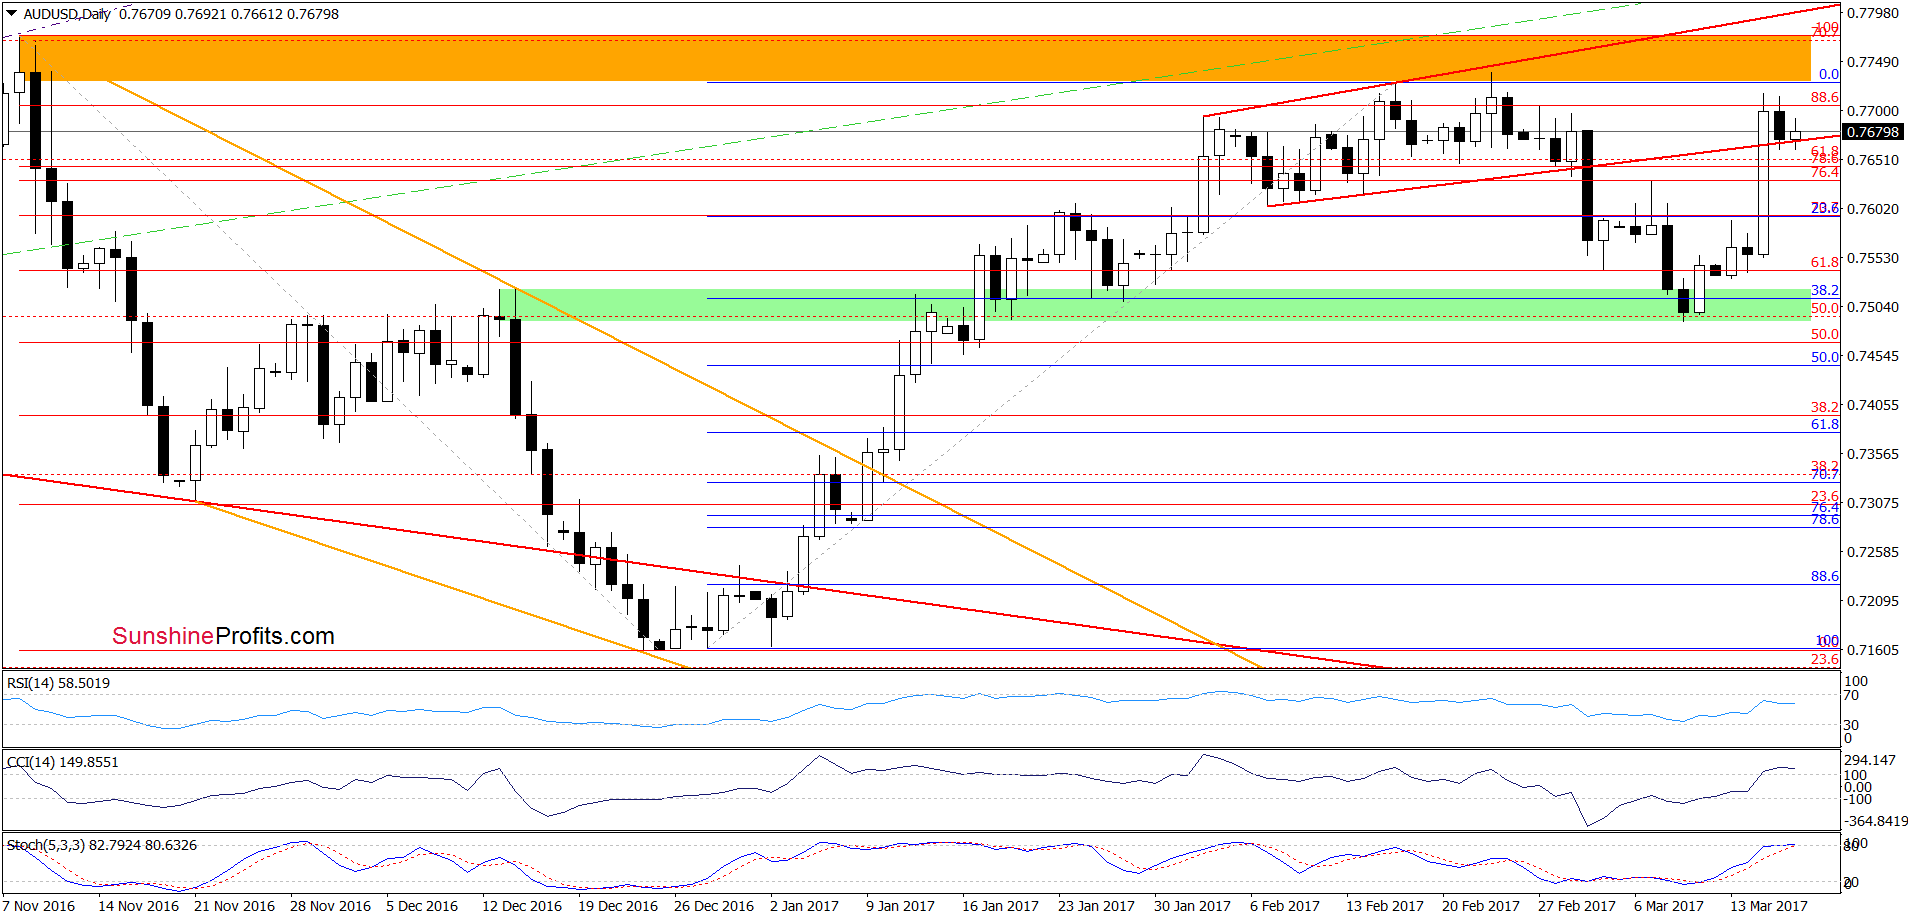
On Wednesday, the Australian dollar moved sharply higher against its U.S. counterpart after the Federal Reserve’s latest policy decision. Thanks to this increase, AUD/USD invalidated the earlier breakdown under the lower border of the rising trend channel. Does this improvement mean that we’ll see a test of recent highs?
In our opinion the following forex trading positions are justified - summary:
- EUR/USD: short (a stop-loss order at 1.0810; the initial downside target at 1.0388)
- GBP/USD: none
- USD/JPY: none
- USD/CAD: none
- USD/CHF: long (a stop-loss order at 0.9891; the initial upside target at 1.0180)
- AUD/USD: none
EUR/USD
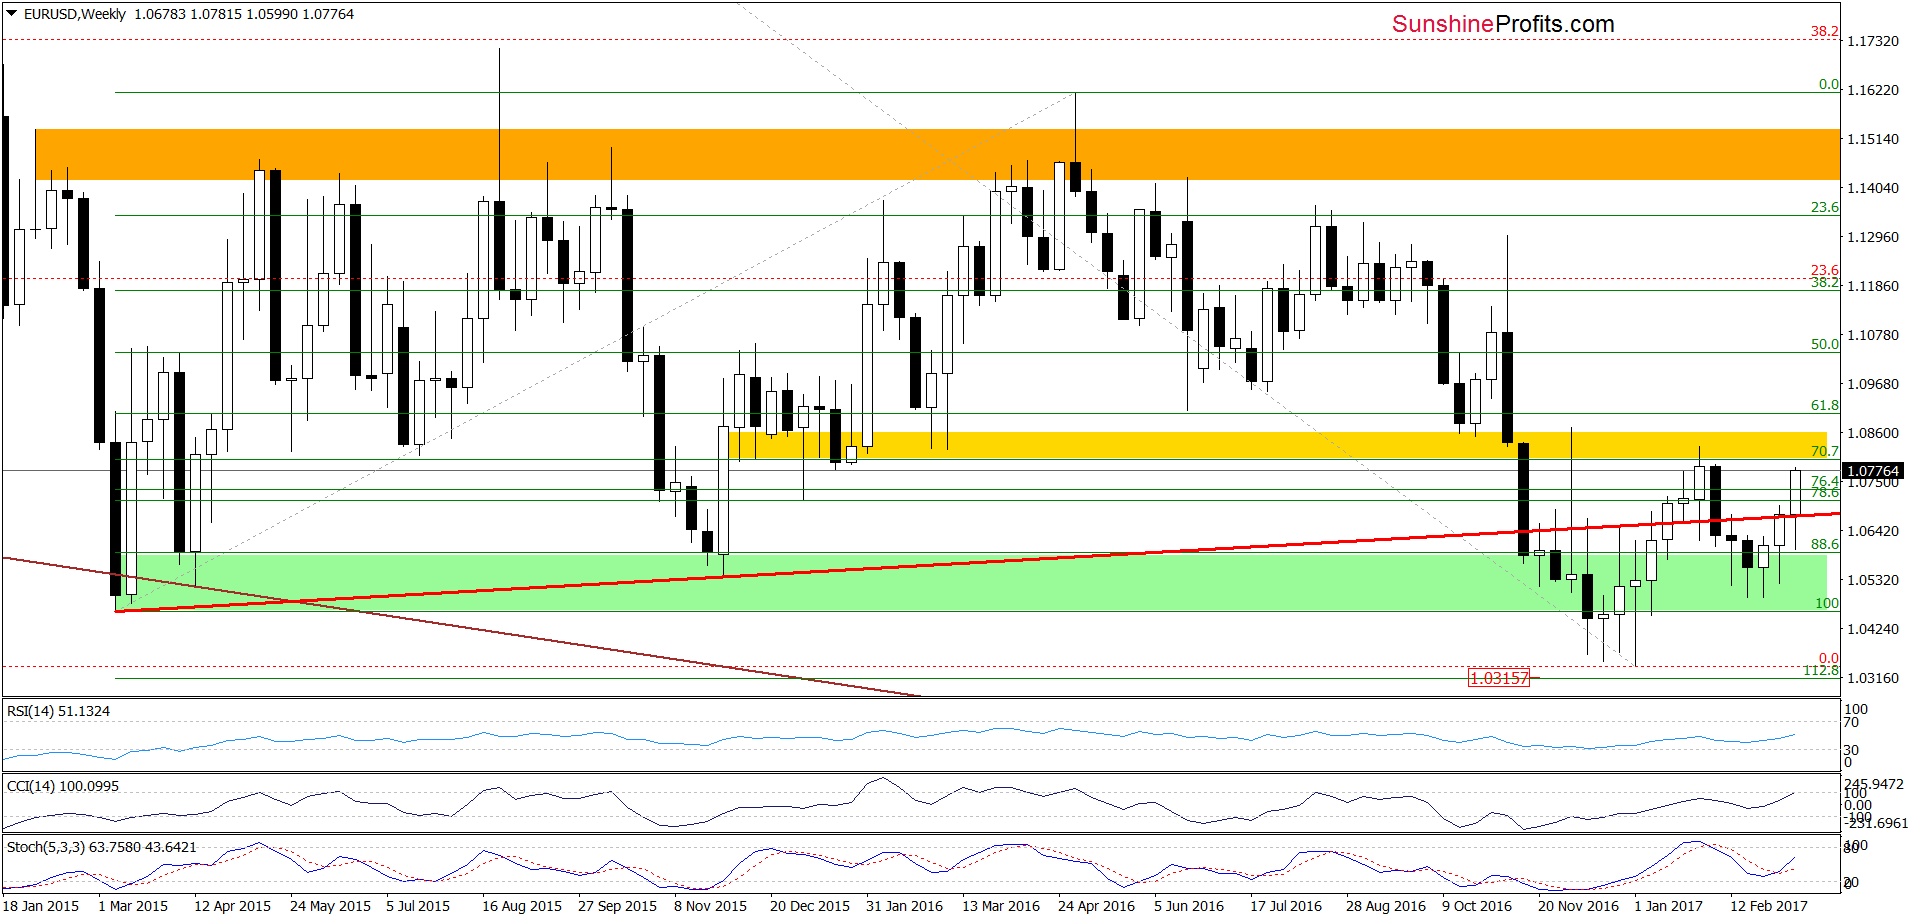
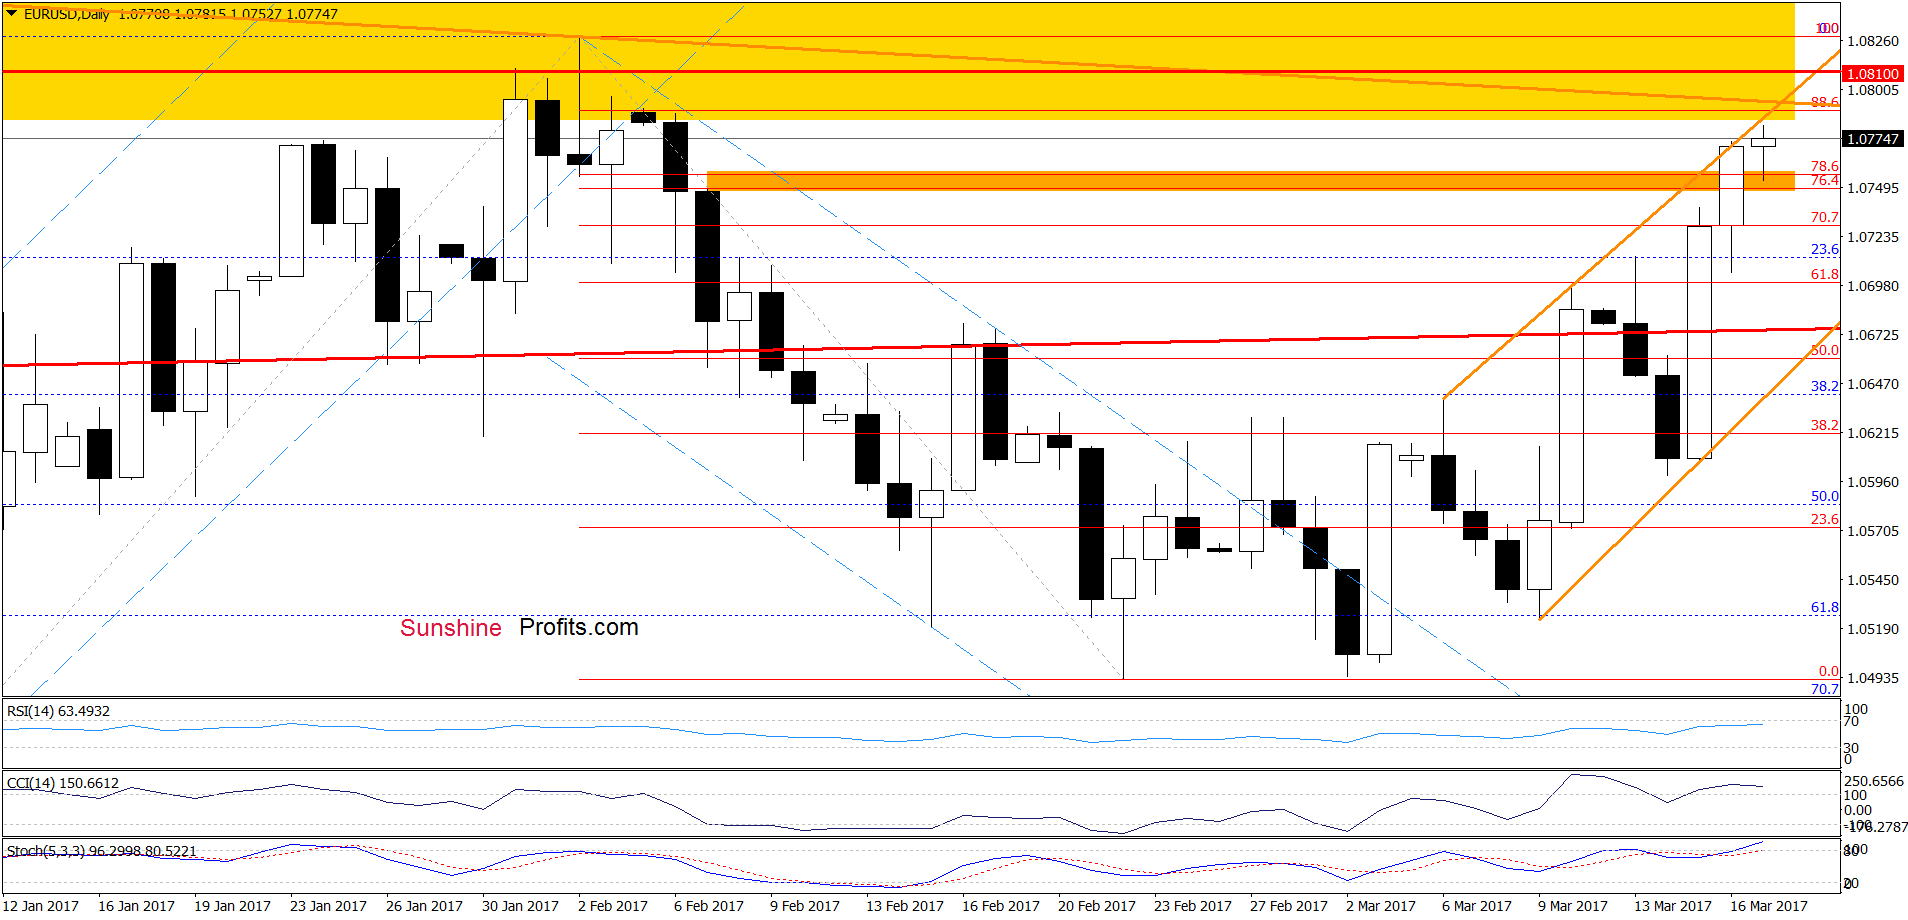
Yesterday, EUR/USD extended gains and broke above the orange resistance zone, which resulted in a climb to the upper border of the orange rising trend channel. This resistance triggered a pullback, which took the pair to the orange zone. As you see this area encouraged currency bulls to act once again, but in our opinion, the space for gains is limited as the upper border of the orange rising trend channel and the orange resistance line based on the previous highs are not far from current levels. Additionally, the CCI and the Stochastic Oscillator climbed to their overbought areas, which increases the probability of reversal – especially when we factor in the proximity to the yellow resistance zone marked on the weekly chart.
Very short-term outlook: bearish
Short-term outlook: mixed with bearish bias
MT outlook: mixed
LT outlook: mixed
Trading position (short-term; our opinion): Short positions with a stop-loss order at 1.0810 and the initial downside target at 1.0388 are justified from the risk/reward perspective. We will keep you informed should anything change, or should we see a confirmation/invalidation of the above.
USD/CAD
On Wednesday, we wrote:
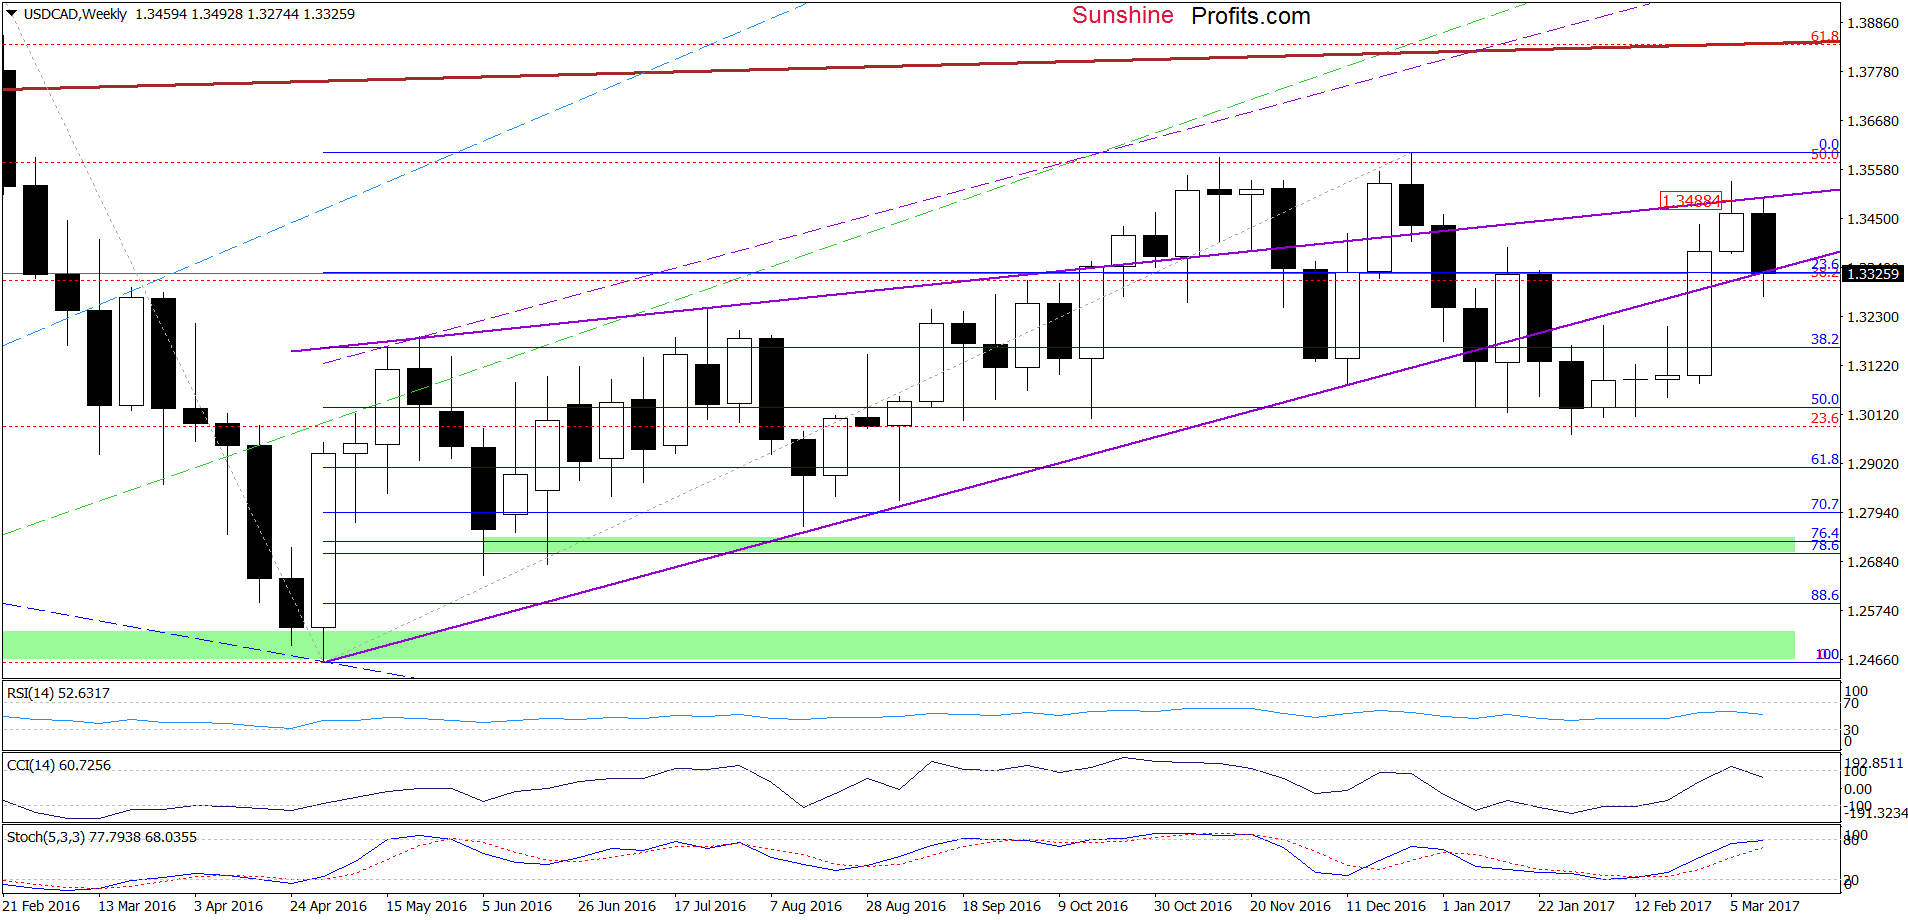
The first thing that catches the eye on the weekly chart is an invalidation of the breakout above the upper border of the purple rising wedge. Earlier this week the pair verified the breakdown, which is a bearish development and suggests further deterioration.
On the weekly chart, we see that the situation developed in line with the above scenario and USD/CAD declined slightly below the lower border of the purple rising wedge. Despite this deterioration, currency bulls pushed the pair higher invalidating the earlier breakdown.
Will they manage to hold this level? Let’s examine the daily chart and find what we can infer from it about future moves.
Quoting our last commentary on this currency pair:
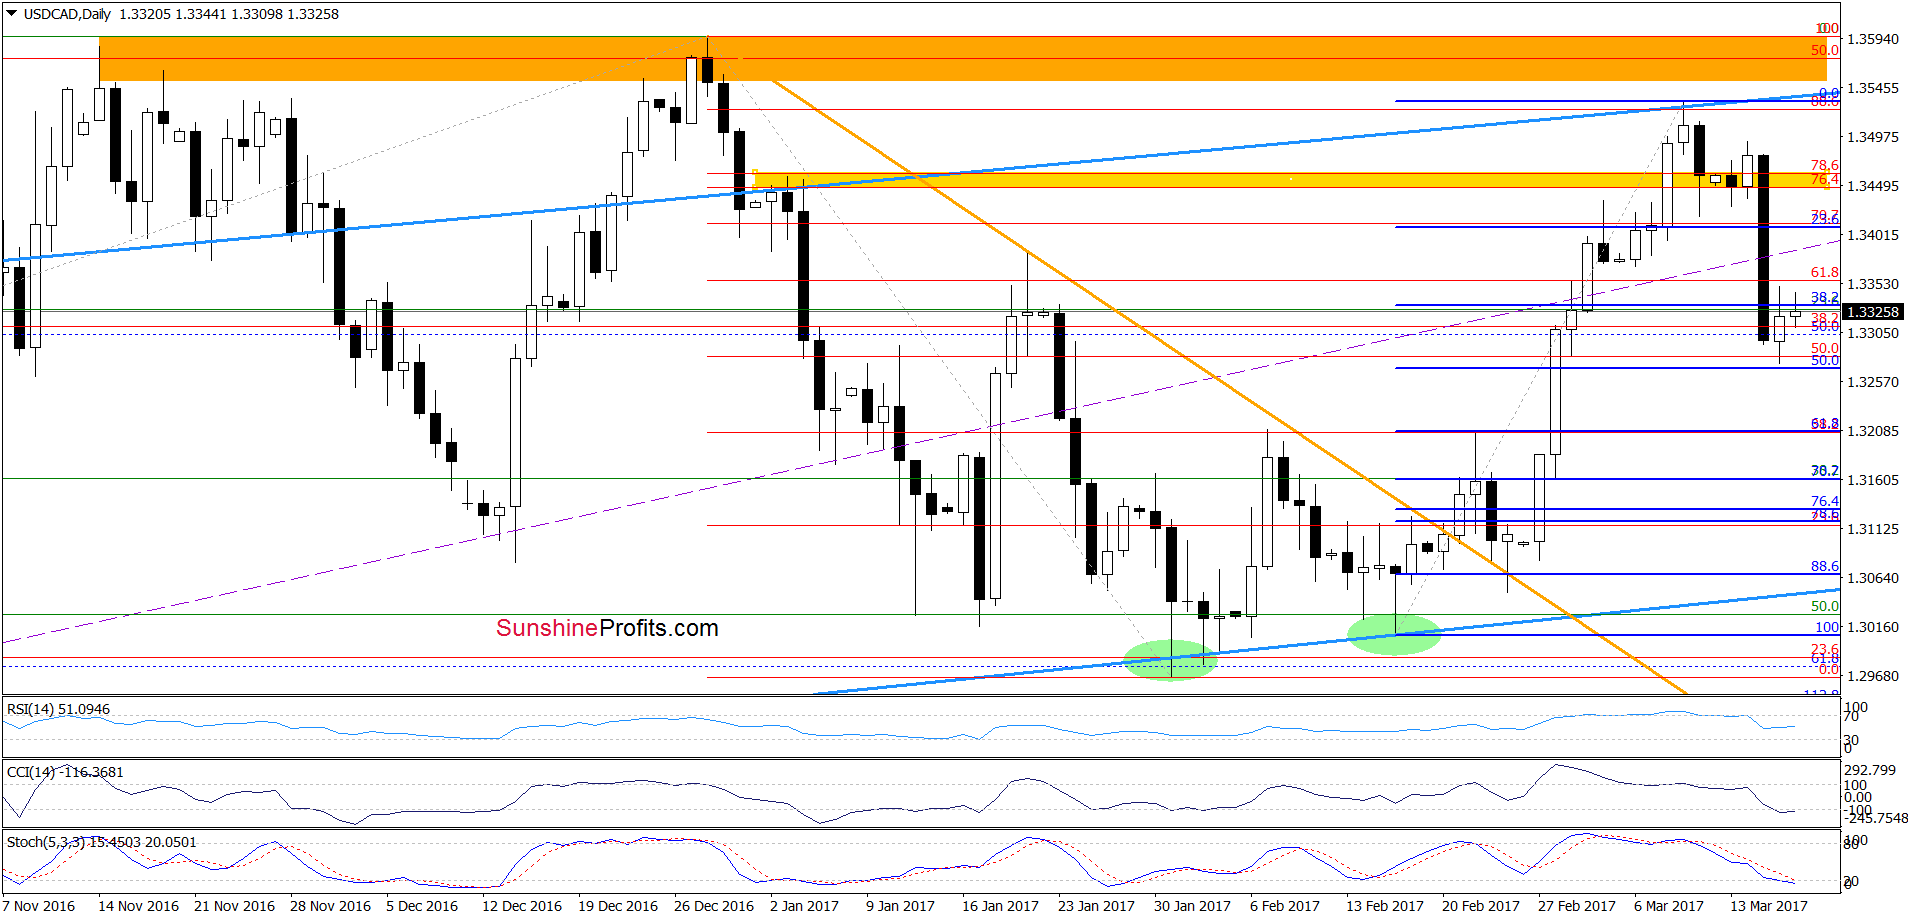
(…) USD/CAD declined under the yellow resistance zone, invalidating the earlier breakout. Additionally, the sell signals generated by the indicators are still in play, suggesting further deterioration in the coming days. If this is the case and the exchange rate declines from here, the initial downside target will be around 1.3382, where the January high and March lows are.
Looking at the daily chart, we see that currency bears not only took USD/CAD to our initial downside target, but also pushed the exchange rate below it, which resulted in a sharp decline to the 50% Fibonacci retracement. Although this support triggered a rebound, the size of the move is tiny compared to Wednesday’s decline, which suggests that the move to the downside might not be over yet. This scenario is also reinforced by the current position of the indicators (there are no buy signals). Therefore, if USD/CAD moves lower from here, we’ll likely see a drop to around 1.3254-1.3265 or even a test of the 61.8% Fibonacci retracement and the February 7 and February 22 highs in the coming day(s).
Very short-term outlook: mixed with bearish bias
Short-term outlook: mixed
MT outlook: mixed
LT outlook: mixed
Trading position (short-term; our opinion): No positions are justified from the risk/reward perspective. We will keep you informed should anything change, or should we see a confirmation/invalidation of the above.
AUD/USD
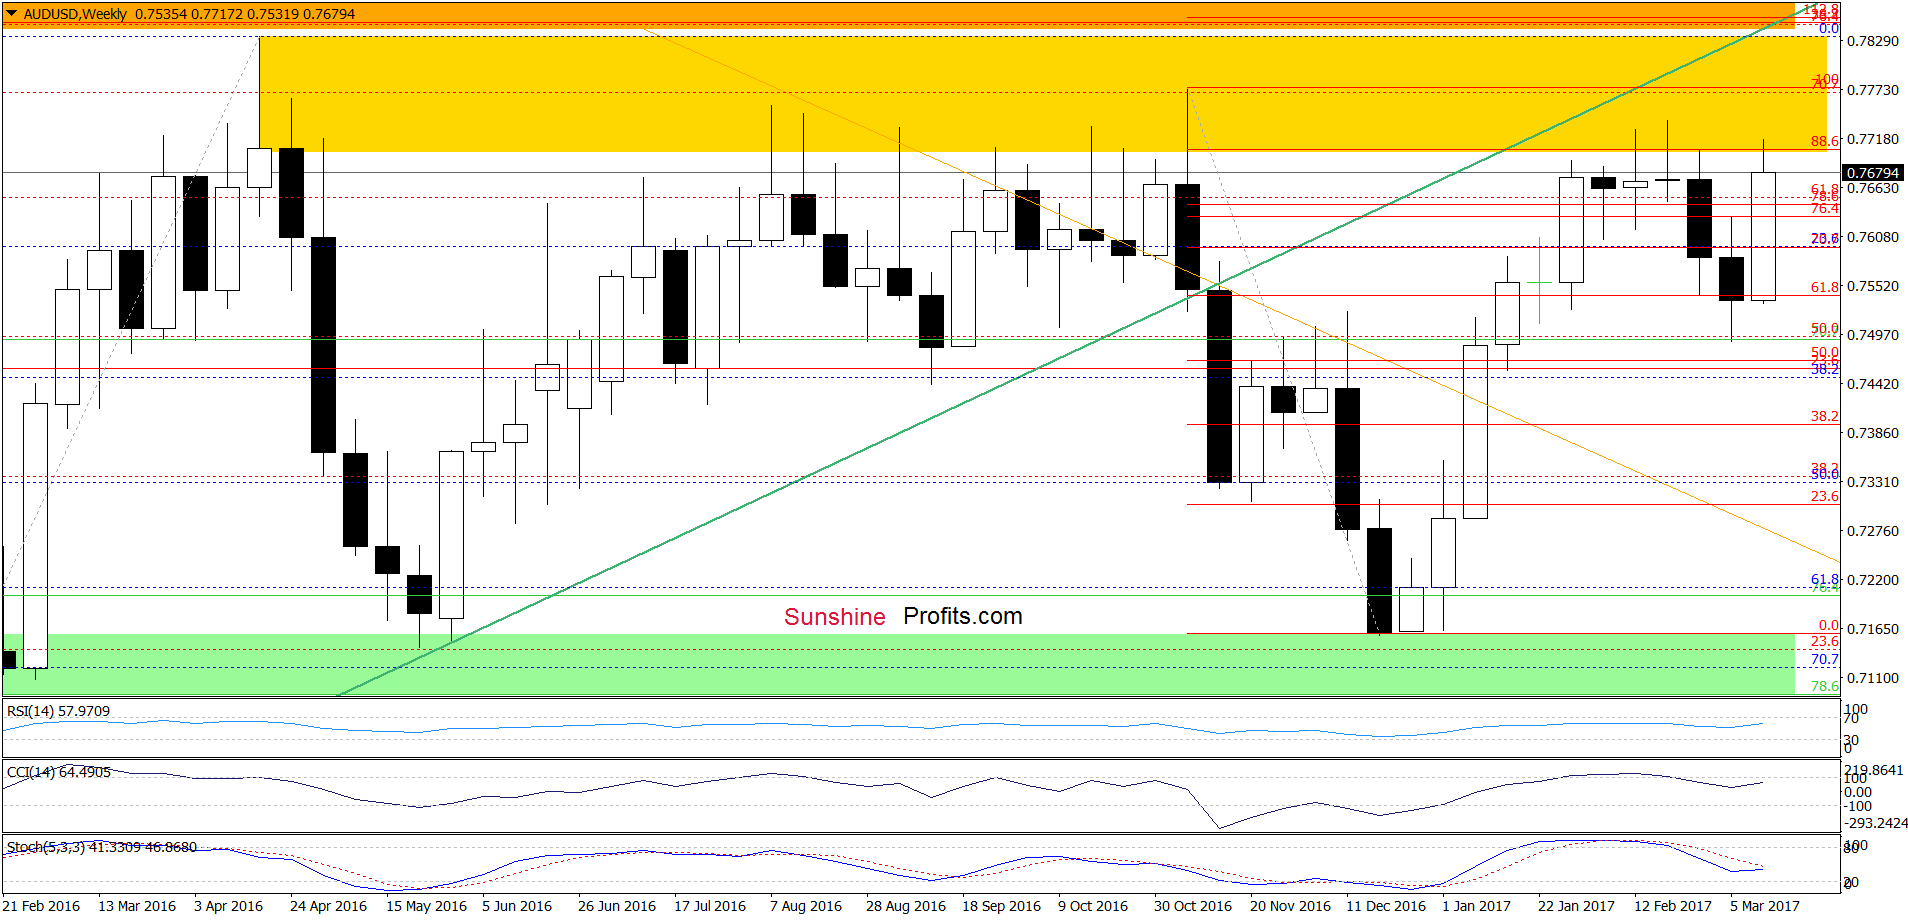
Last Friday, we wrote the following:
(...) AUD/USD bounced off the green support zone (...) and invalidated the earlier breakdown under the 38.2% Fibonacci retracement, which suggests further improvement and quite likely a verification of the breakdown under the lower border of the red rising trend channel in the coming week.
From today’s point of view, we see that AUD/USD moved higher as we had expected. With the recent upward move, the exchange rate not only increased to our upside target, but also climbed above it, invalidating the earlier breakdown. This is a bullish development, which suggests further improvement and a test of the recent highs (especially when we factor in the fact that there are no sell signals at the moment of writing these words) in the coming days.
Very short-term outlook: bullish
Short-term outlook: mixed
MT outlook: mixed
LT outlook: mixed
Trading position (short-term; our opinion): No positions are justified from the risk/reward perspective. We will keep you informed should anything change, or should we see a confirmation/invalidation of the above.
Thank you.
Nadia Simmons
Forex & Oil Trading Strategist
Przemyslaw Radomski, CFA
Founder, Editor-in-chief, Gold & Silver Fund Manager
Gold & Silver Trading Alerts
Forex Trading Alerts
Oil Investment Updates
Oil Trading Alerts

