

At the end of the previous week the greenback moved lower against its Canadian counterpart, which resulted in an invalidation of the earlier breakout above the upper line of the rising wedge. What does it mean for USD/CAD?
In our opinion the following forex trading positions are justified - summary:
- EUR/USD: short (a stop-loss order at 1.0810; the initial downside target at 1.0388)
- GBP/USD: none
- USD/JPY: none
- USD/CAD: none
- USD/CHF: long (a stop-loss order at 0.9891; the initial upside target at 1.0180)
- AUD/USD: none
EUR/USD
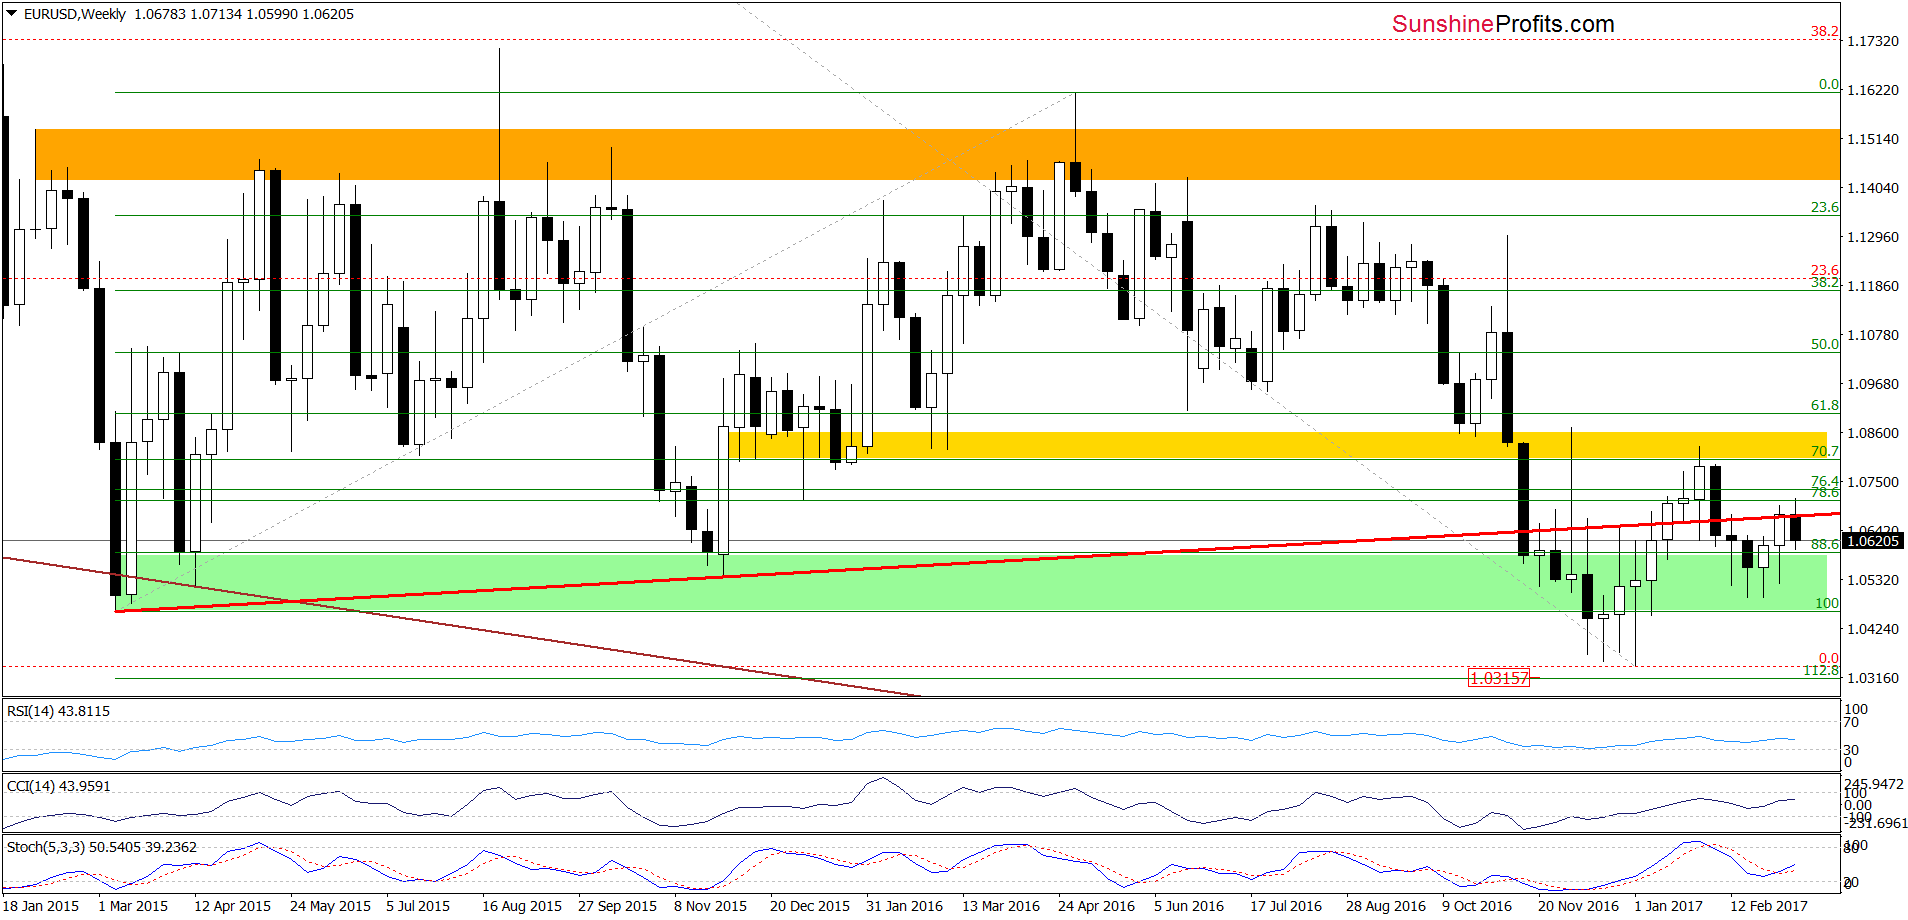
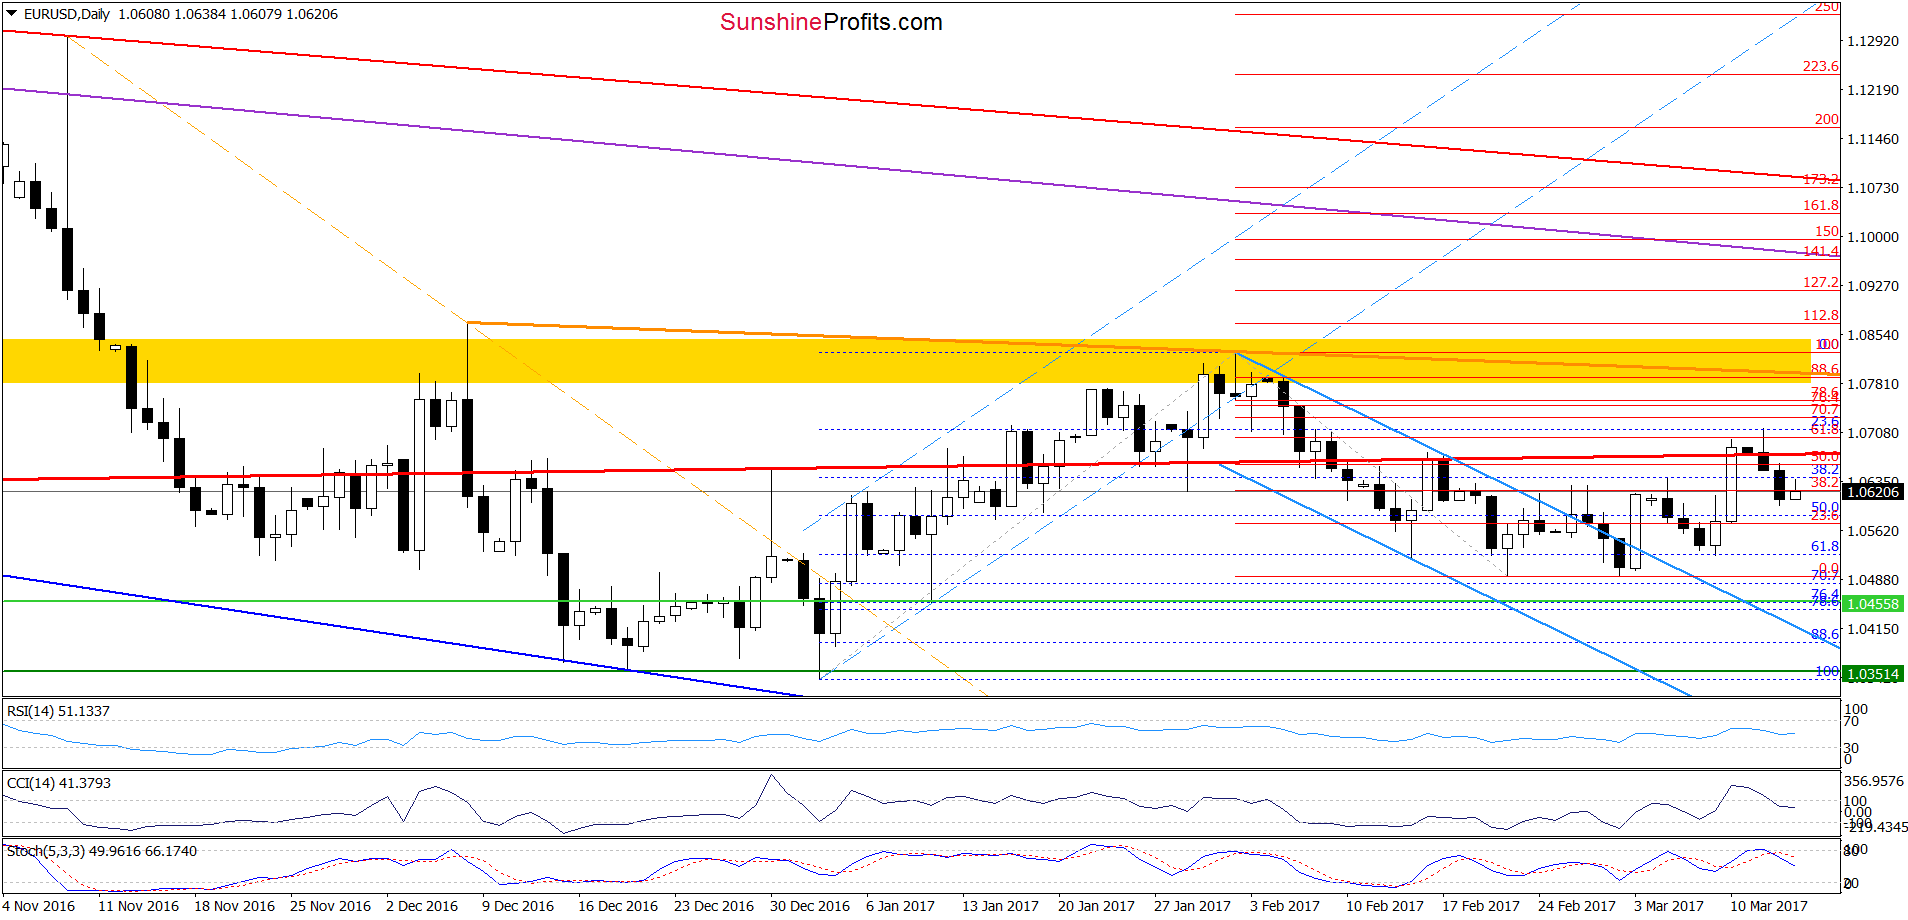
Looking at the daily chart, we see that EUR/USD moved a bit higher earlier today, but despite this increase, the exchange rate is still trading under the previously-broken long-term red line, which means that an invalidation of the breakout above this resistance and its negative impact on the pair is still in effect. Additionally, the sell signals generated by the indicators remain in place, suggesting further deterioration and a test of the recent lows in the following days.
Very short-term outlook: bearish
Short-term outlook: mixed with bearish bias
MT outlook: mixed
LT outlook: mixed
Trading position (short-term; our opinion): Short positions with a stop-loss order at 1.0810 and the initial downside target at 1.0388 are justified from the risk/reward perspective. We will keep you informed should anything change, or should we see a confirmation/invalidation of the above.
USD/CAD
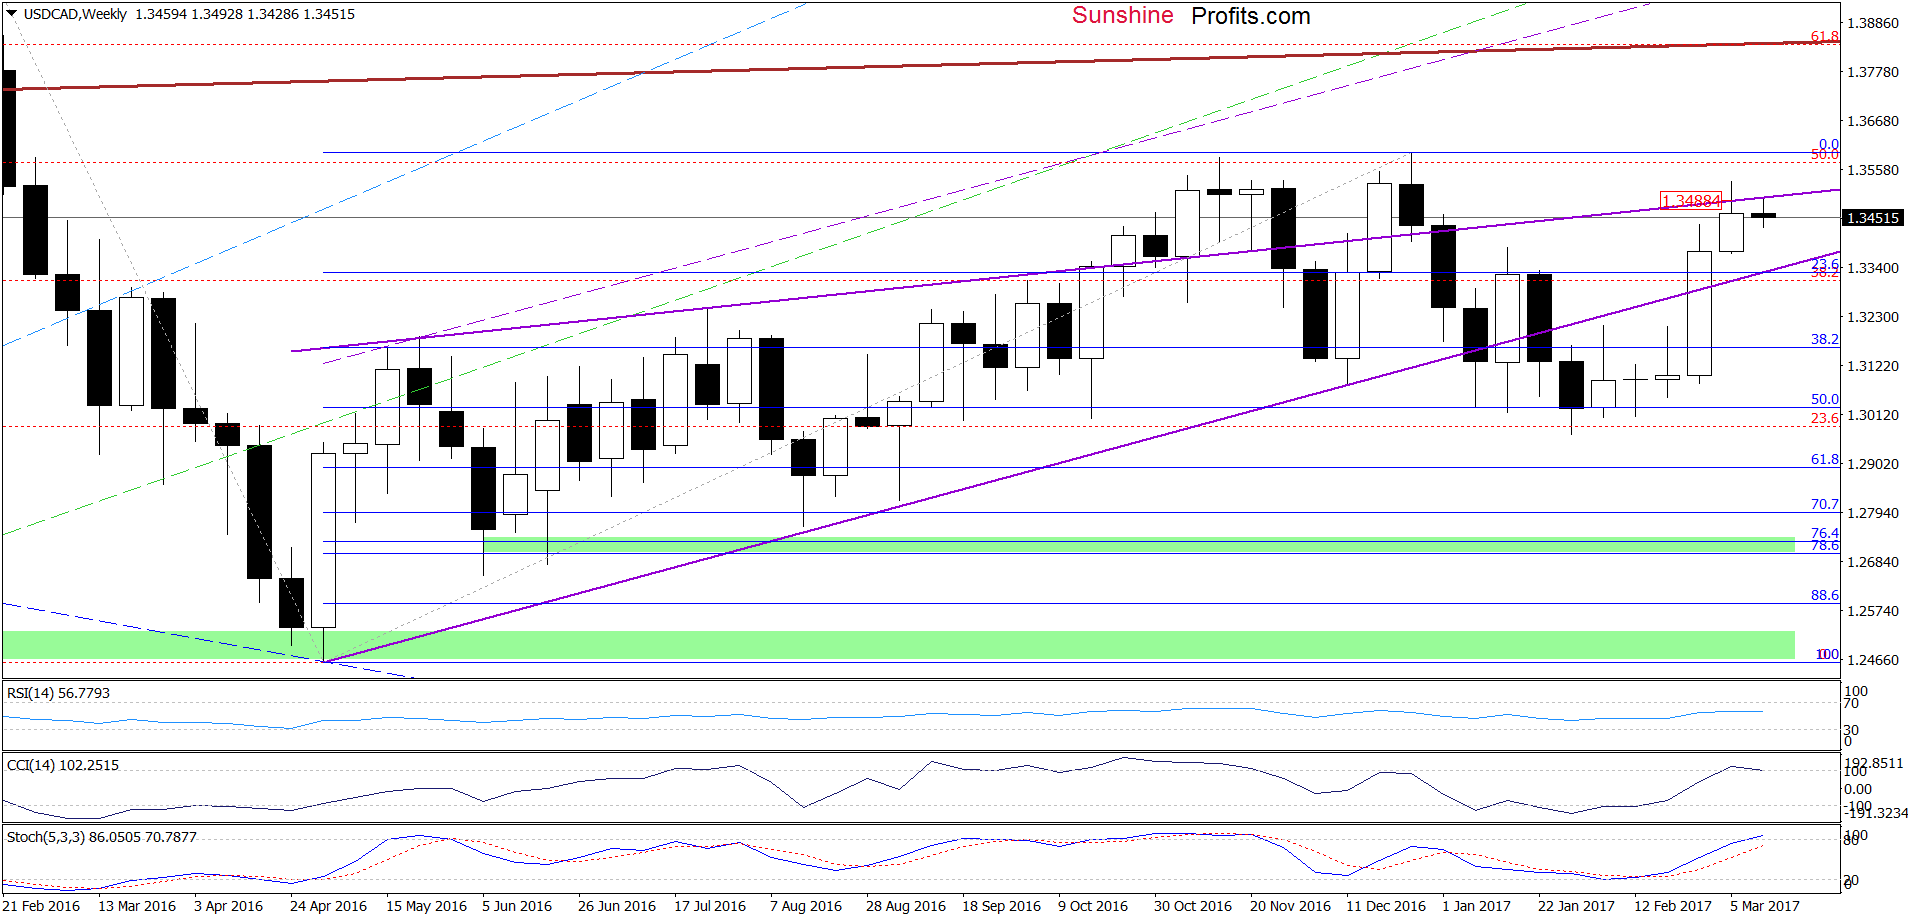
The first thing that catches the eye on the weekly chart is an invalidation of the breakout above the upper border of the purple rising wedge. Earlier this week the pair verified the breakdown, which is a bearish development and suggests further deterioration.
How did this move affect the very short-term picture? Let’s check.
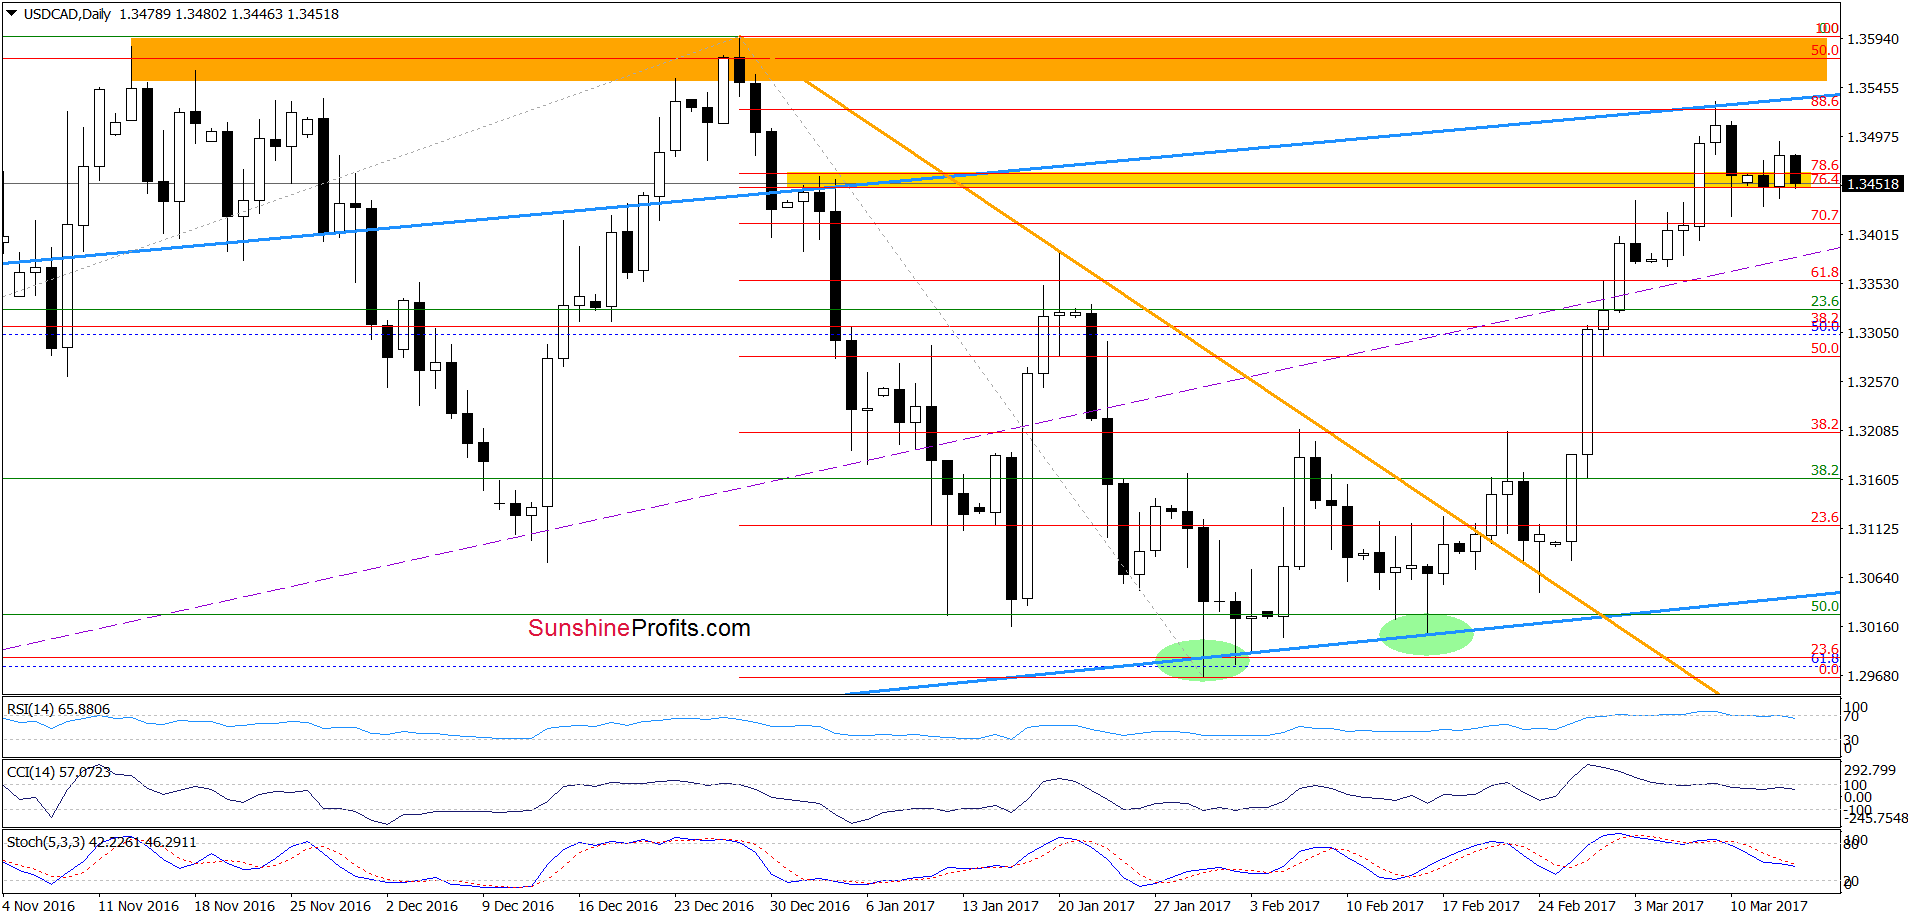
From today’s point of view, we see that USD/CAD declined under the yellow resistance zone, ), invalidating the earlier breakout. Additionally, the sell signals generated by the indicators are still in play, suggesting further deterioration in the coming days. If this is the case and the exchange rate declines from here, the initial downside target will be around 1.3382, where the January high and March lows are.
Very short-term outlook: mixed with bearish bias
Short-term outlook: mixed with bearish bias
MT outlook: mixed
LT outlook: mixed
Trading position (short-term; our opinion): No positions are justified from the risk/reward perspective. We will keep you informed should anything change, or should we see a confirmation/invalidation of the above.
AUD/USD
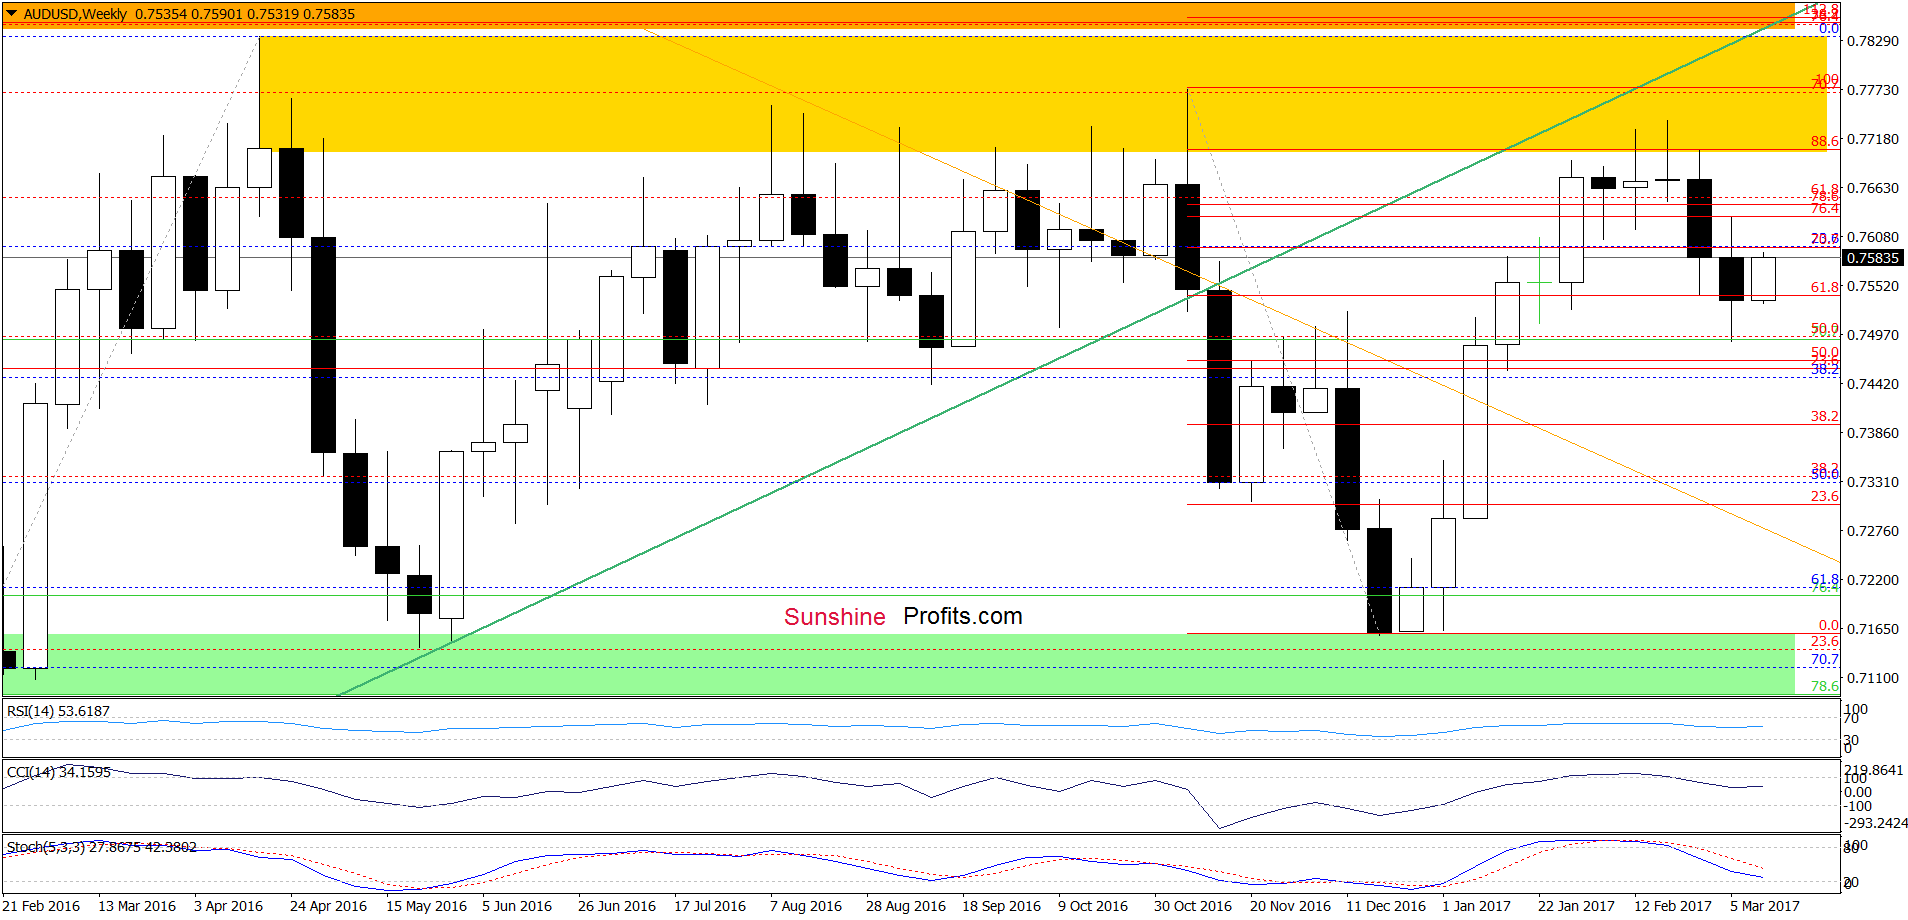
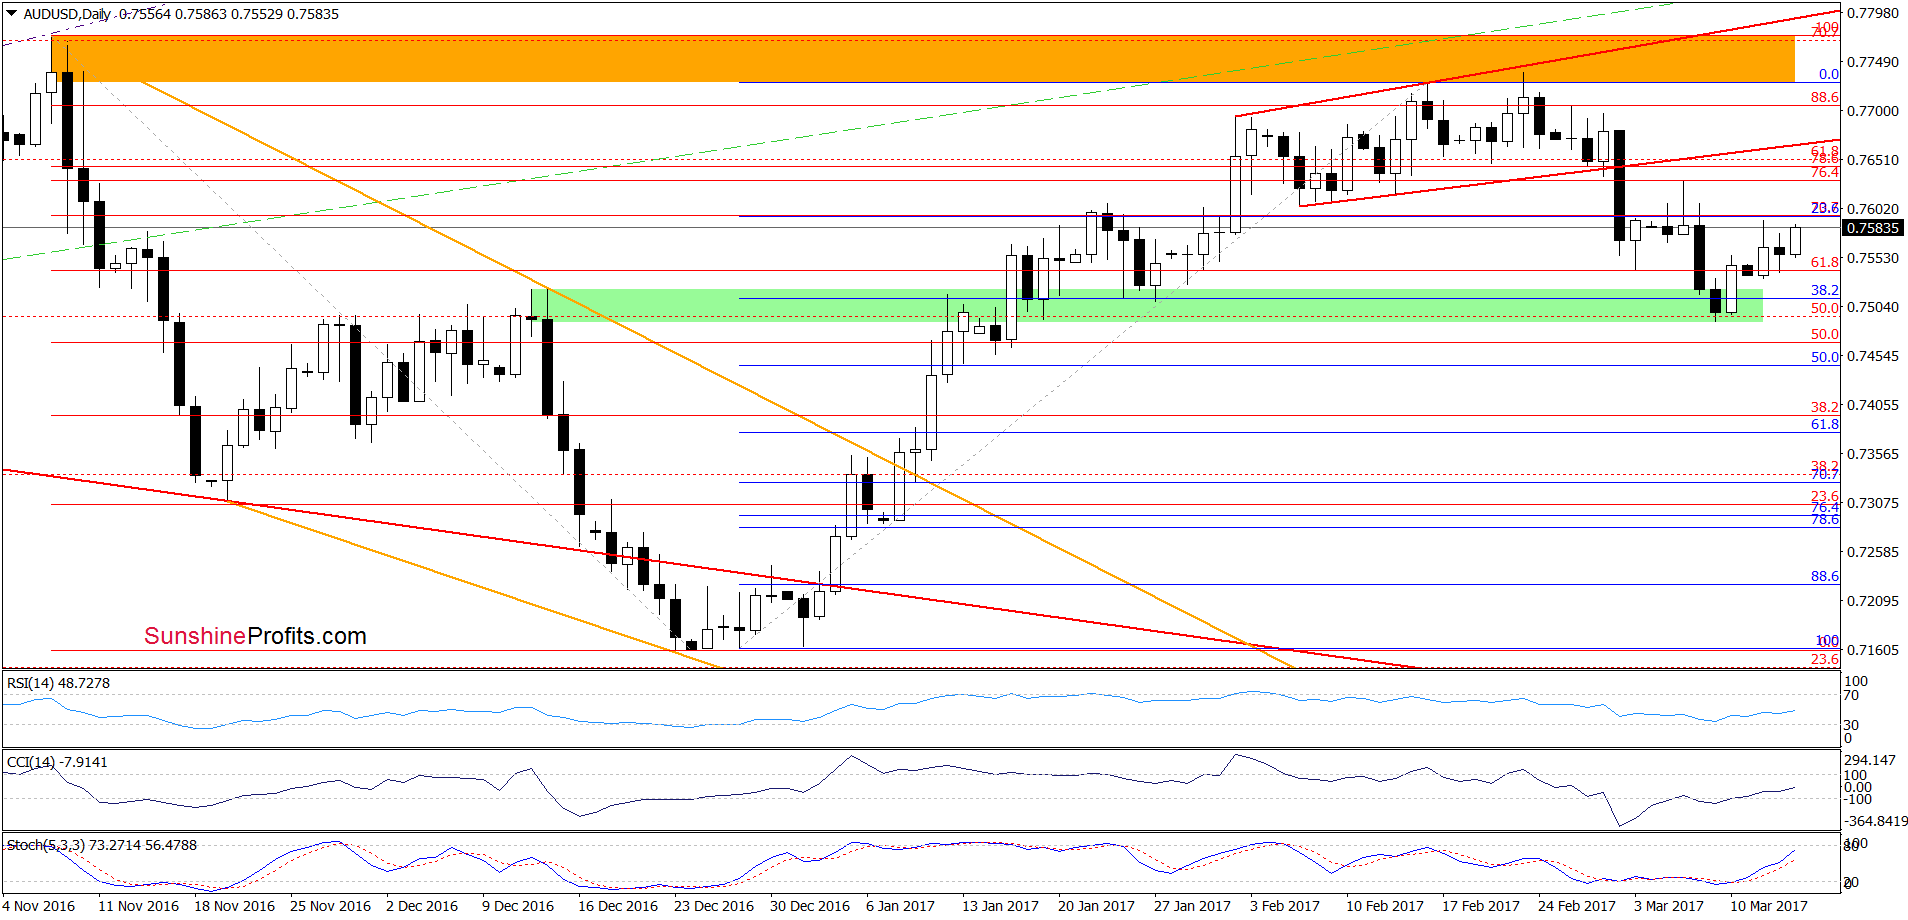
Looking at the daily chart, we see that AUD/USD moved higher once again, which means that what we wrote on Friday remains up-to-date:
(...) AUD/USD bounced off the green support zone (...) and invalidated the earlier breakdown under the 38.2% Fibonacci retracement, which suggests further improvement and quite likely a verification of the breakdown under the lower border of the red rising trend channel in the coming week.
Very short-term outlook: mixed with bullish bias
Short-term outlook: mixed
MT outlook: mixed
LT outlook: mixed
Trading position (short-term; our opinion): No positions are justified from the risk/reward perspective. We will keep you informed should anything change, or should we see a confirmation/invalidation of the above.
Thank you.
Nadia Simmons
Forex & Oil Trading Strategist
Przemyslaw Radomski, CFA
Founder, Editor-in-chief, Gold & Silver Fund Manager
Gold & Silver Trading Alerts
Forex Trading Alerts
Oil Investment Updates
Oil Trading Alerts

