

Earlier today, the yen moved higher against the greenback after official data showed that Japan's trade surplus narrowed to 152.5 billion yen in the previous month. What happened with other currency pairs at the same time?
In our opinion the following forex trading positions are justified - summary:
EUR/USD
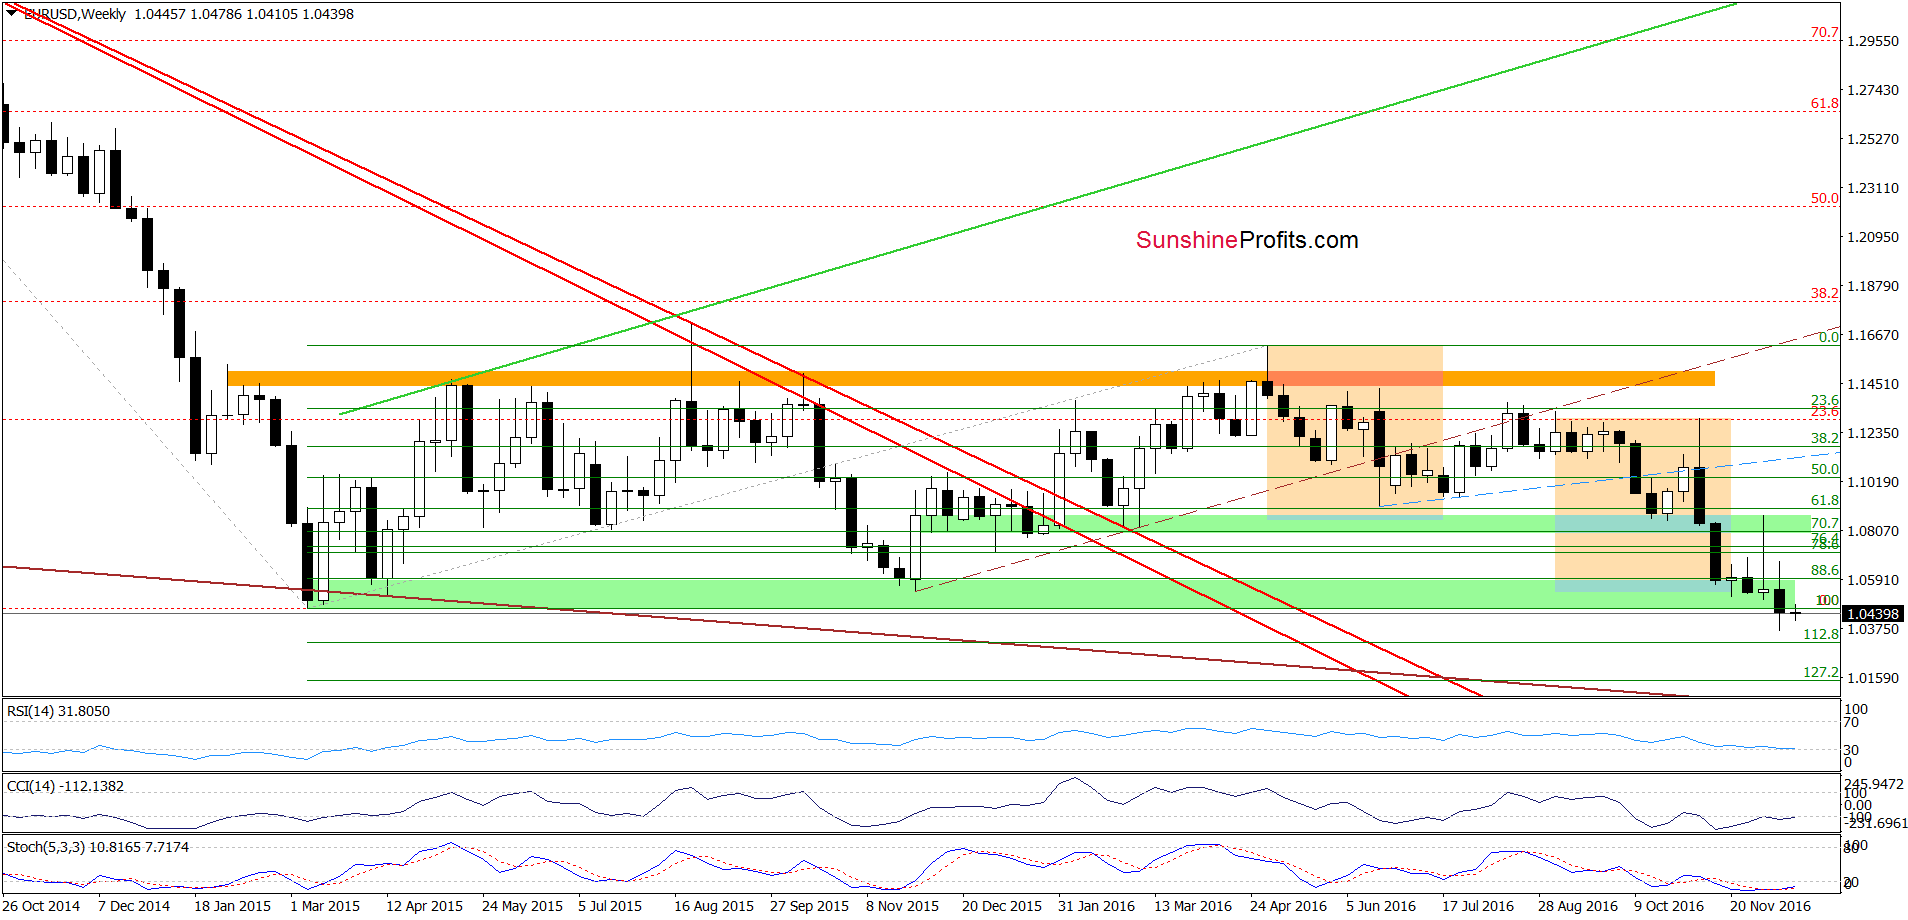
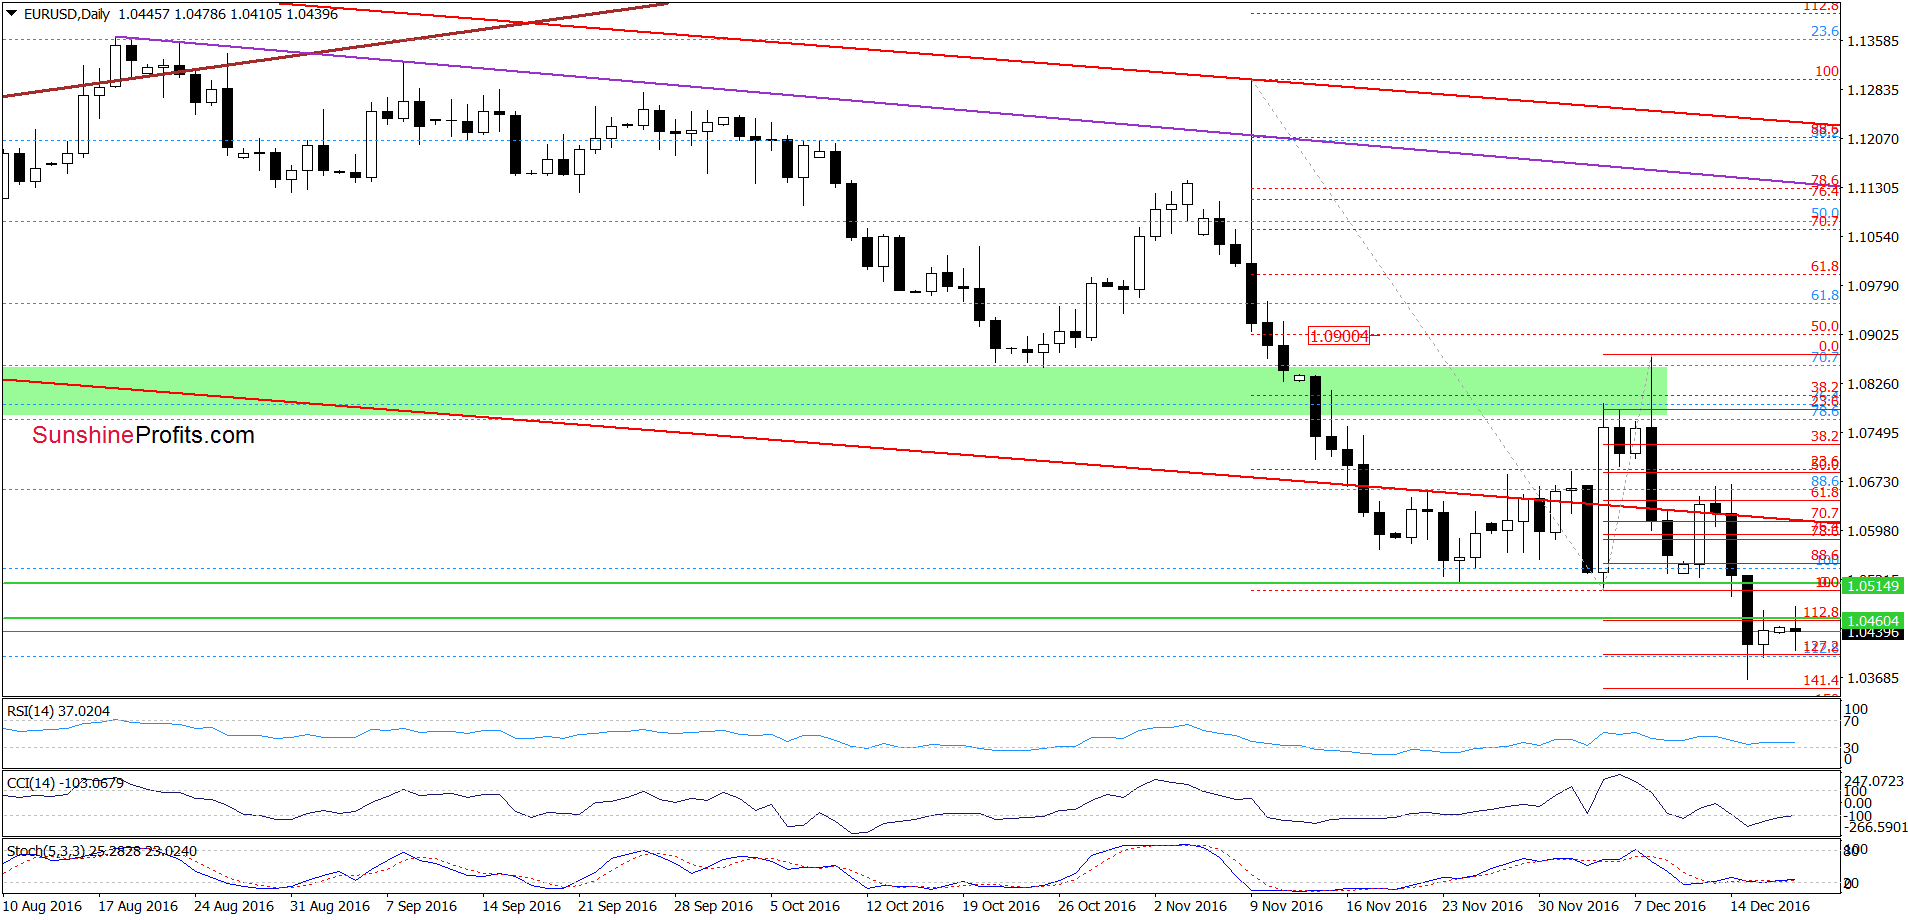
Looking at the daily chart, we see that EUR/USD is consolidating under the previously-broken Nov and early-Dec lows, which makes the very short-term picture a bit unclear. Nevertheless, the CCI and Stochastic Oscillator (not only daily, but also weekly) are very close to generating buy signals, which suggests that we may see an attempt to move higher in the following days. If this is the case, the initial upside target would be around 1.0606, where the red resistance line is (the lower border of the red declining trend channel marked on the daily chart).
Very short-term outlook: mixed
Short-term outlook: mixed
MT outlook: mixed
LT outlook: mixed
Trading position (short-term; our opinion): No positions are justified from the risk/reward perspective. We will keep you informed should anything change, or should we see a confirmation/invalidation of the above.
GBP/USD
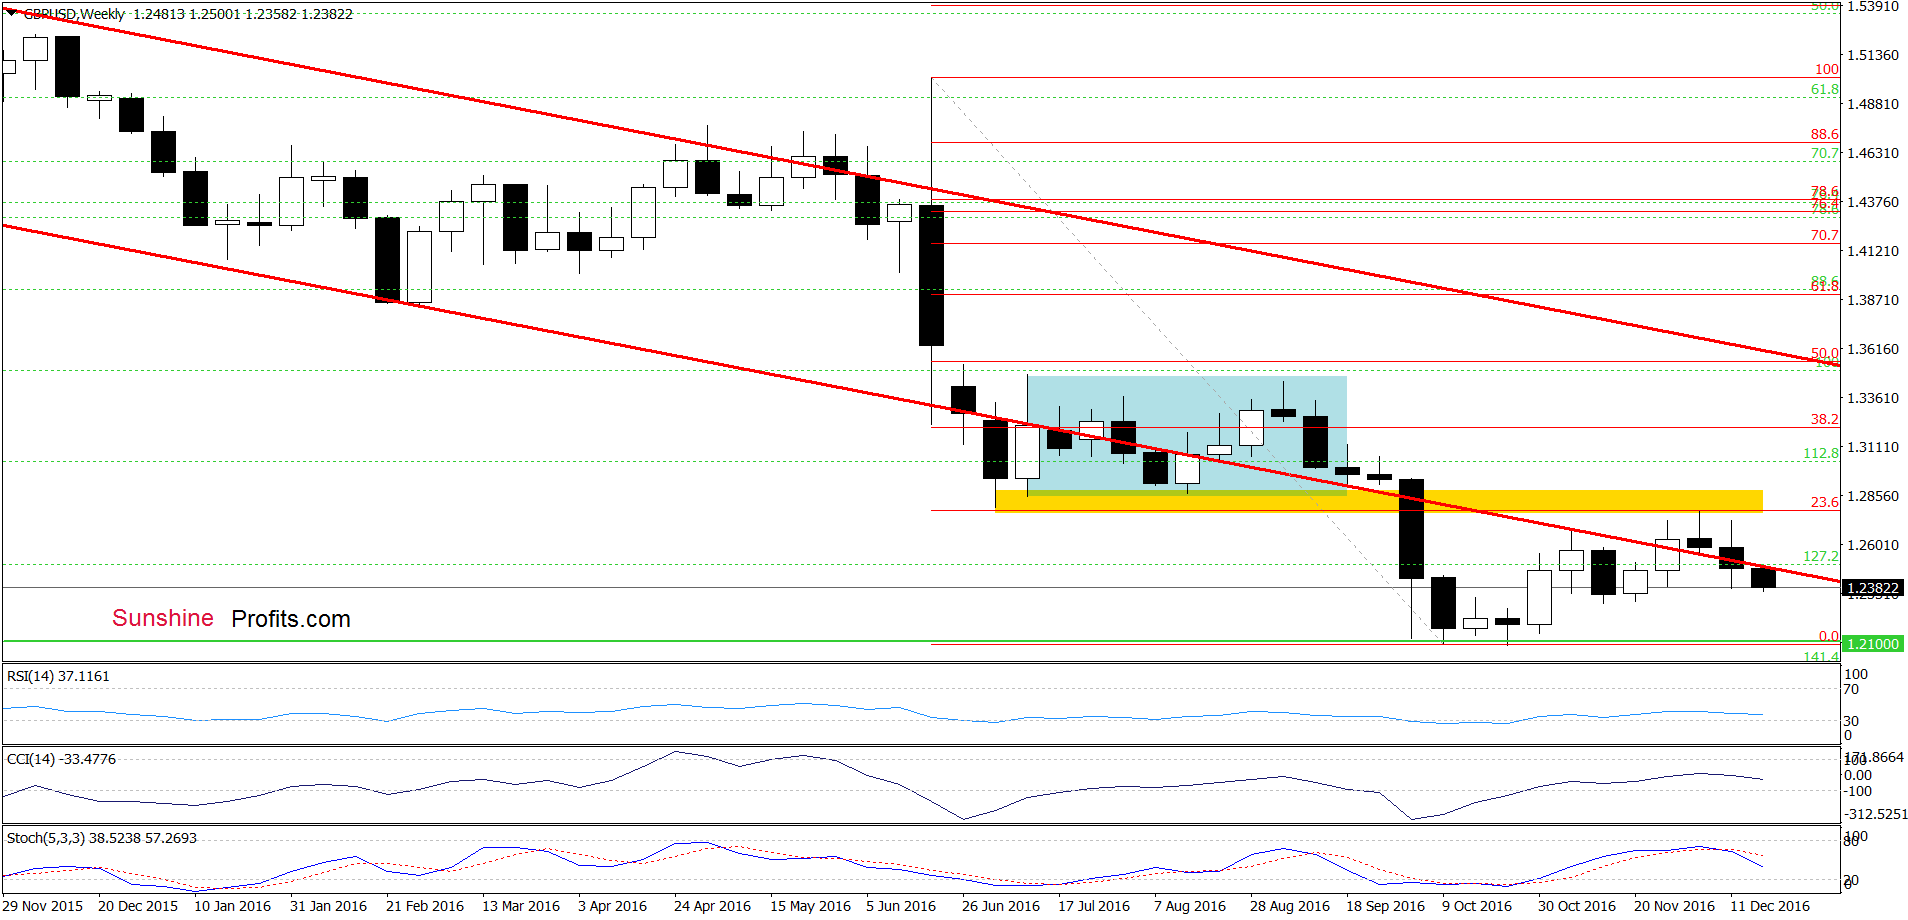
Looking at the weekly chart, we see that GBP/USD moved lower and invalidted earlier breakout above the lower border of the red declining trend channel – similarly to what we saw at the beginning of Oct. Such price action doesn’t bode well for currency bulls and suggests further deterioration. This scenario is also reinforced by a sell signal generated by the Stochastic Oscillator.
How low could the exchange rate go? Let’s check.
On Dec 8, we wrote the following:
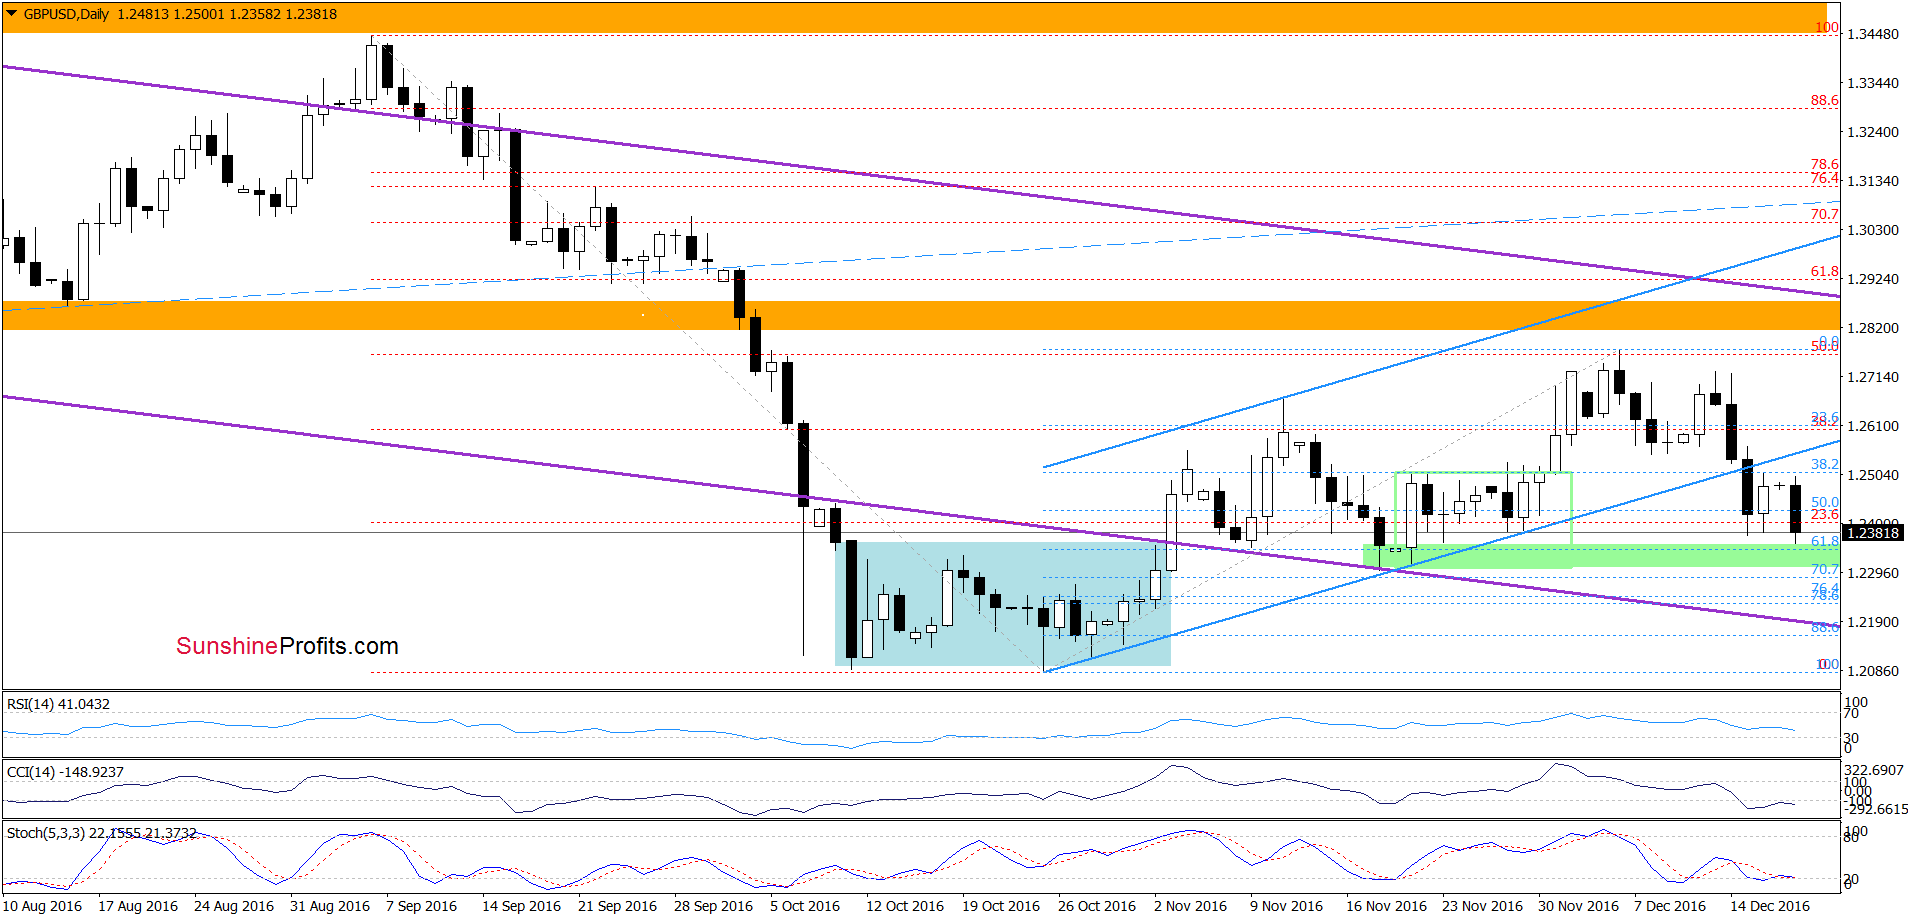
(…) GBP/USD moved higher and climbed to the 50% Fibonacci retracement, which triggered a pullback in previous days. Additionally, the CCI and Stochastic Oscillator generated sell signals, which suggests that (…) reversal is just around the corner. If this is the case, and the pair moves lower from current levels, the initial downside target 1.2510-1.2530). If this area is broken, the next target for currency bears would be around 1.2310, where the lower line of the formation is.
From today’s point of view, we see that currency bears pushed GBP/USD lower, which took the exchange rate to our downside targets. On one hand, this area could trigger a rebound in the following day(s). Nevertheless, we should keep in mind that the last week’s decline pushed the pair below the lower border of the blue rising trend channel, which is a negative signal that suggests a drop to around 1.2090, where the size of the move would correspond to the height of the channel. In this area is also the Oct low and the barrier of 1.2000, which together could stop further deterioration once again.
Very short-term outlook: mixed wih bearish bias
Short-term outlook: bearish
MT outlook: bearish
LT outlook: bearish
Trading position (short-term; our opinion): No positions are justified from the risk/reward perspective. We will keep you informed should anything change, or should we see a confirmation/invalidation of the above.
USD/JPY
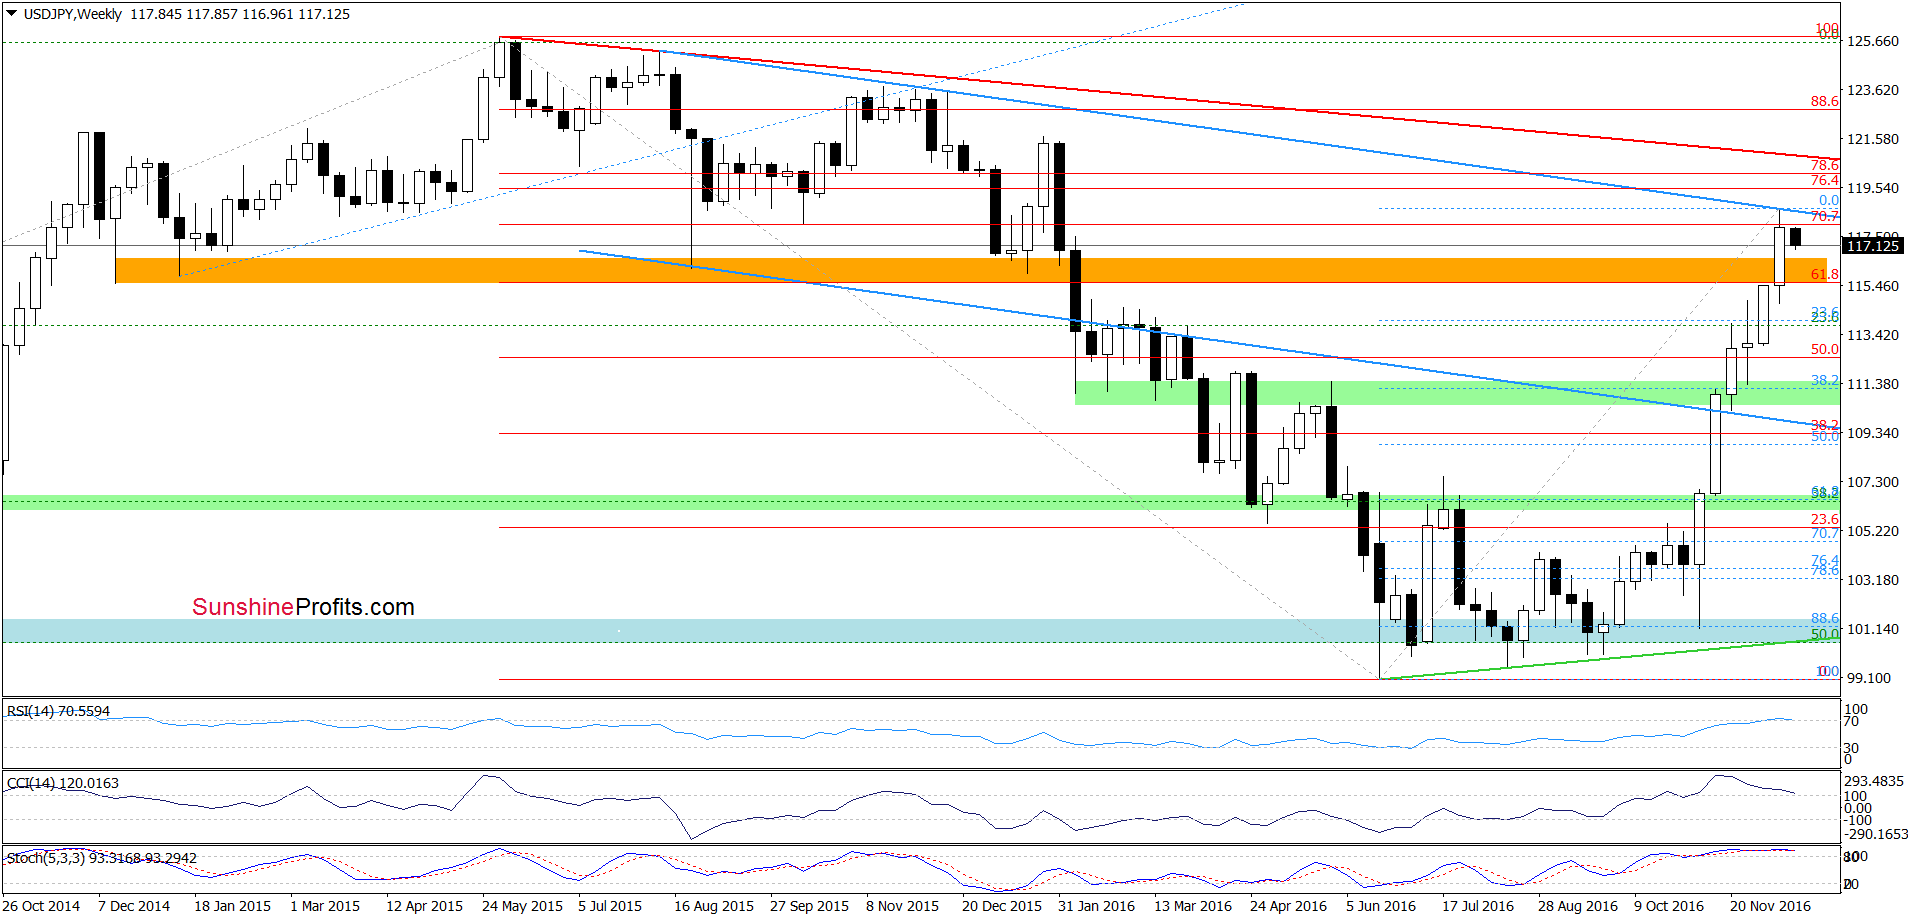
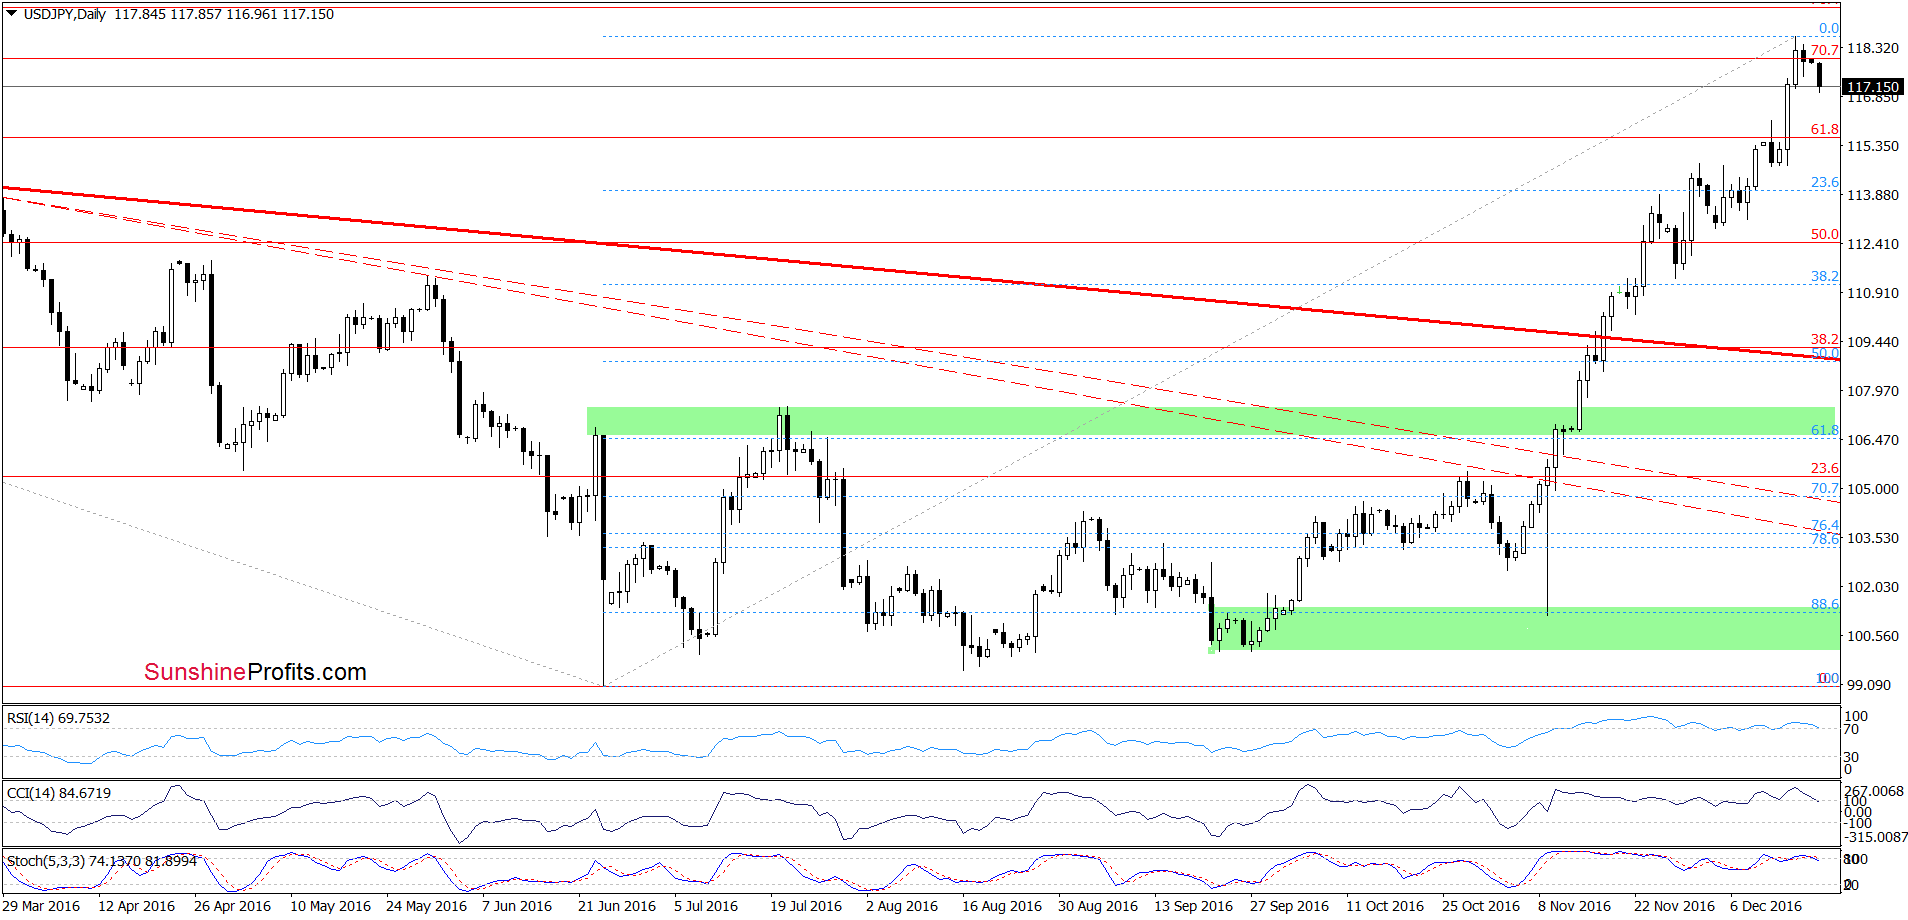
On the weekly chart, we see that USD/JPY extended gains in the previous week and broke above the orange resistance zone, which took the exchange rate to the upper border of the blue declining trend channel. As you see, this area is also reinforced by the 70.7% Fibonacci retracement, which triggered a pullback earlier today. Additionally, weekly and daily and weekly indicators are very close to generating sell signals, which increases the probability of further declines in the coming days. Nevertheless, in our opinion, such price action would be more likely if the exchange rate declines below the orange zone (marked on the weekly chart), which serves now as the nearest support. If this area is broken, USD/JPY could drop to around 111.17, where the 38.2% Fibonacci retracement and the green support zone are.
Very short-term outlook: mixed with bearish bias
Short-term outlook: mixed
MT outlook: mixed
LT outlook: mixed
Trading position (short-term; our opinion): No positions are justified from the risk/reward perspective. We will keep you informed should anything change, or should we see a confirmation/invalidation of the above.
USD/CAD
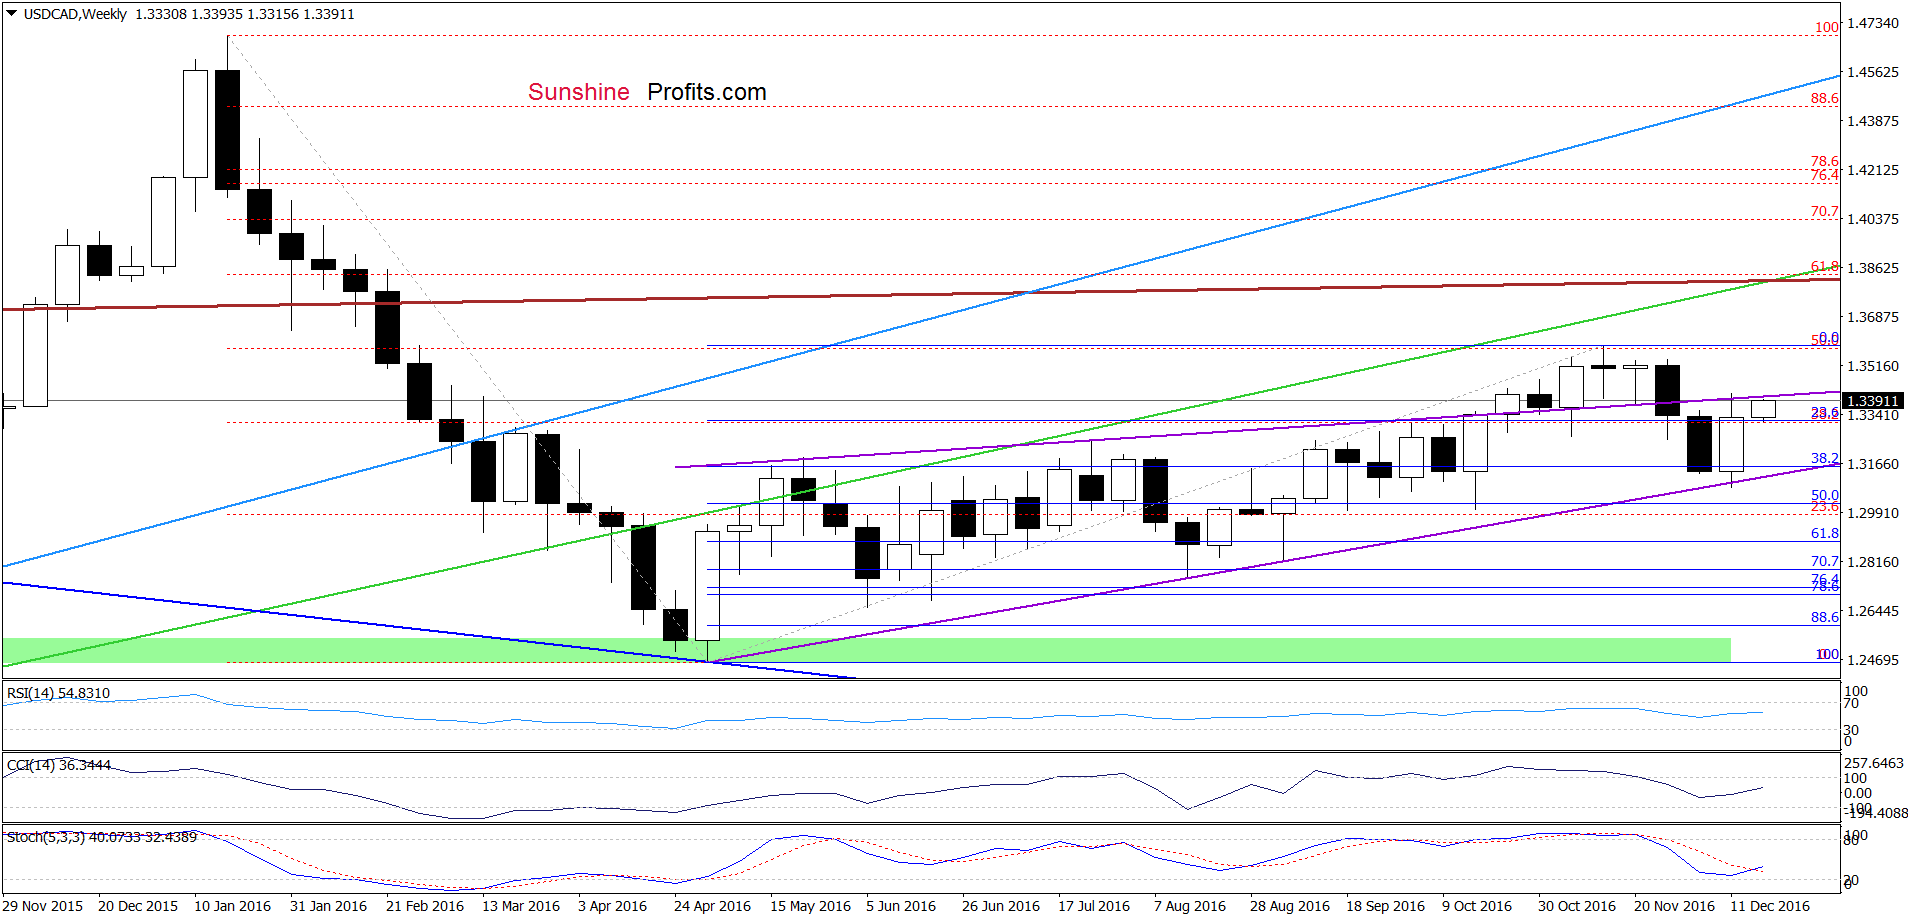
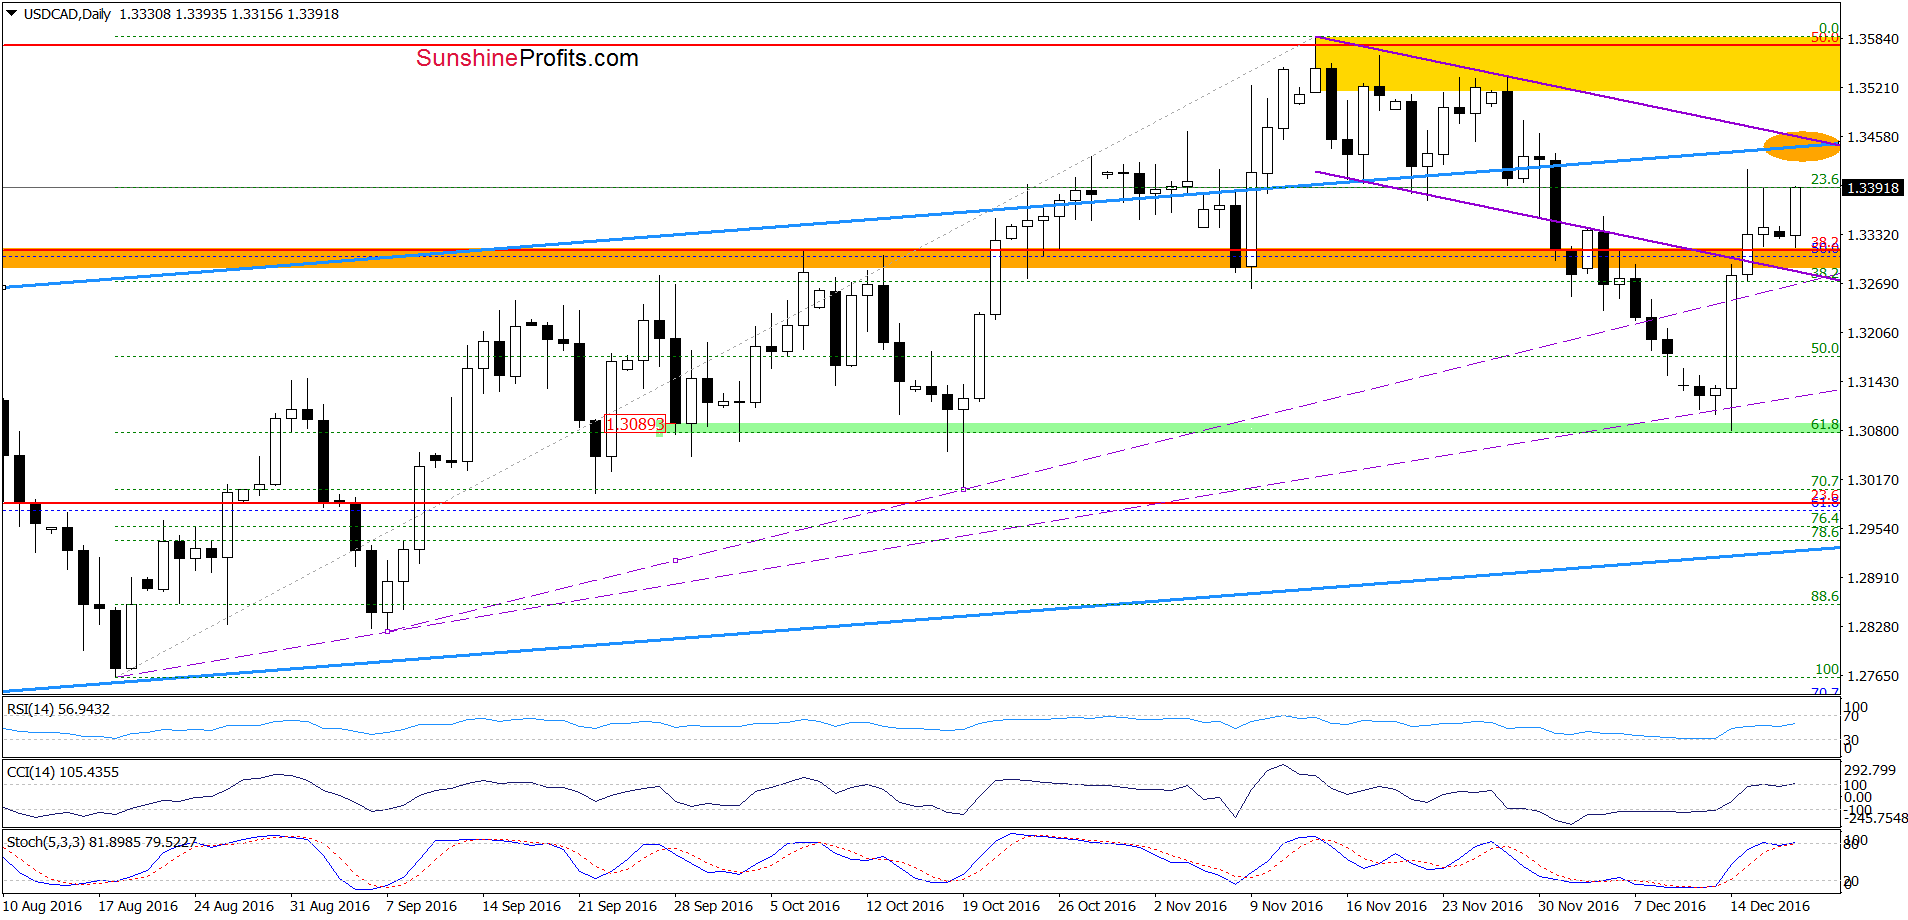
Looking at the charts, we see that USD/CAD came back to Friday’s levels, which means that what we wrote in our previous commentary remain up-to-date:
(…) the green support zone triggered a sharp rebound, which took the pair not only above the orange resistance zone, but also the lower border of the purple declining trend channel (seen on the daily chart). In this way, USD/CAD invalidated earlier breakdowns, which is a bullish development that suggests further improvement and a test of the upper line of the blue rising trend channel and the upper line of the purple trend channel (we marked this area with an orange ellipse) in the coming days.
Very short-term outlook: bullish
Short-term outlook: mixed
MT outlook: mixed
LT outlook: mixed
Trading position (short-term; our opinion): No positions are justified from the risk/reward perspective. We will keep you informed should anything change, or should we see a confirmation/invalidation of the above.
USD/CHF
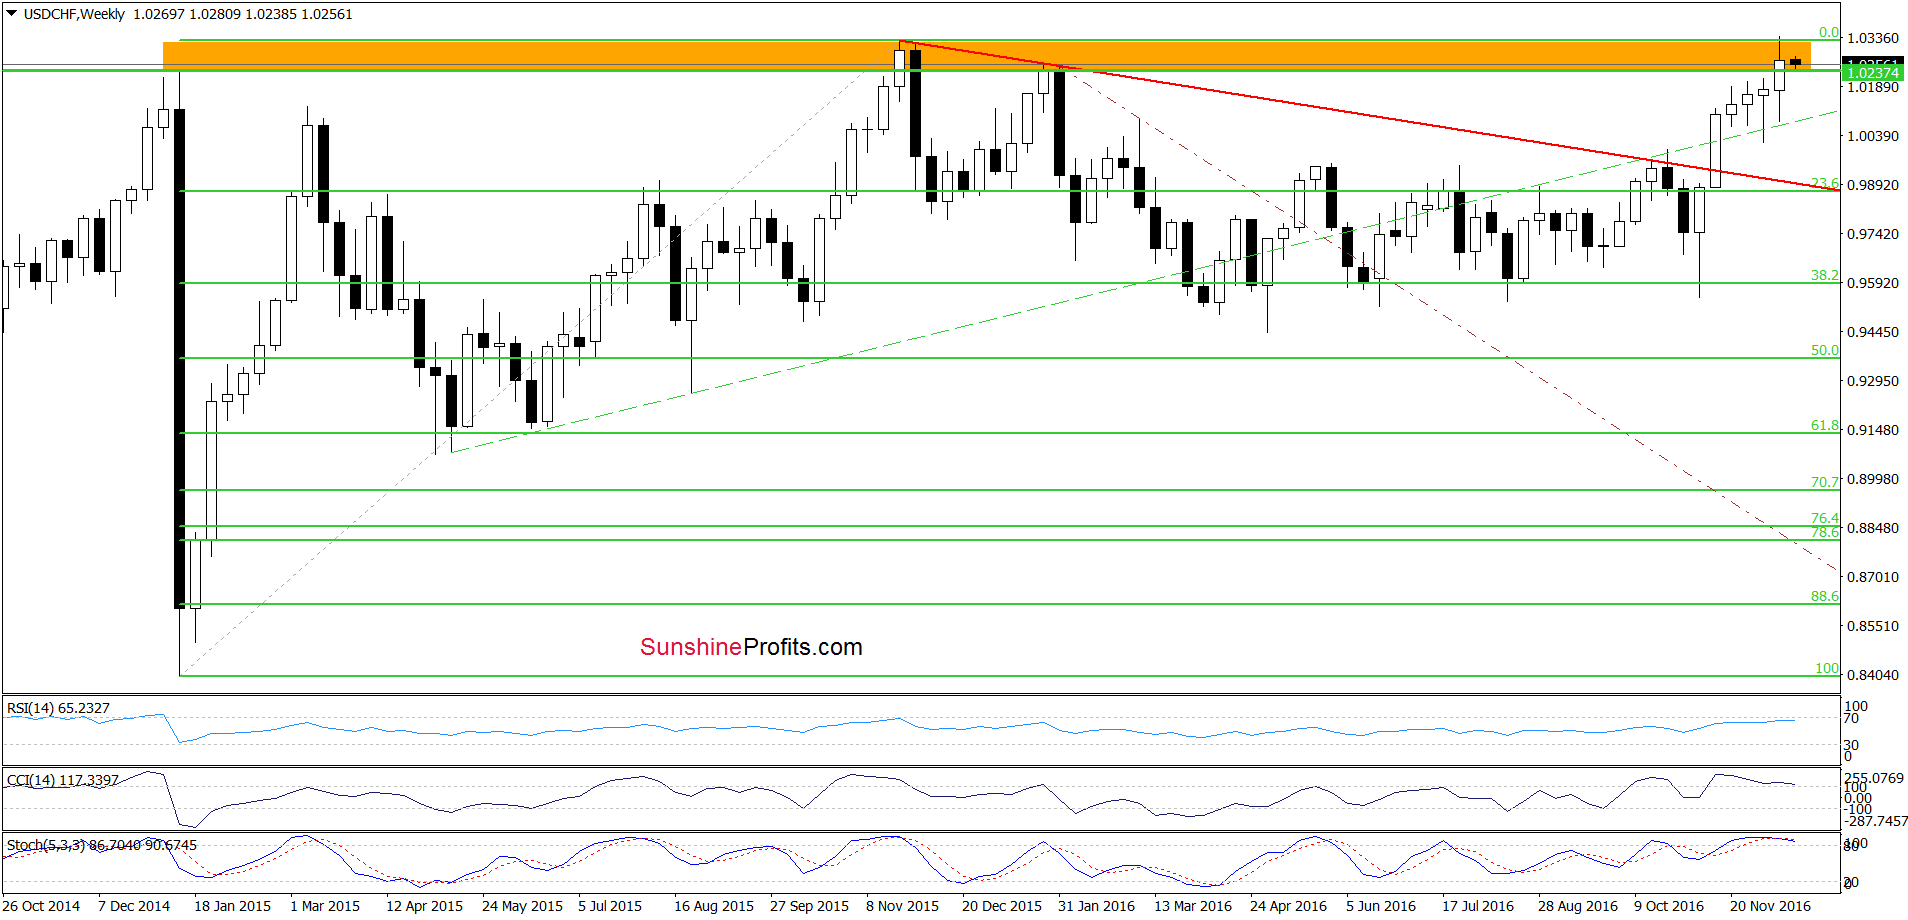
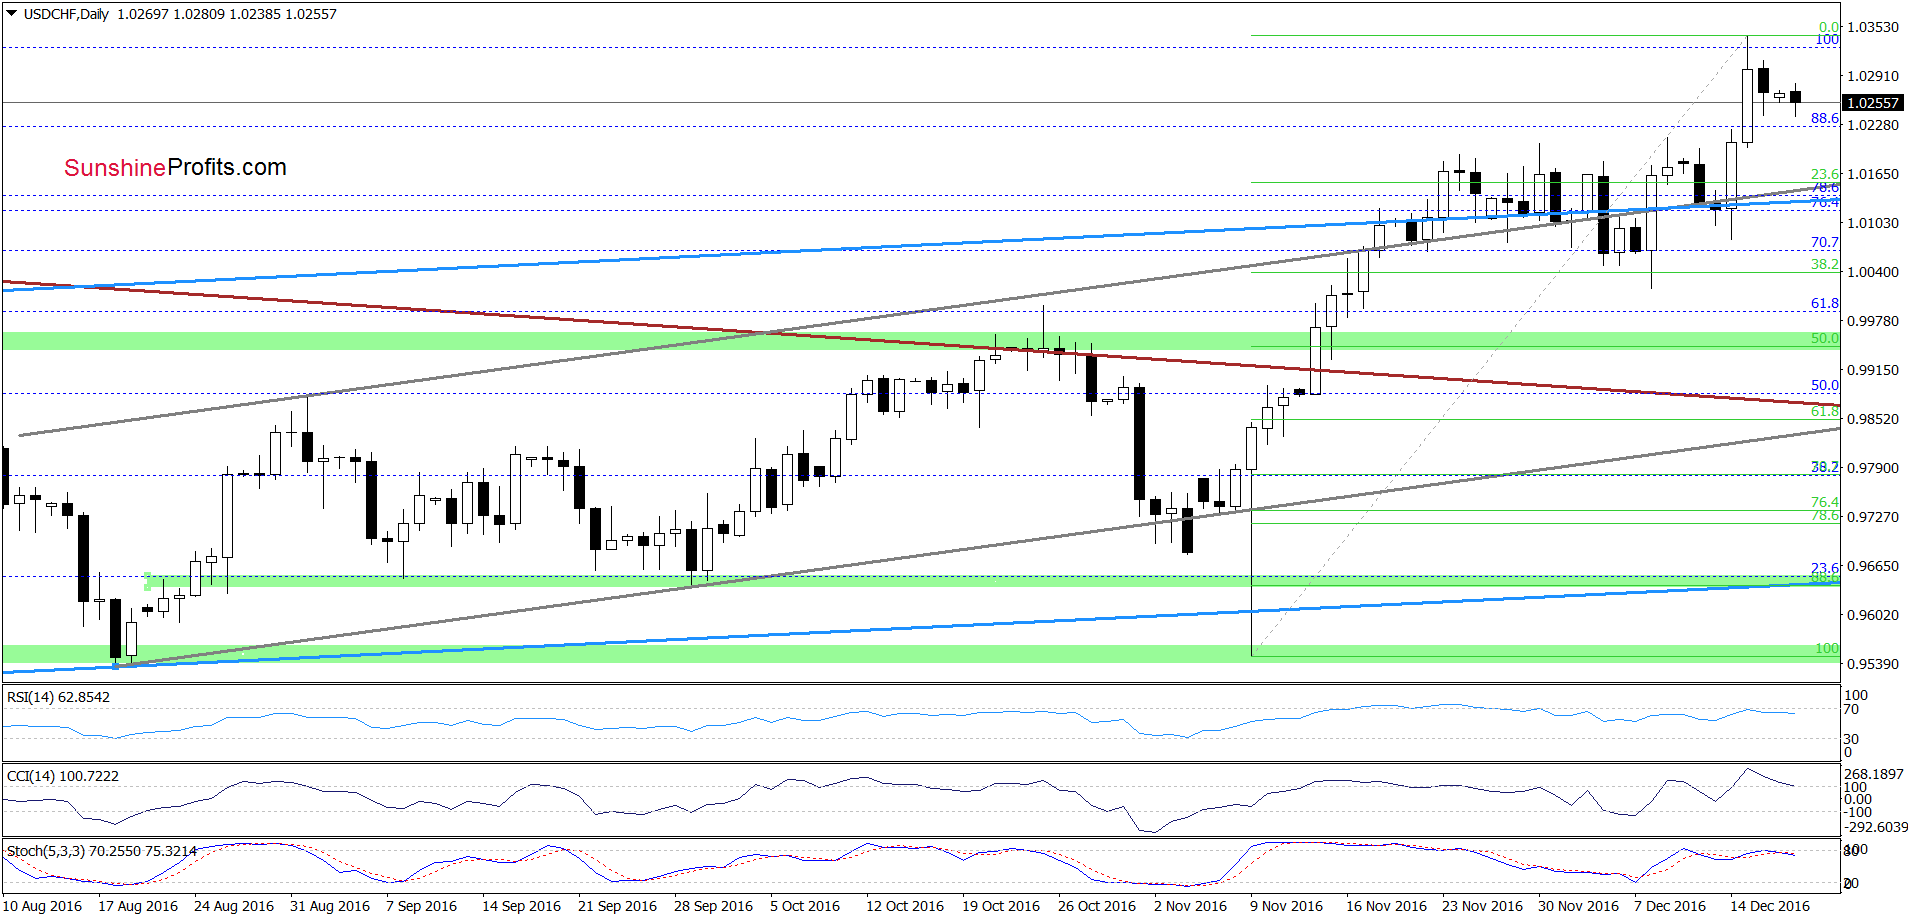
Looking at the daily chart, we see that although USD/CHF climbed above the Nov high, currency bulls didn’t manage to hold gained levels, which resulted in a pullback. With this move, the pair invalidated earlier breakout above the Nov peak, which in combination with the current position of the weekly and daily indicators suggests further deterioration in the coming week. If this is the case, the exchange rate will drop to the previously-broken upper border of the blue and the purple rising trend channels (currently around 1.0132-1.0141).
Very short-term outlook: mixed with bearish bias
Short-term outlook: mixed
MT outlook: mixed
LT outlook: mixed
Trading position (short-term; our opinion): No positions are justified from the risk/reward perspective. We will keep you informed should anything change, or should we see a confirmation/invalidation of the above.
AUD/USD
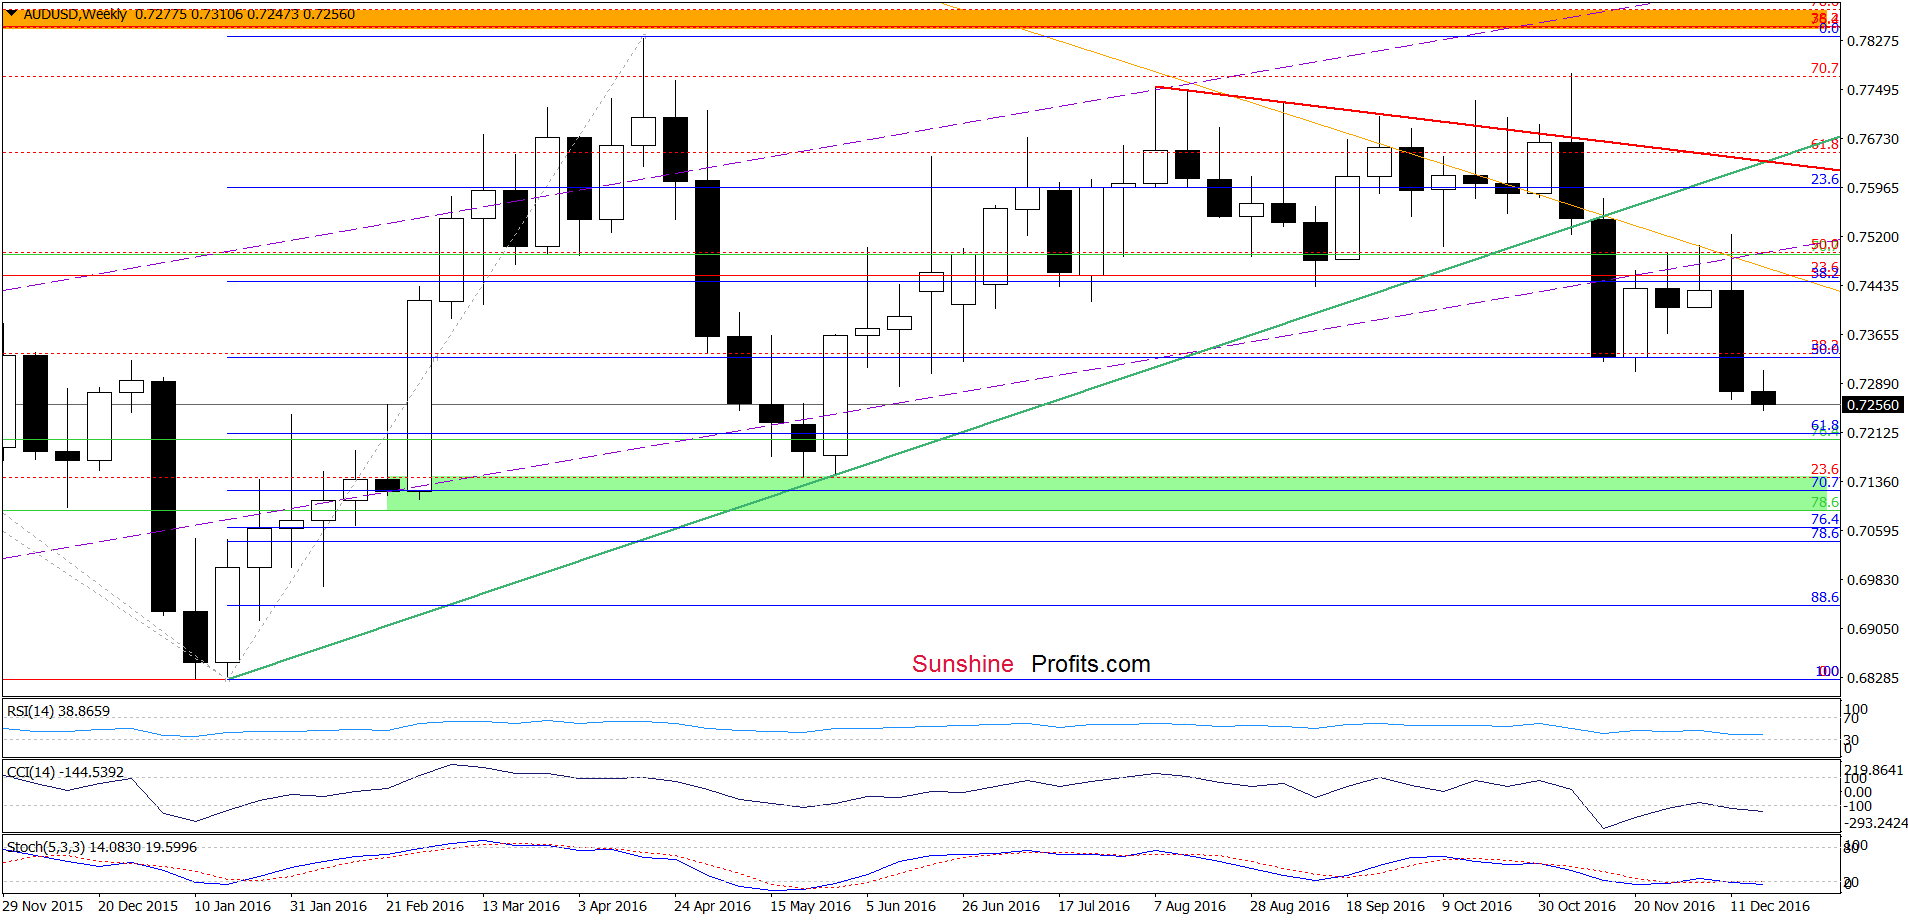
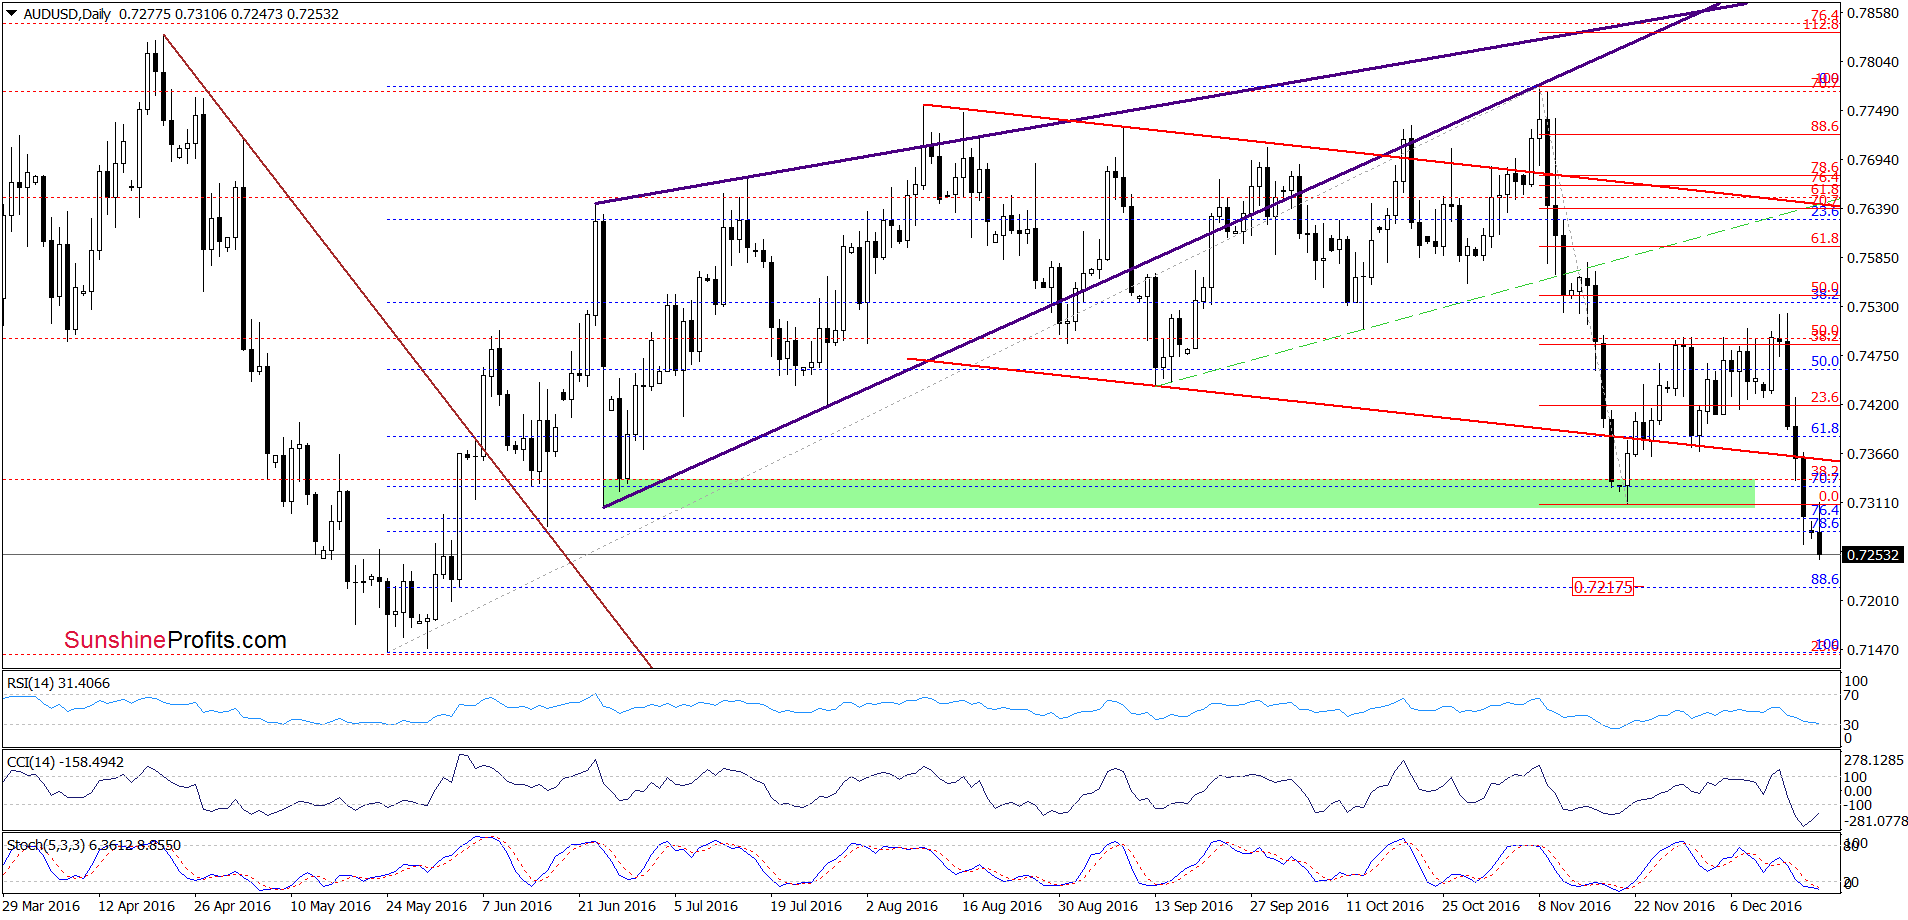
On the daily chart, we see that AUD/USD slipped below Friday’s low, which mean that our previous commentary on this currency pair is up-to-date also today:
(…) What’s next? Taking into account the fact that sell signals generated by the indicators remain in place, we may see a decline to around 0.7211, where the 61.8% Fibonacci retracement is (based on the Jan-Apr upward move and marked on the weekly chart) or even a test of the May lows (0.7143-0.7182) in the coming week.
Very short-term outlook: bearish
Short-term outlook: mixed
MT outlook: mixed
LT outlook: mixed
Trading position (short-term; our opinion): No positions are justified from the risk/reward perspective. We will keep you informed should anything change, or should we see a confirmation/invalidation of the above.
Thank you.
Nadia Simmons
Forex & Oil Trading Strategist
Przemyslaw Radomski, CFA
Founder, Editor-in-chief, Gold & Silver Fund Manager
Gold & Silver Trading Alerts
Forex Trading Alerts
Oil Investment Updates
Oil Trading Alerts

