

Earlier today, the USD Index extended gains and hit the barrier of 100. How did this increase affect the current picture of our six currency pairs?
In our opinion the following forex trading positions are justified - summary:
- EUR/USD: short (a stop-loss order at 1.1180; downside target at 1.0568)
- GBP/USD: none
- USD/JPY: none
- USD/CAD: none
- USD/CHF: long (a stop-loss order at 0.9664; upside target at 1.0237)
- AUD/USD: none
EUR/USD
On Thursday, we wrote the following:
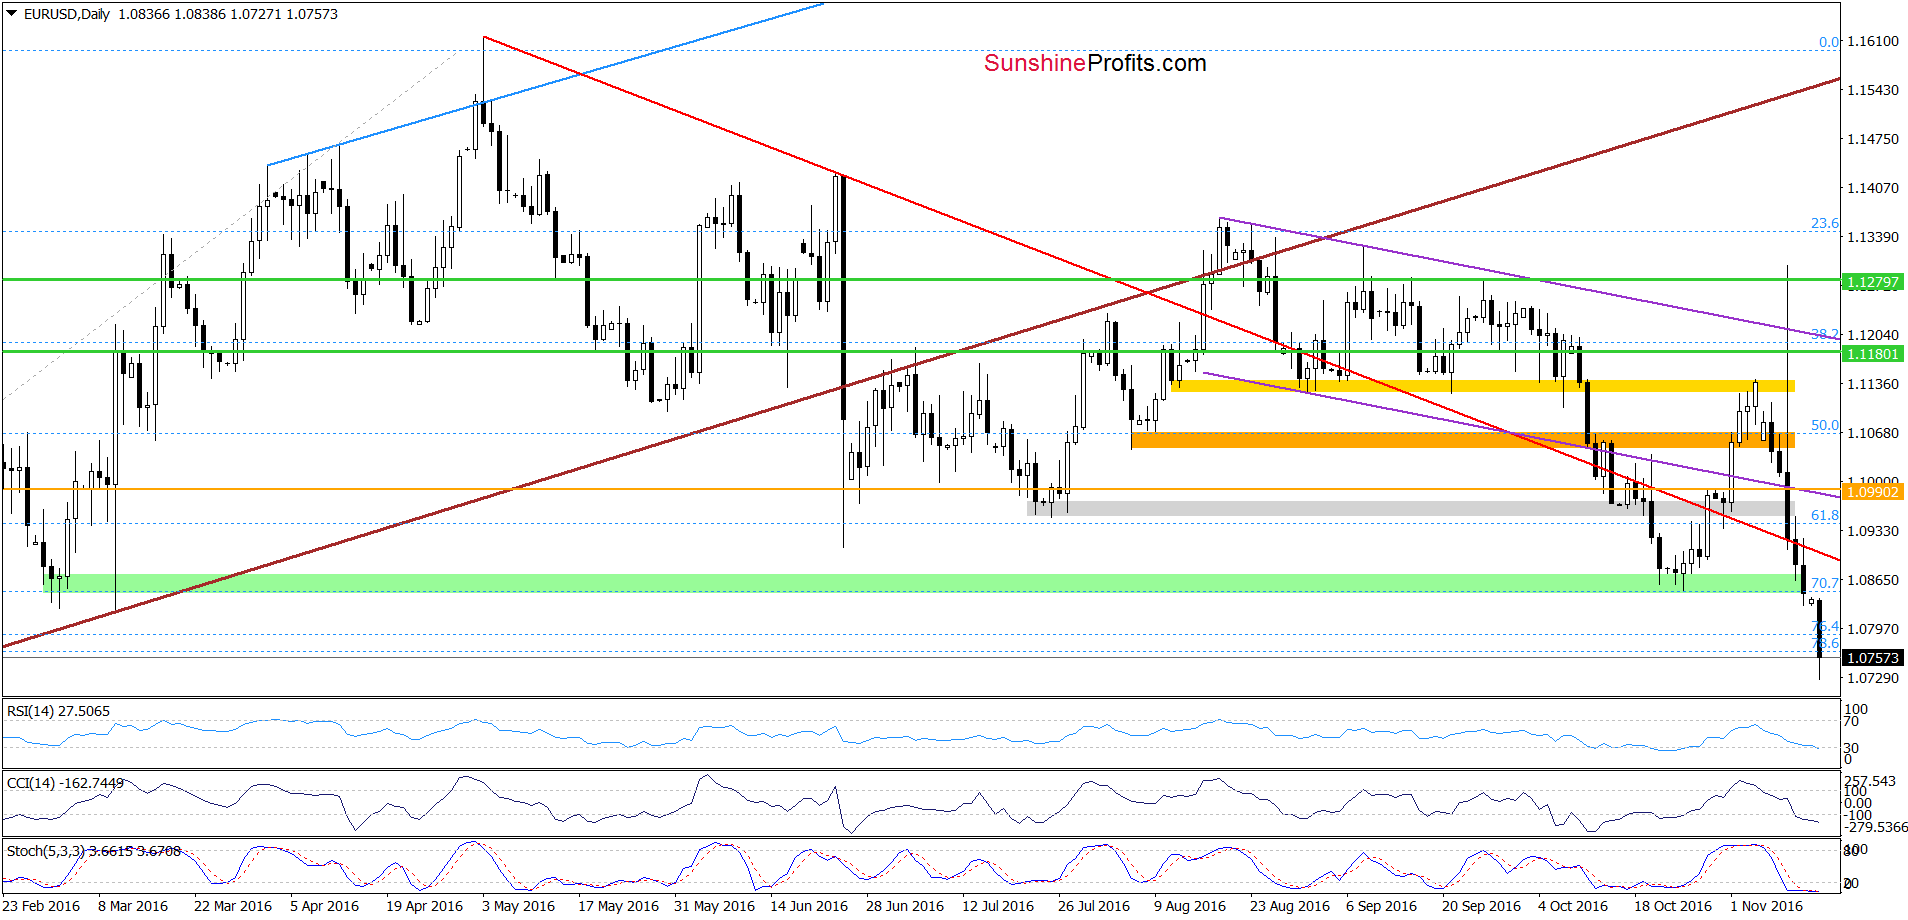
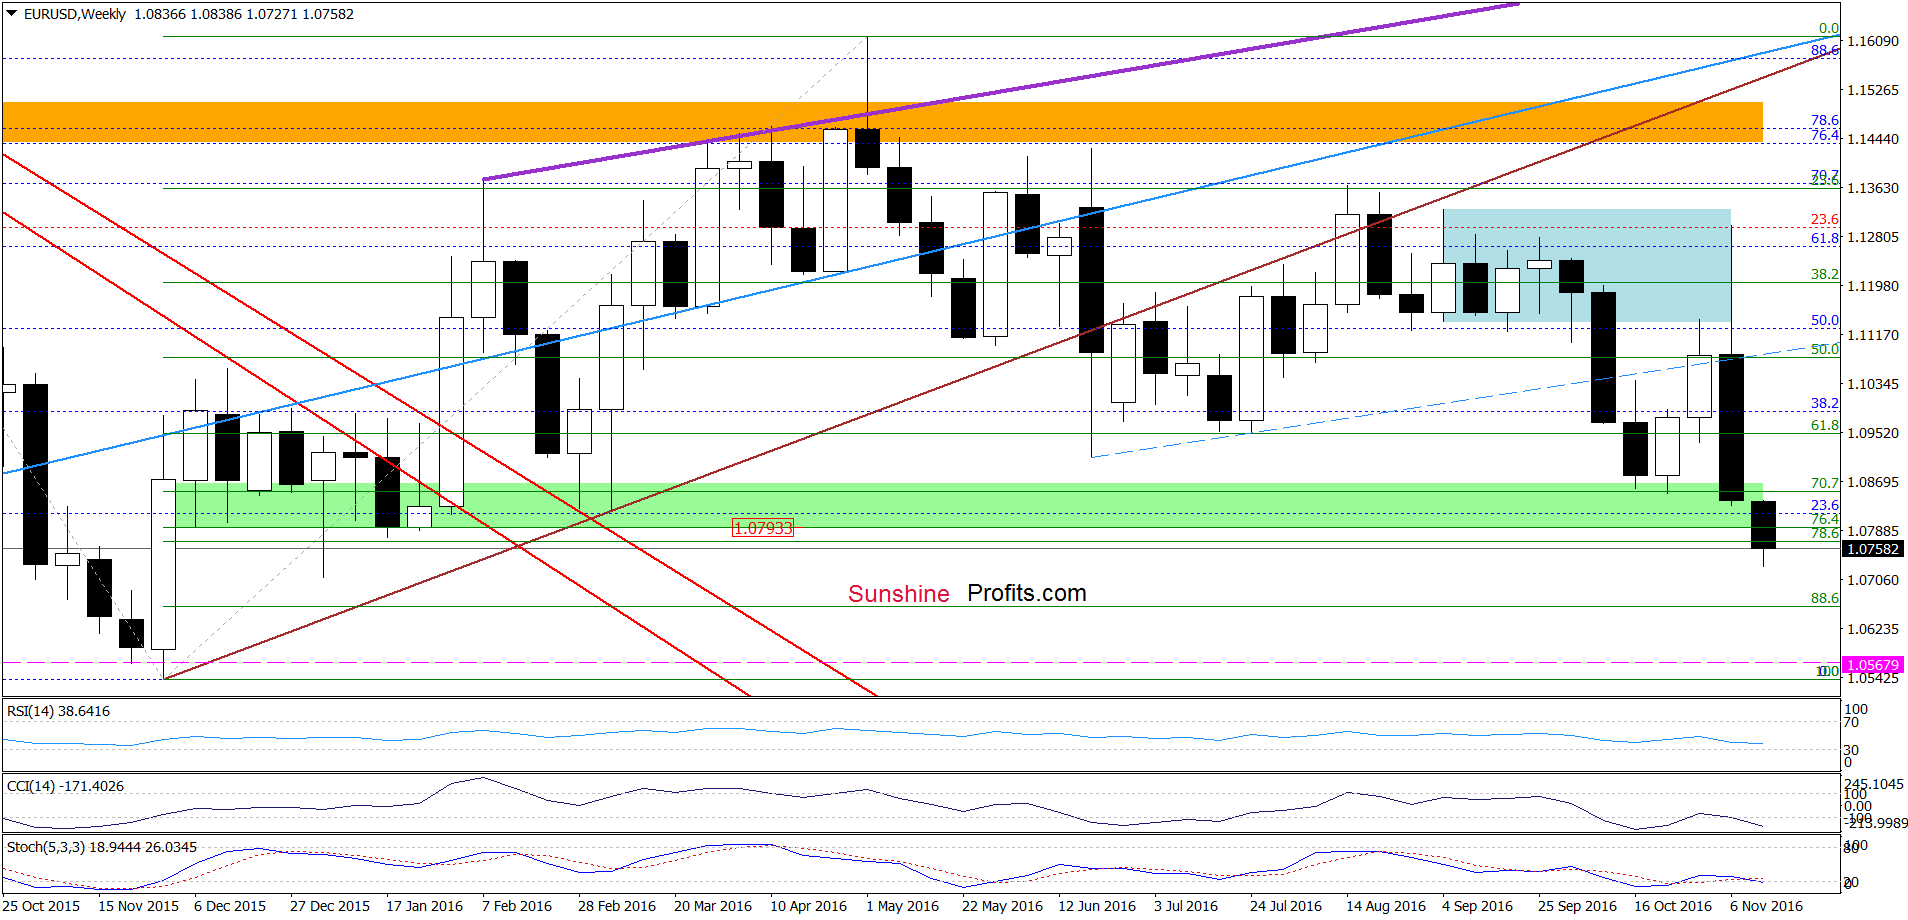
(…) currency bears pushed EUR/USD not only below the orange support zone, but also under the grey support zone and the red declining line, which resulted in a test of the green support zone based on the Oct lows. Although the exchange rate rebounded earlier today, sell signals generated by the indicators remain in place suggesting further deterioration. Therefore, if the pair moves lower from current levels, we’ll likely see a test of the lower border of the green support zone marked on the weekly chart (around 1.0793) in the coming day(s).
Looking at the charts from today’s point of view we see that the situation developed in line with the above scenario and EUR/USD not only slipped to our Friday’s target, but also declined below it earlier today, which is a negative signal that suggests further deterioration and a test of the 88.6% Fibonacci retracement in the coming day(s).
Very short-term outlook: bearish
Short-term outlook: mixed with bearish bias
MT outlook: mixed
LT outlook: mixed
Trading position (short-term; our opinion): Short (already profitable) positions are justified from the risk/reward perspective. We will keep you informed should anything change, or should we see a confirmation/invalidation of the above.
GBP/USD
Quoting our Thursday’s alert:
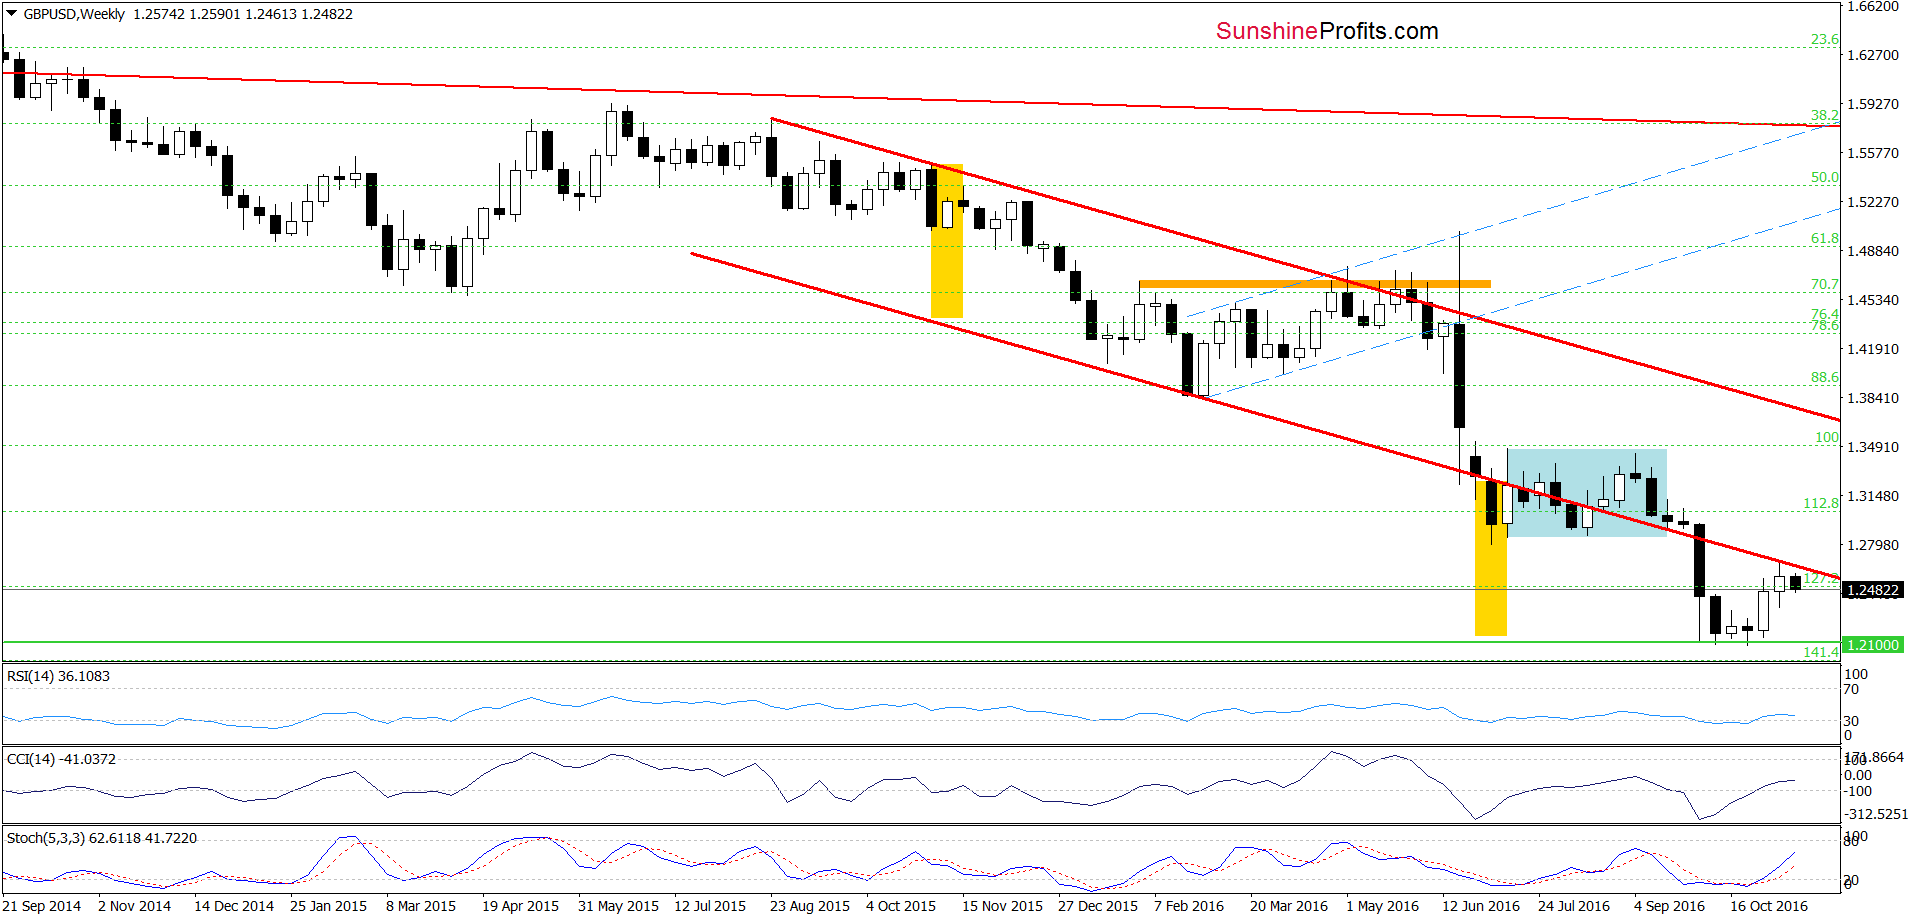
Although GBP/USD moved lower yesterday, currency bulls stopped further deterioration, which resulted in a small rebound earlier today. Such price action looks like a verification of earlier breakout above the lower purple line, which suggests further improvement. If this is the case and the exchange rate increases from here, we’ll see (…) an upward move to around 1.2602, where the 38.2% Fibonacci retracement (based on the Sep-Oct downward move) is. Additionally, slightly above this level (around 1.2634) the size of the upswing would correspond to the height of the formation, which could encourage currency bears to act.
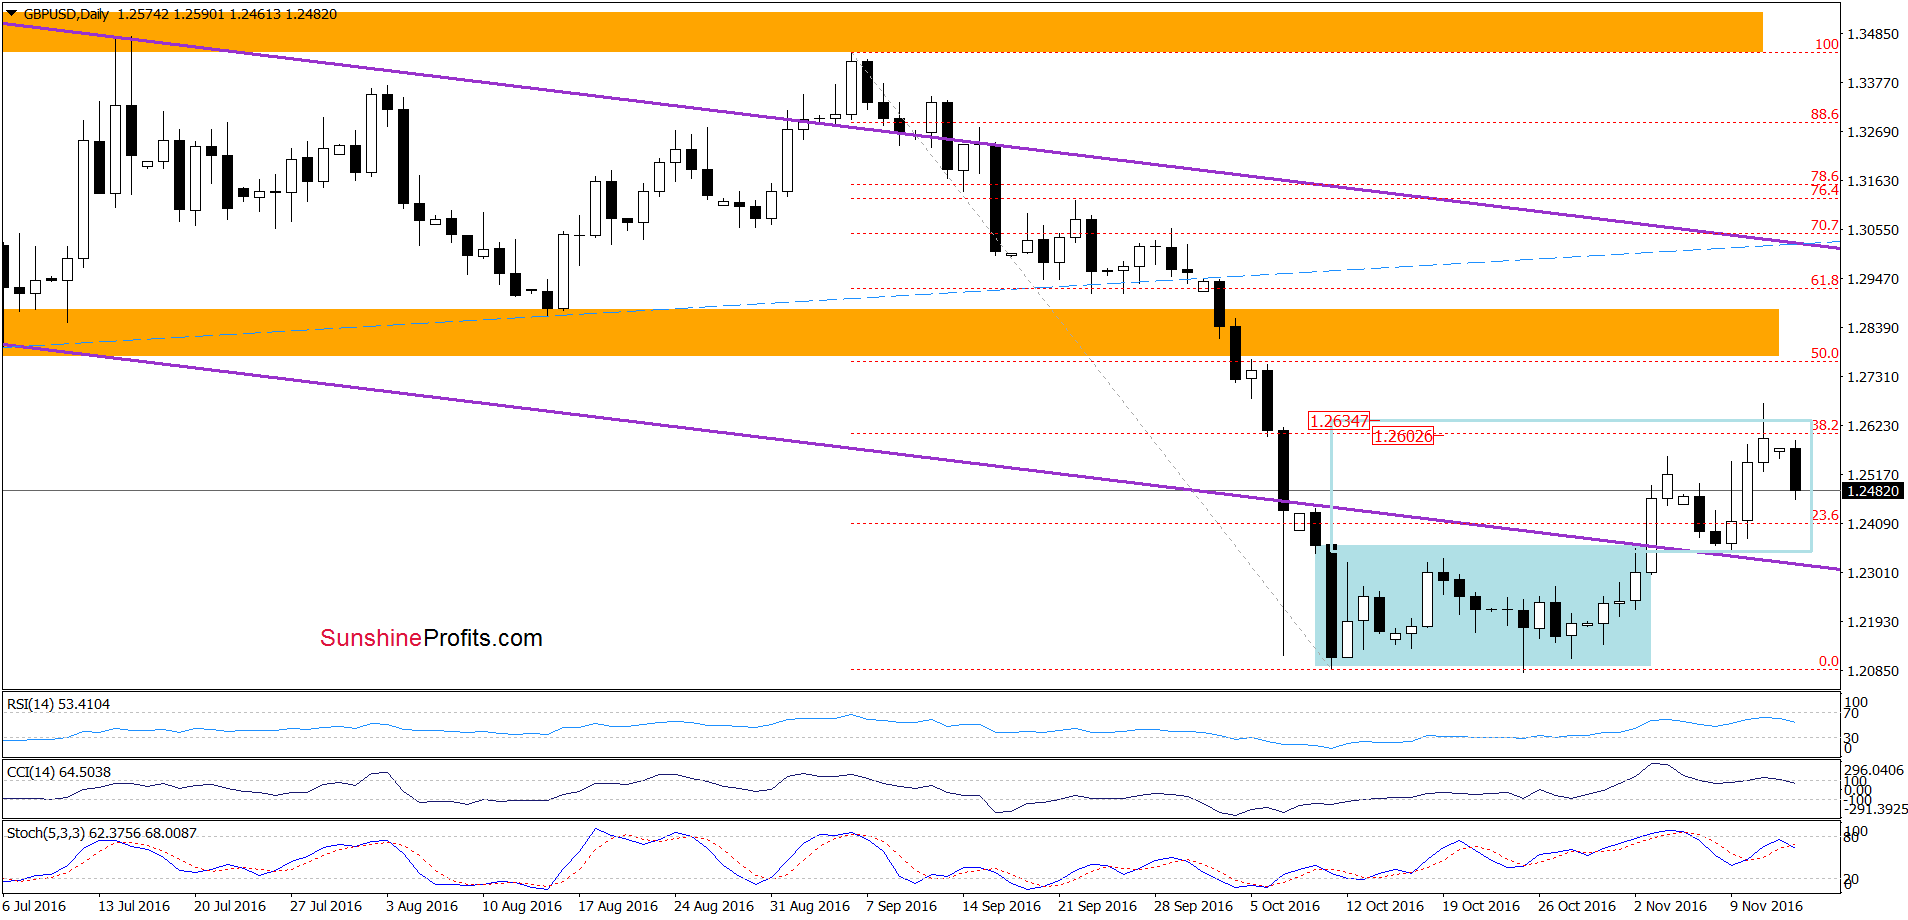
On the daily chart, we see that currency bulls pushed GBP/USD higher as we had expected. With this increase the exchange rate not only reached our upside targets, but also climbed to the previously-broken lower border of the red declining trend channel (marked on the weekly chart). Taking these facts into account and combining them with the current position of the daily indicators (the RSI reversed, the CCI generated a sell signal, while the Stochastic Oscillator is very close to doing the same), we think that lower values of GBP/USD are very likely in the coming days. Therefore, if the pair declines from here, the initial downside target would be the previously-broken upper border of the blue consolidation and the lower border of the purple declining trend channel (marked on the daily chart) around 1.2315-1.2365.
Very short-term outlook: bearish
Short-term outlook: mixed
MT outlook: mixed
LT outlook: bearish
Trading position (short-term; our opinion): No positions are justified from the risk/reward perspective. We will keep you informed should anything change, or should we see a confirmation/invalidation of the above.
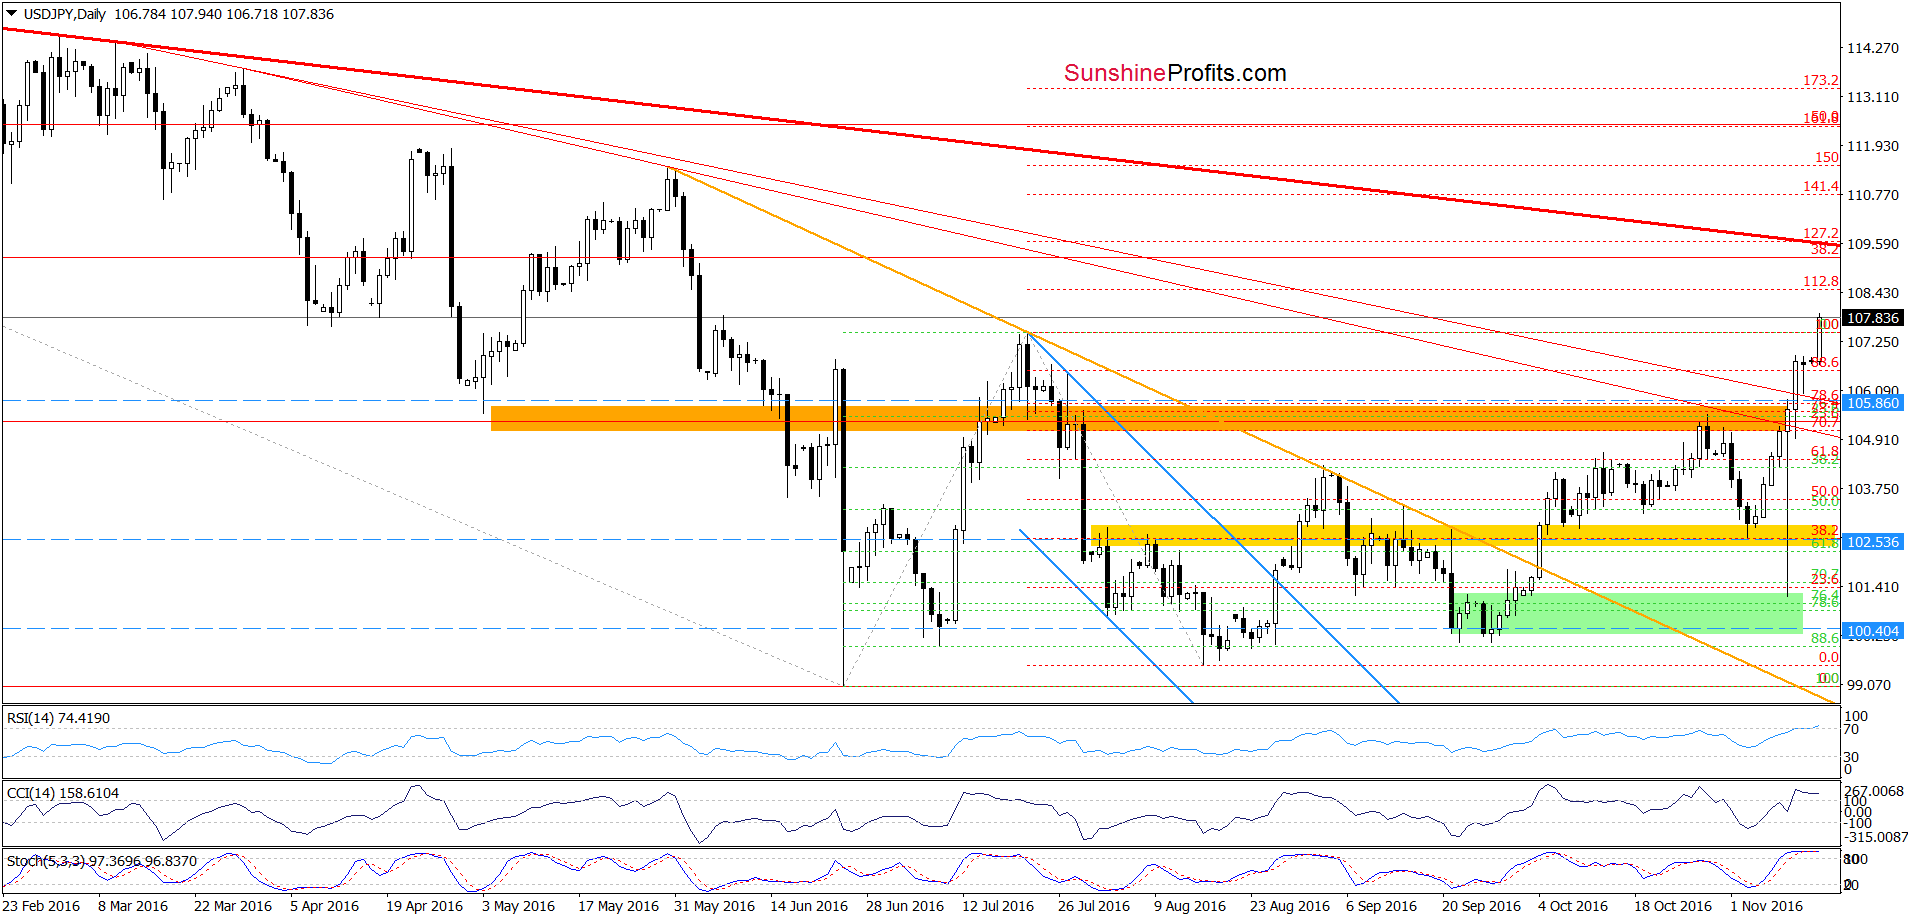
USD/JPY
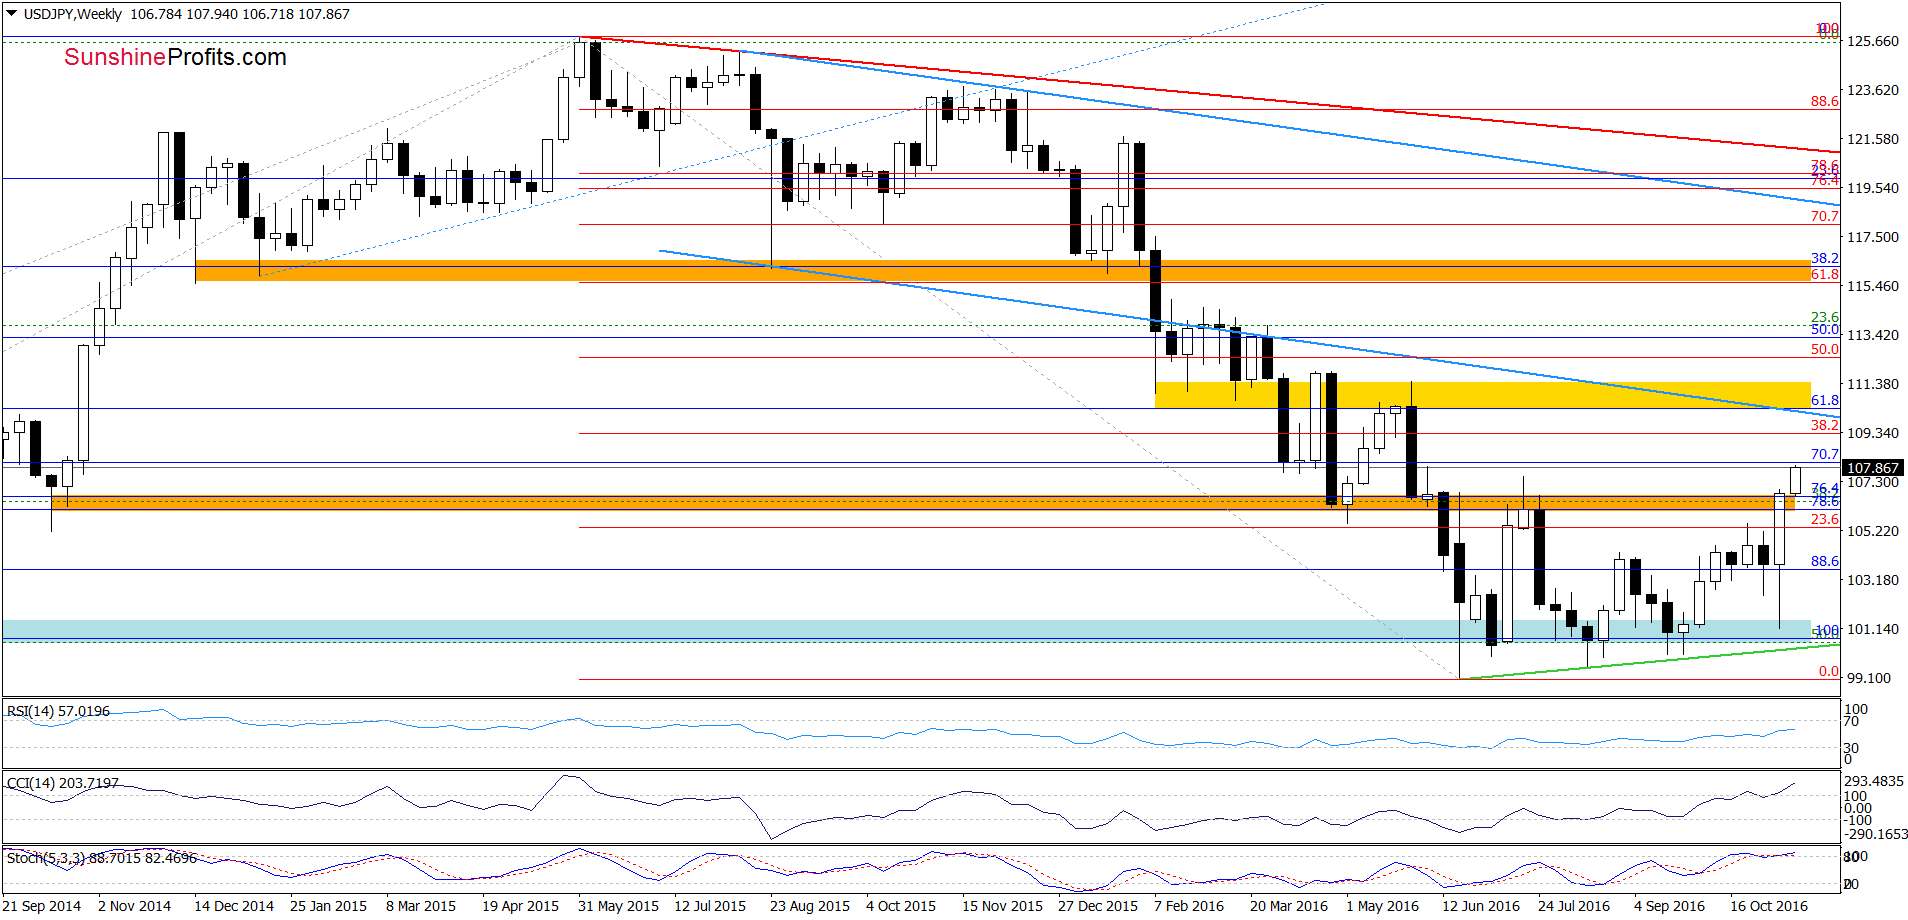
A week ago, we wrote:
(…) the current position of the indicators suggests that another attempt to move higher is very likely. If this is the case and the exchange rate climbs above the red area, the next upside target would be the Oct high and the orange resistance zone.
On the above charts, we see that currency bulls not only took the exchange rate to this upside target, but also pushed USD/JPY above it. With this upward move, the pair also climbed above the red resistance line (based on the March highs) and the Jul high, which suggests that we may see a rally even to the red bold resistance line (based on the Feb and March highs) around 109.55 in the coming week (this area is also reinforced by the 127.2% Fibonacci extension based on the Jul-Aug downward move and the 38.2% Fibonacci retracement based on the entire 2015-016 downward move, which increases the probability of reversal in this zone). Nevertheless, such price action would be more reliable if USD/JPY closes today’s session above the Jul highs.
Very short-term outlook: mixed with bullish bias
Short-term outlook: mixed with billish bias
MT outlook: mixed
LT outlook: mixed
Trading position (short-term; our opinion): No positions are justified from the risk/reward perspective. We will keep you informed should anything change, or should we see a confirmation/invalidation of the above.
USD/CAD
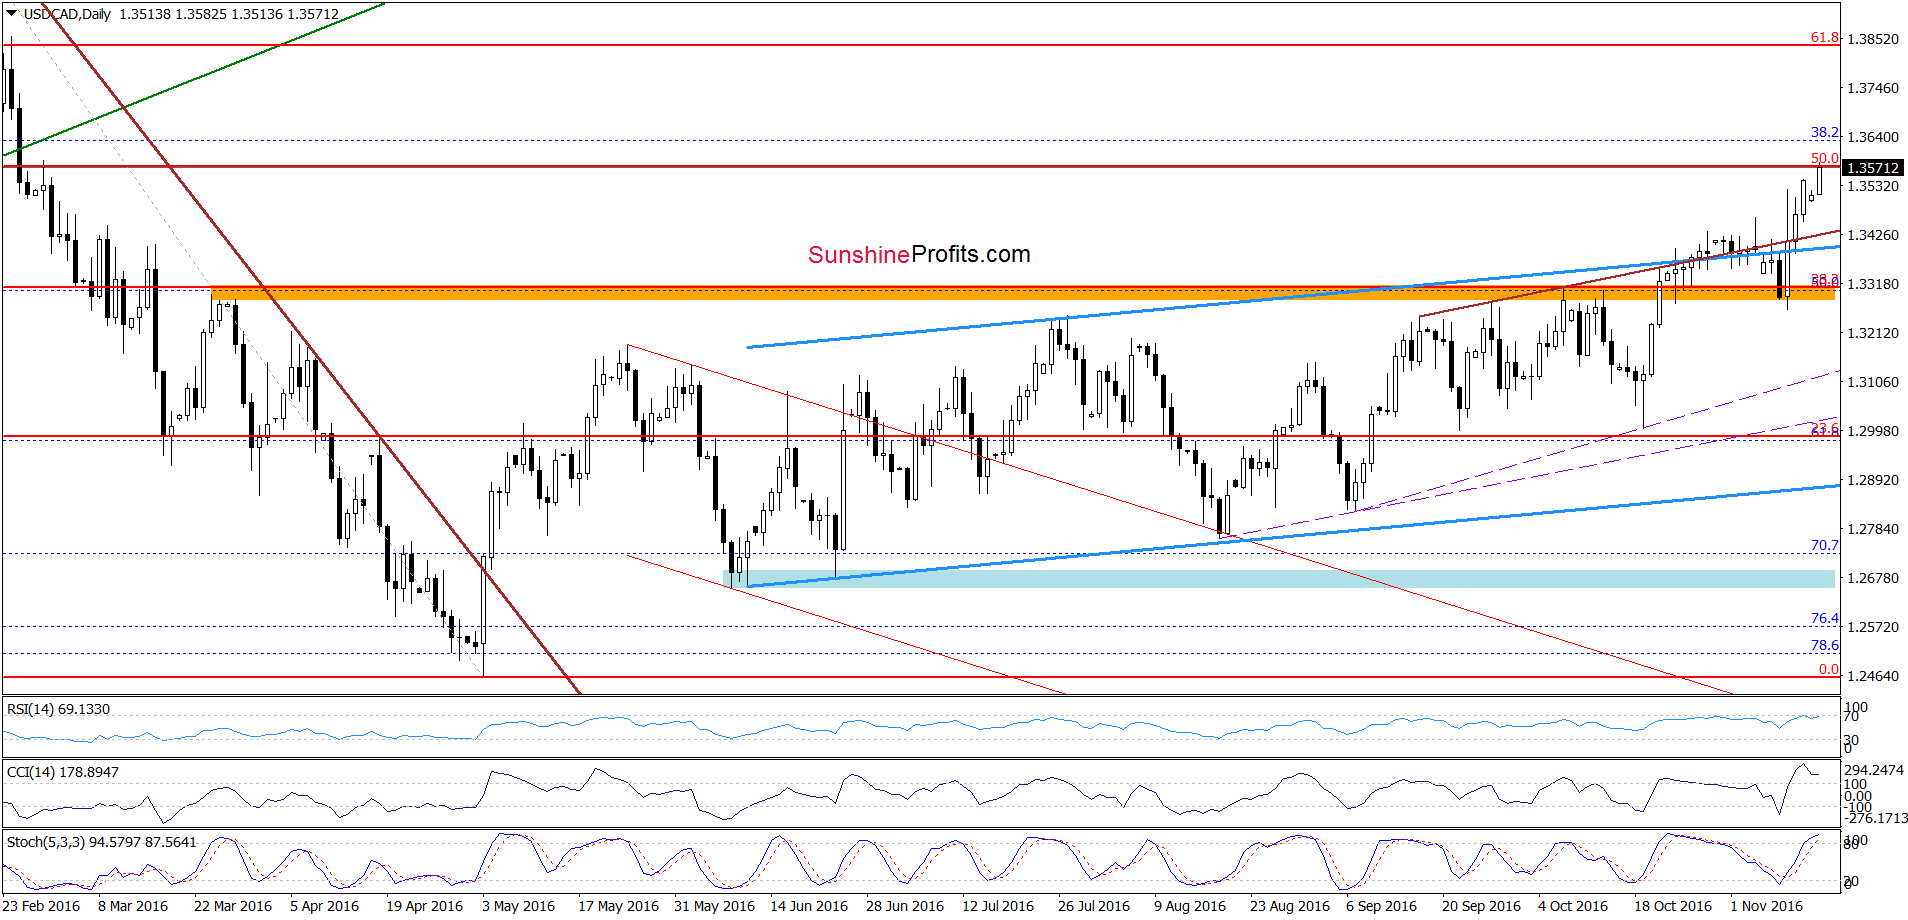
Looking at the daily chart, we see that after several unsuccessful attempts to move higher, currency bulls finally broke above the upper border of the purple rising wedge and the upper line of the blue rising trend channel, which triggered further improvement. As a result, the exchange rate climbed to the 50% Fibonacci retracement (based on the entire Jan-May downward move) earlier today, which could pause further rally and trigger a pullback in the coming days. Nevertheless, as long as there won’t be sell signals generated by the indicators another attempt to move higher is likely.
How high could USD/CAD go in the coming week(s)? Let’s take a closer look at the weekly chard and find out.
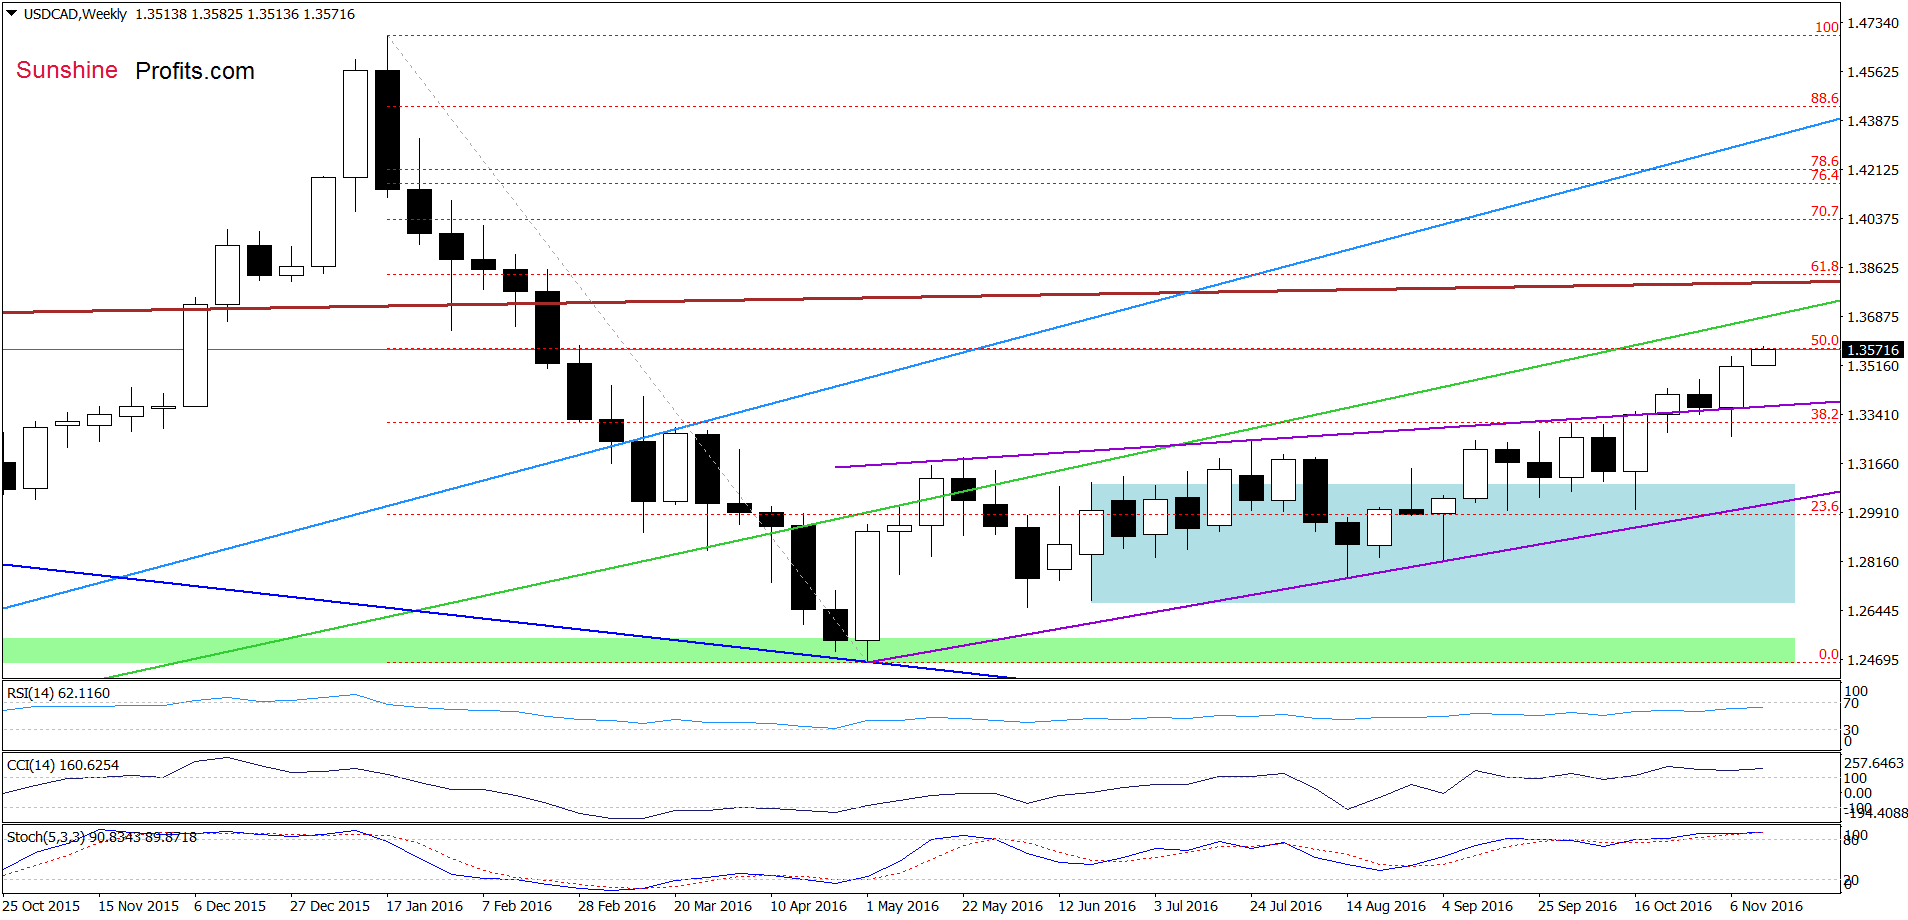
From this perspective, we see that if USD/CAD extends gains from here, the initial upside target would be the long-term green line, which serves as the nearest resistance. If it is broken, currency bulls will likely try to push the exchange rate to the 61.8% Fibonacci retracement (around 1.3835) in the coming week(s).
Very short-term outlook: mixed with bullish bias
Short-term outlook: mixed
MT outlook: mixed
LT outlook: mixed
Trading position (short-term; our opinion): No positions are justified from the risk/reward perspective. We will keep you informed should anything change, or should we see a confirmation/invalidation of the above.
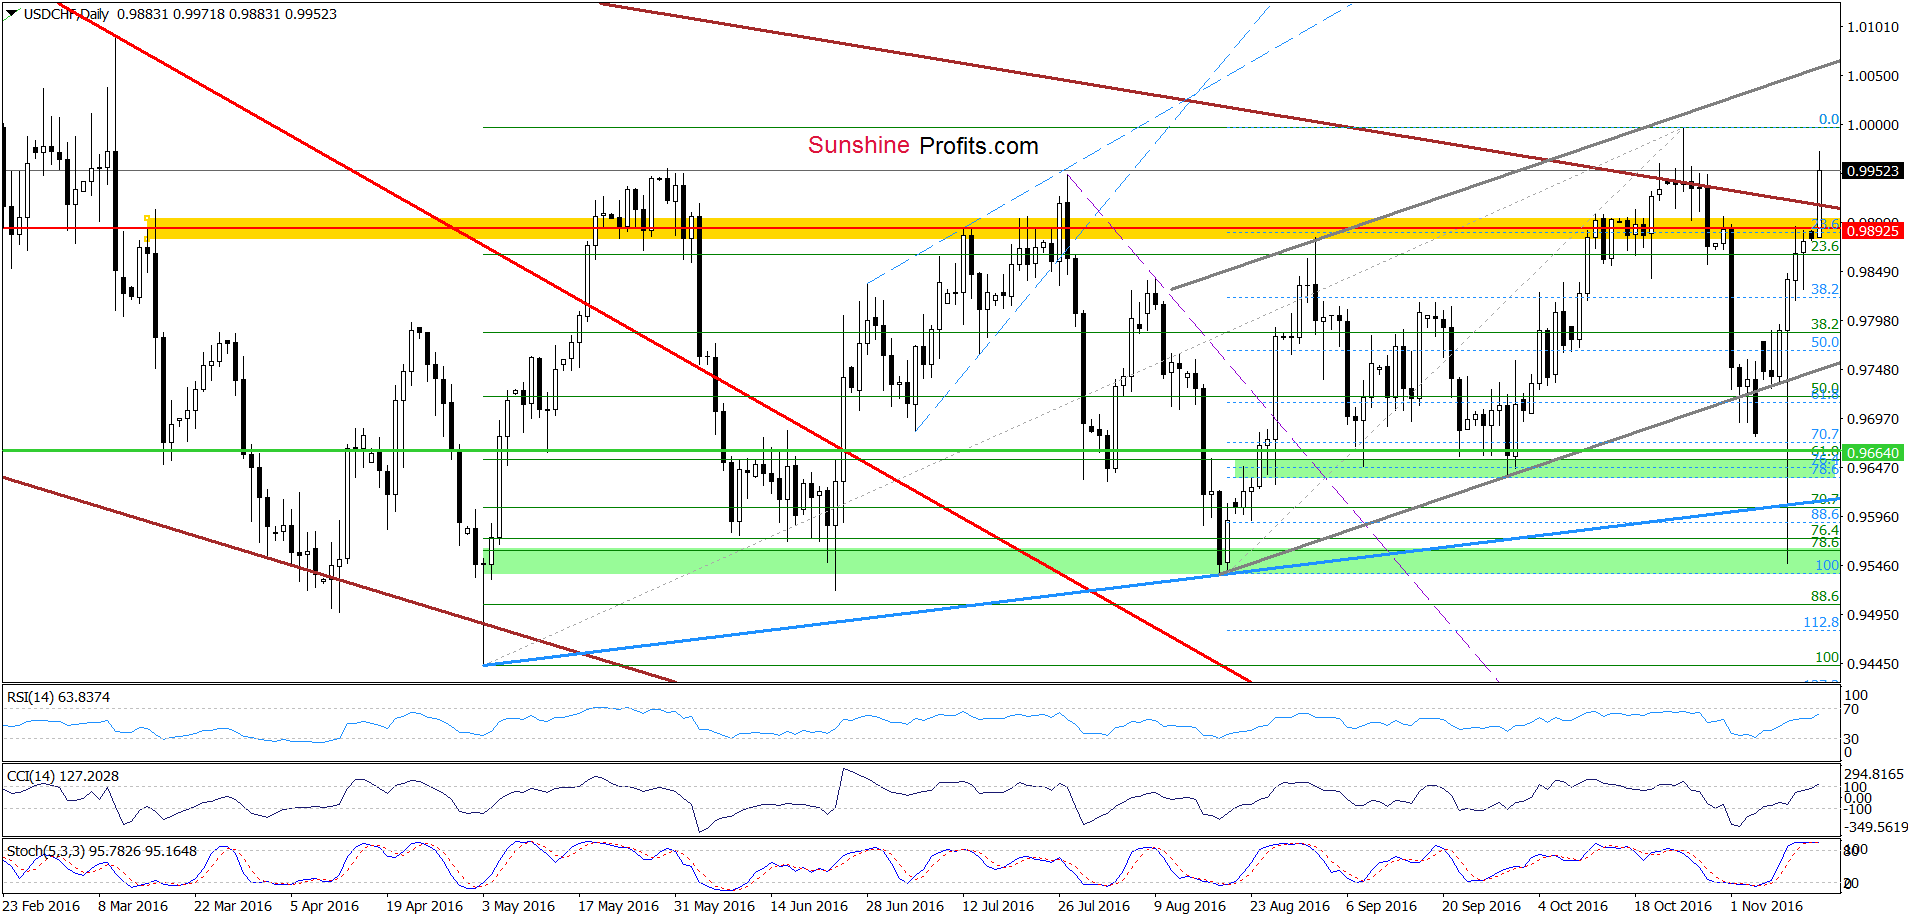
USD/CHF
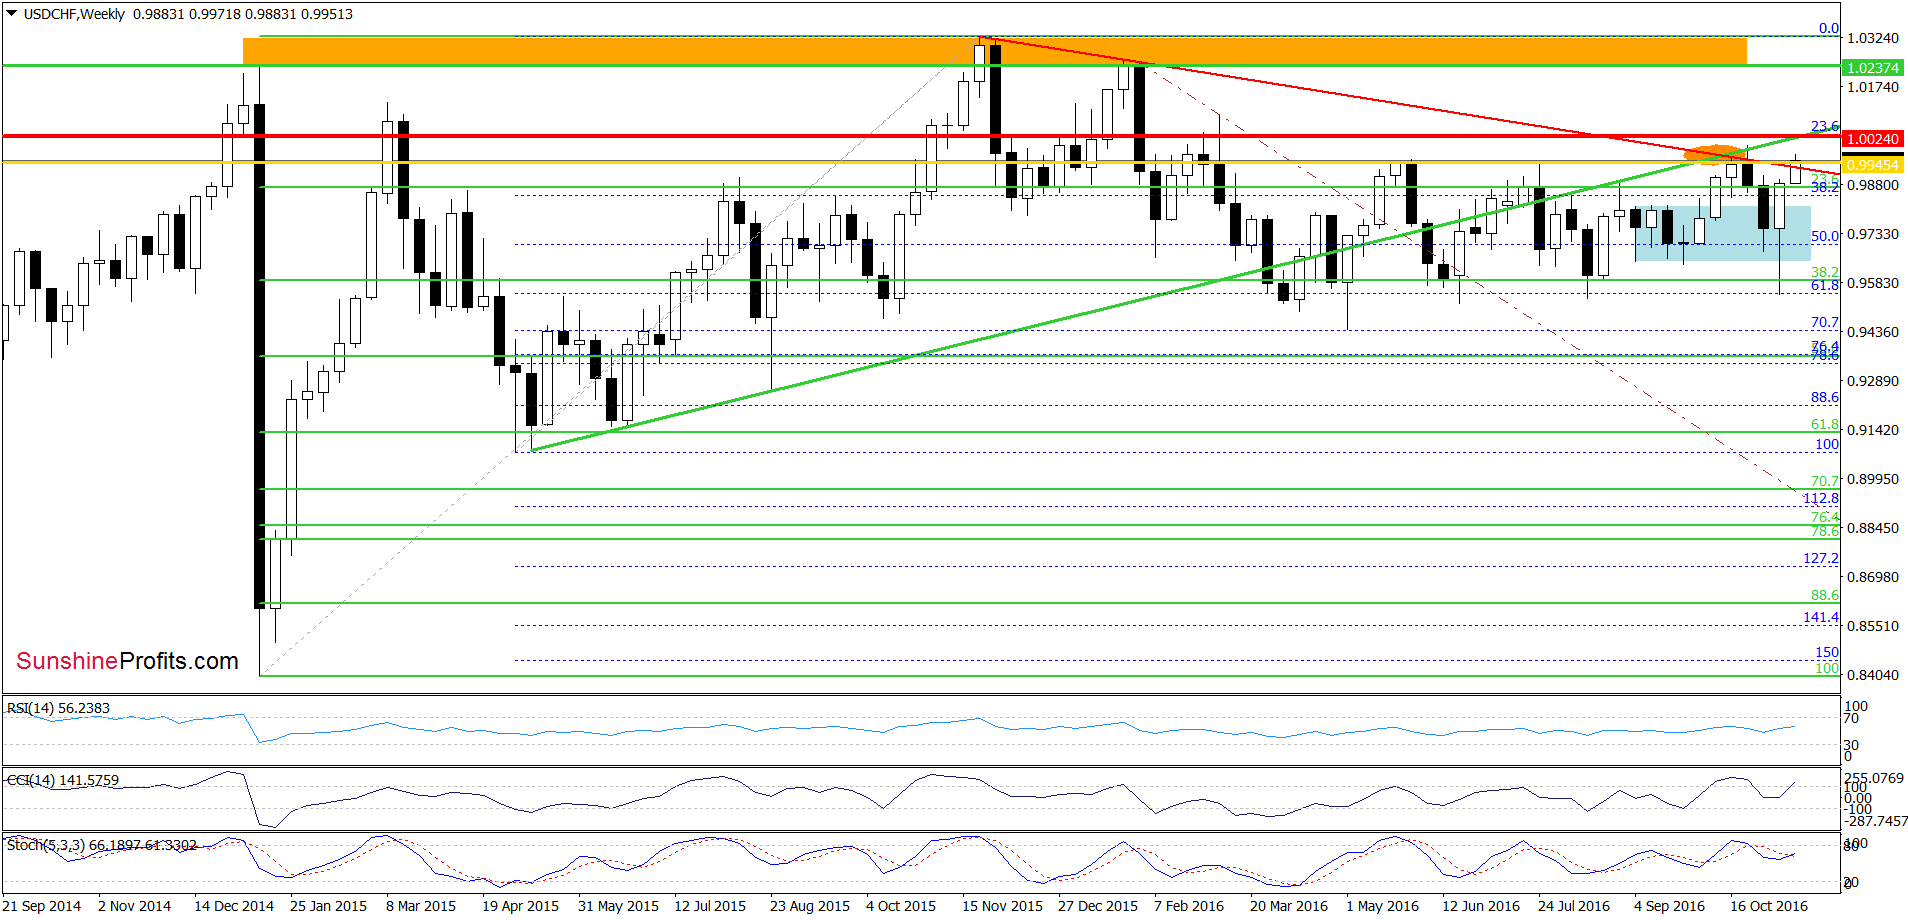
Quoting our previous commentary on this currency pair:
(…) although USD/CHF broke below the lower border of the blue consolidation, this deterioration was very quickly erased, which is a bullish signal (an invalidation of the breakdown) that suggests further improvement.
As you see, the situation developed in tune with our assumptions. How did this increase affect the very short-term picture? Let’s check.
On Thursday, we wrote the following:
(…) the green support zone created by the 76.4% and 78.6% Fibonacci retracements and the Aug lows successfully stopped further deterioration and triggered a very sharp rebound, which took the exchange rate to the previous levels. In this way, the pair invalidated earlier breakdown under the green line (once again), which in combination with buy signals generated by the indicators suggests further improvement in the coming days. (…) If we see such price action, USD/CHF will (at least) re-test the yellow resistance zone in the coming days.
Looking on the daily chart, we see that USD/CHF broke not only above the yellow resistance zone (as we had expected), but also moved above the red declining resistance line based on the Nov 2015 and Jan 2016 highs, which is a positive signal that suggests further improvement and a test of the Oct high. If it is broken, we may see a rally to around 1.0020 (the previously-broken green line marked on the weekly chart, which serves now as the nearest resistance) or even to 1.0056, where the upper border of the grey rising trend channel (seen on the daily chart) currently is.
Very short-term outlook: bullish
Short-term outlook: mixed with bullish bias
MT outlook: mixed
LT outlook: mixed
Trading position (short-term; our opinion): Long (already profitable) positions are justified from the risk/reward perspective. We will keep you informed should anything change, or should we see a confirmation/invalidation of the above.
AUD/USD
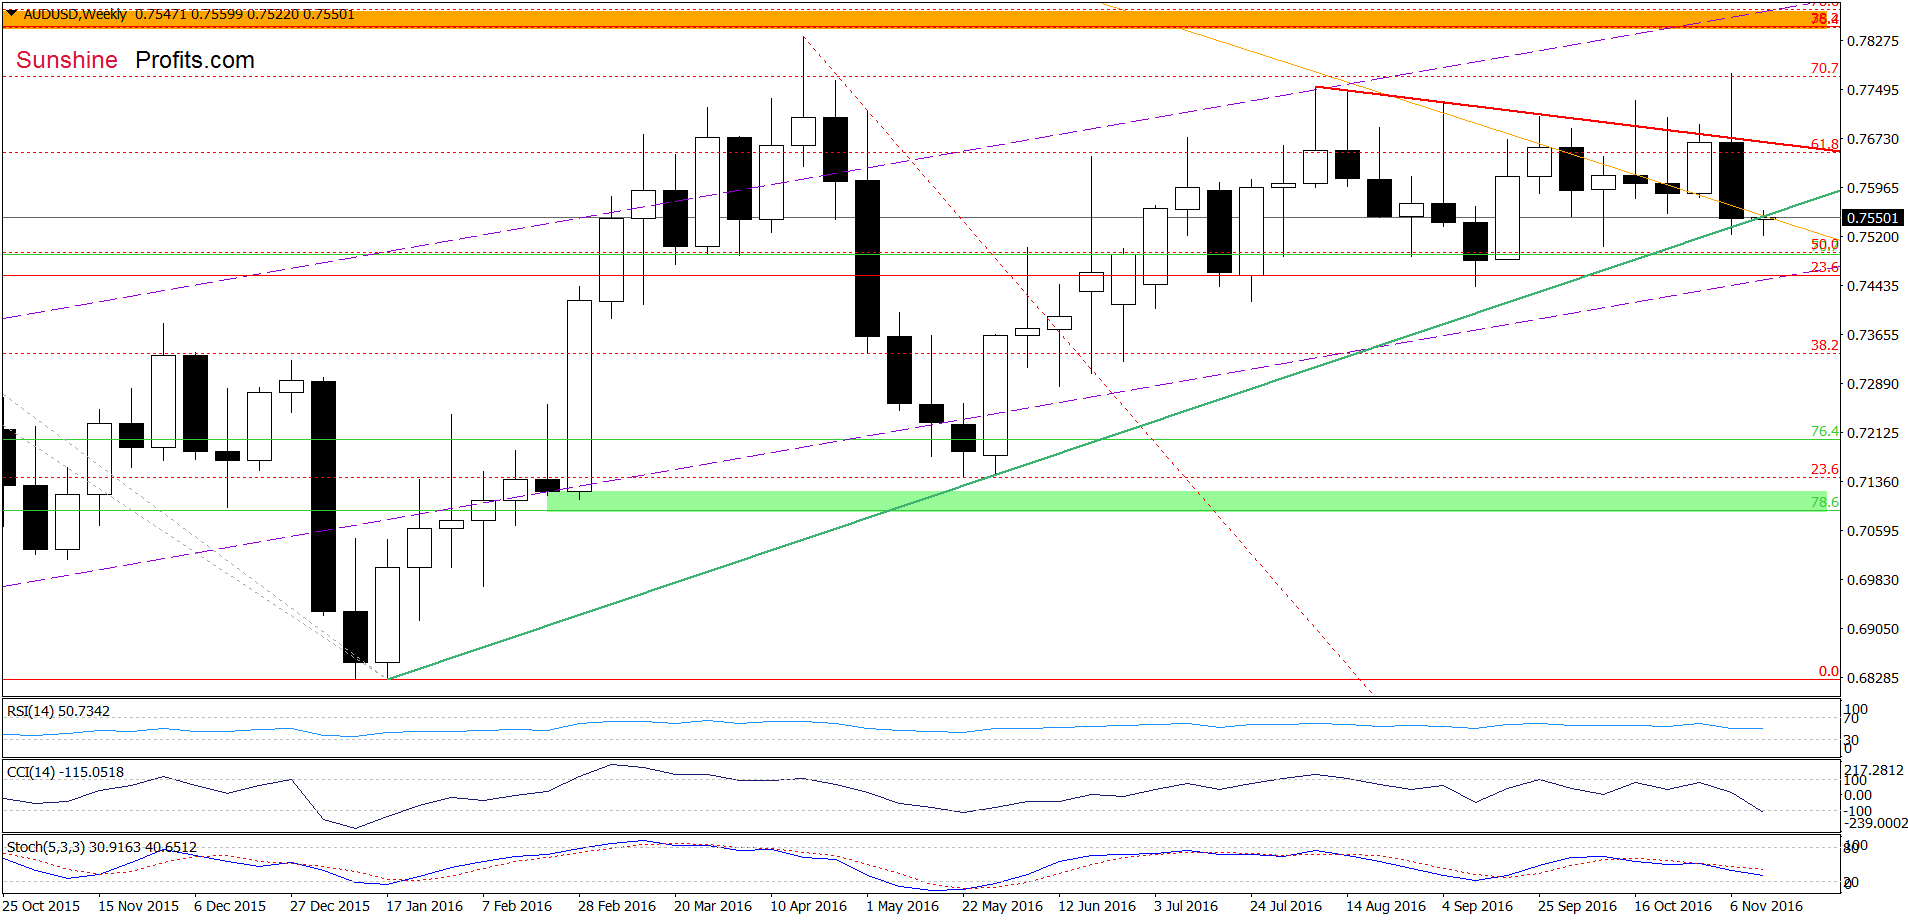
On the weekly chart, we see tat invalidation of the breakout above the red declining resistance line triggered a sharp decline in the previous week, which took AUD/USD slightly below the green support line. Will currency bulls manage to invaliate this small breakdown and push the exchange rate higher? Let’s examine the daily chart and look for more clues about future moves.
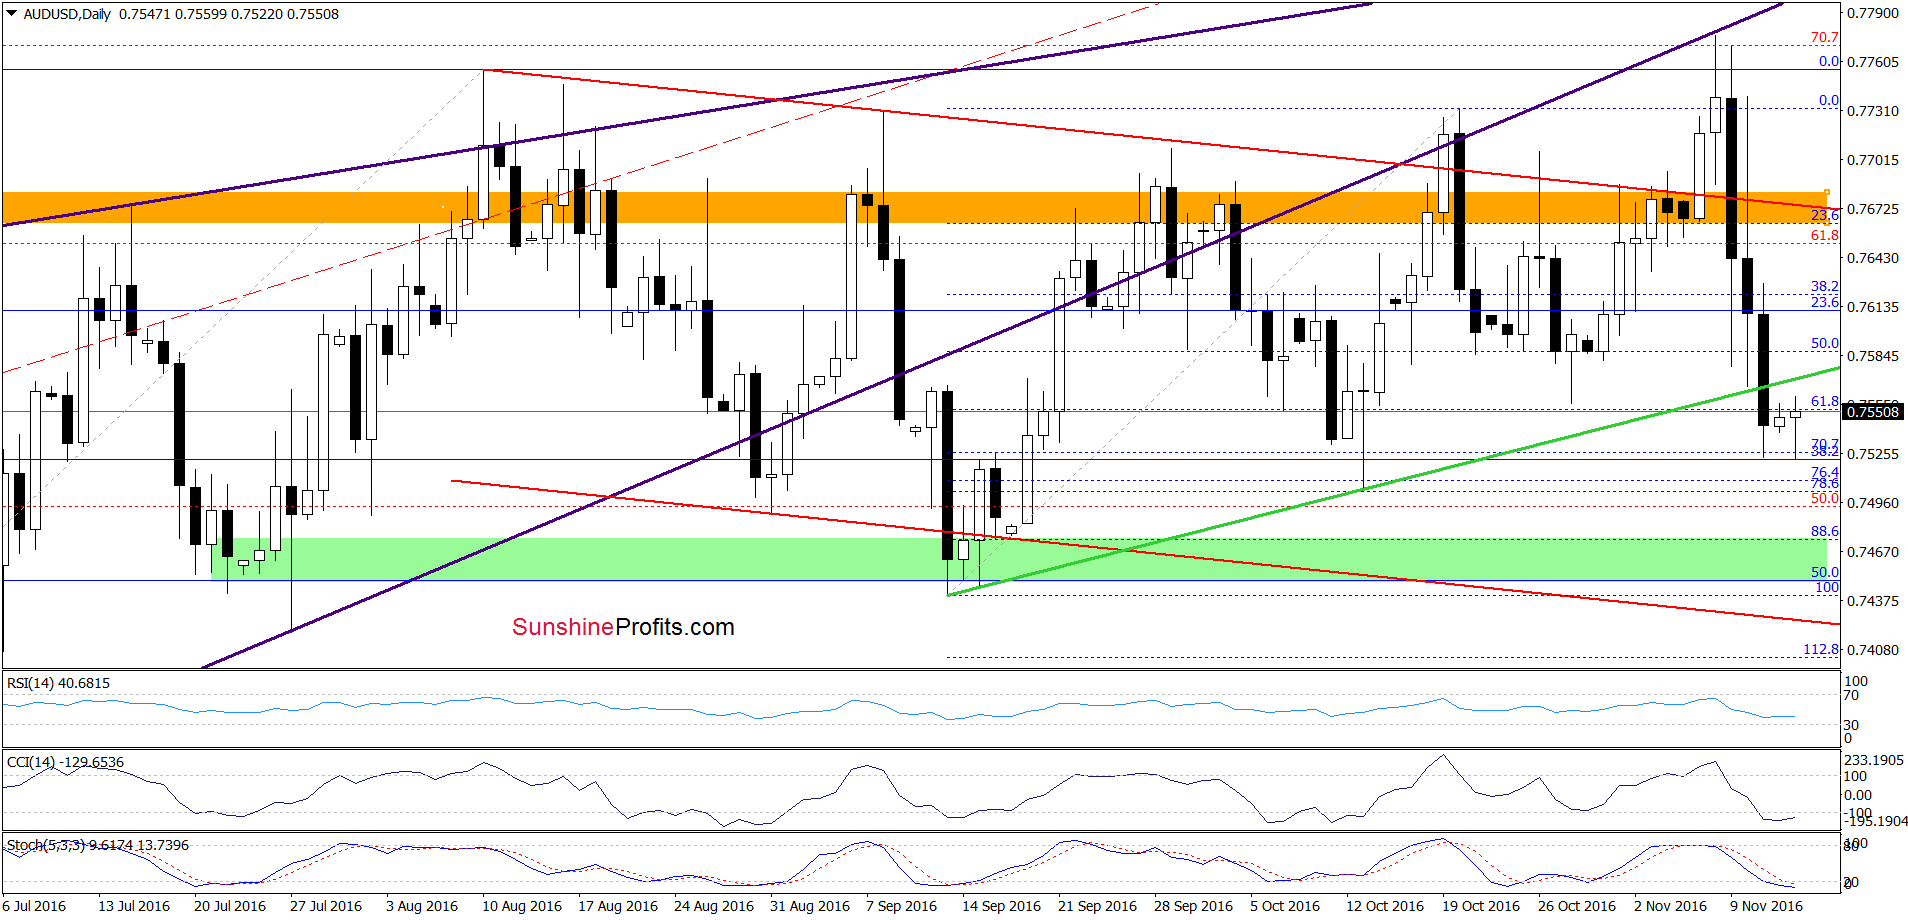
Looking at the weekly chart, we see that the recent sharp downward move took the pair not only under the green line based on the Jan and May lows, but also below the green support line based on the previous lows, which doesn’t bode well for AUD/USD. Additionally, sell signals generated by the indicators remain in place, supporting currency bears and further deterioration. Therefore, if the pair declines from here, the initial downside target would be around 0.7474, where the 88.6% Fibonacci retracement (based on the recent upward move) and the green support zone are.
Very short-term outlook: bearish
Short-term outlook: mixed with bearish bias
MT outlook: mixed
LT outlook: mixed
Trading position (short-term; our opinion): None positions are justified from the risk/reward perspective. We will keep you informed should anything change, or should we see a confirmation/invalidation of the above.
Thank you.
Nadia Simmons
Forex & Oil Trading Strategist
Przemyslaw Radomski, CFA
Founder, Editor-in-chief, Gold & Silver Fund Manager
Gold & Silver Trading Alerts
Forex Trading Alerts
Oil Investment Updates
Oil Trading Alerts

