

Although the Labor Department showed on Friday that the U.S. economy added 215,000 jobs in the previous month (beating analysts’ expectations), the greenback remains under pressure after Janet Yellen’s comments Thanks to these circumstances, the USD Index came back under the level of 95 and re-approached the last week’s low. How did this move affect our six currency pairs?
In our opinion the following forex trading positions are justified - summary:
- EUR/USD: short (stop-loss order at 1.1512; initial downside target at 1.0572)
- GBP/USD: none
- USD/JPY: none
- USD/CAD: none
- USD/CHF: none
- AUD/USD: none
EUR/USD
Quoting our last alert:
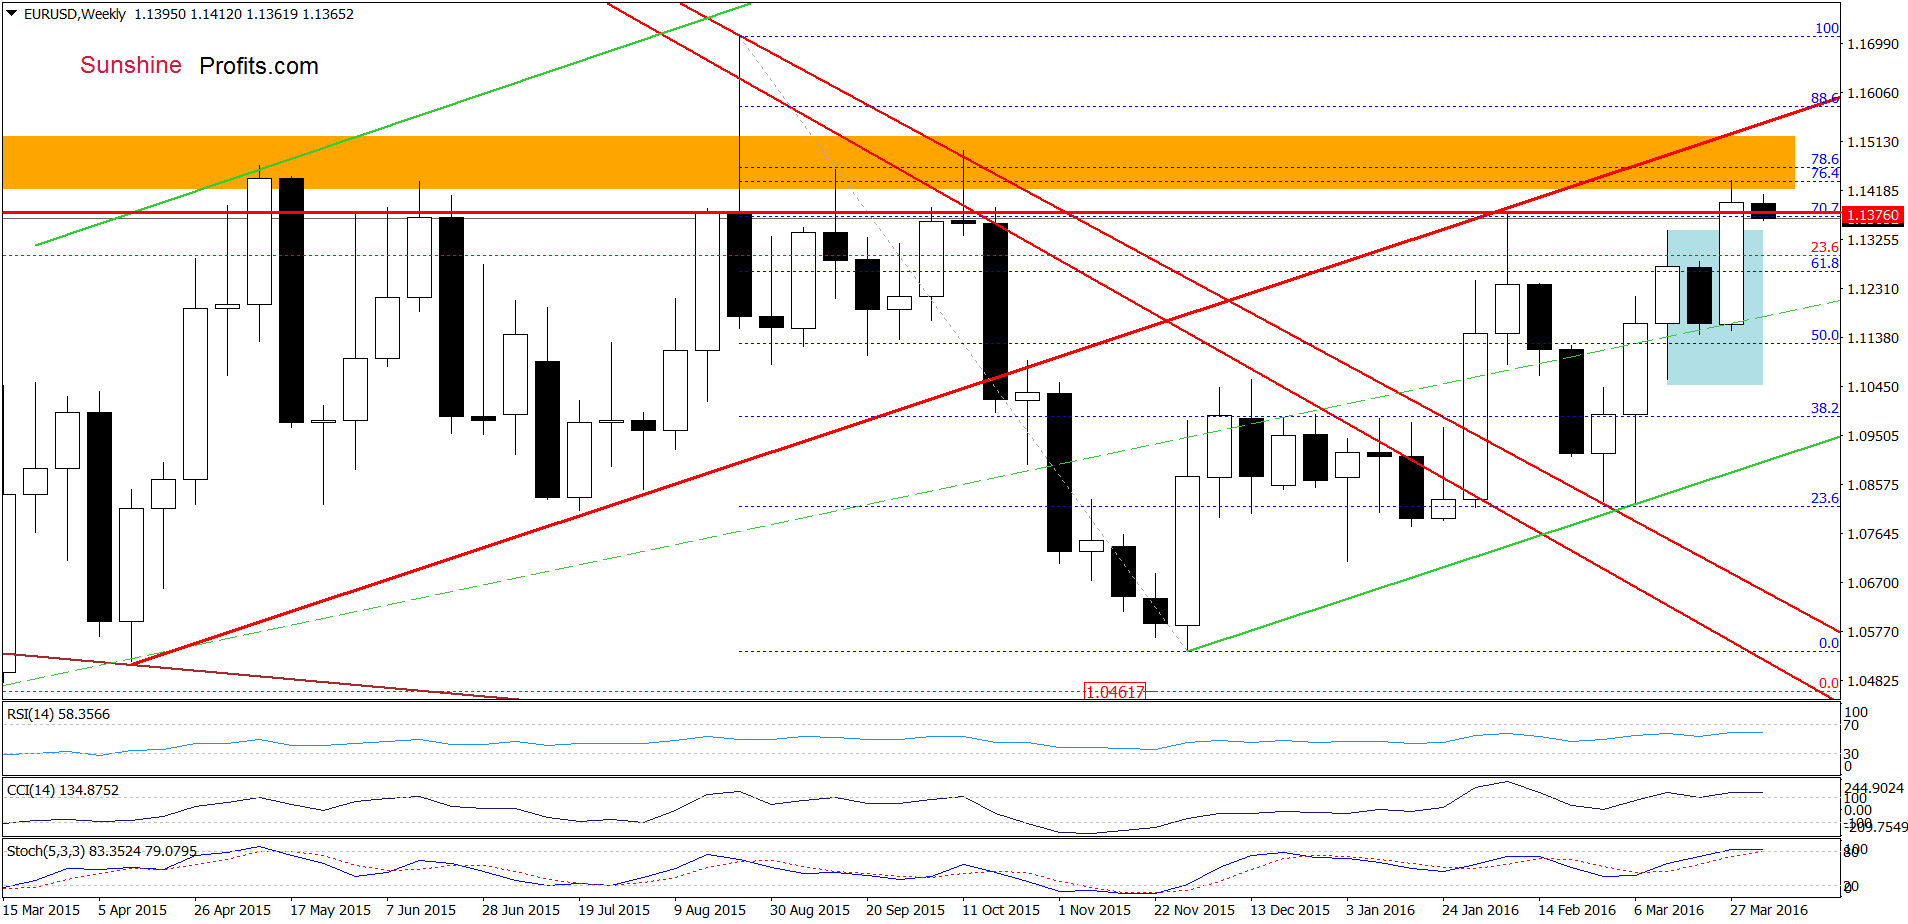
(…) although EUR/USD moved little higher, the key orange resistance zone (which successfully stopped currency bulls several times in the past) continues to keep gains in check. Therefore, in our opinion, as long as the pair is trading below it another reversal from here and lower values of the exchange rate are very likely.
As you see on the weekly chart, the situation developed in line with the above scenario and the exchange rate moved lower earlier today. What impact did this move have on the very short-term chart? Let’s check.
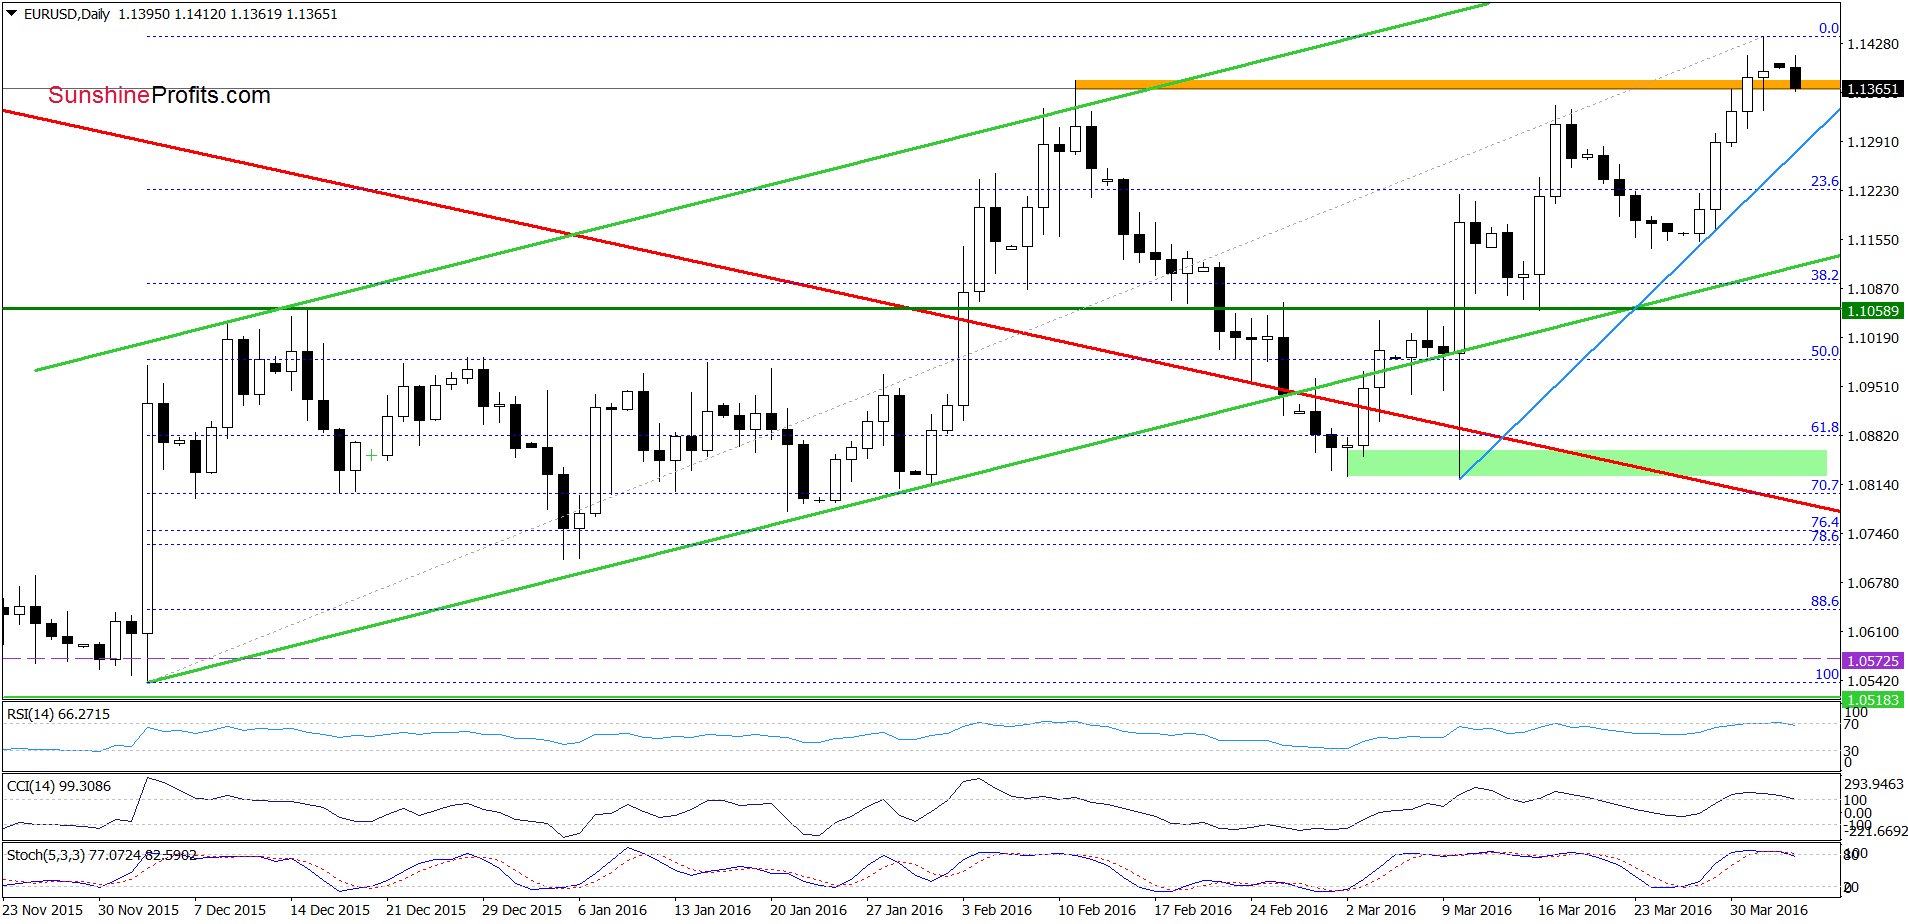
On the above charts, we see that EUR/USD moved lower earlier today and slipped under the previously-broken Feb high. Although this is a negative signal (an invalidation of the breakout), we think that it would be more reliable if we see a daily closure below the orange area. Finishing today’s commentary on this currency pair, it is worth noting that all indicators are overbought and very close to generating sell signals ,which suggests that further deterioration is just around the corner.
Very short-term outlook: bearish
Short-term outlook: bearish
MT outlook: mixed with bearish bias
LT outlook: mixed
Trading position (short-term; our opinion): Short positions (with a stop-loss order at 1.1512 and the initial downside target at 1.0572) are justified from the risk/reward perspective. We will keep you informed should anything change, or should we see a confirmation/invalidation of the above.
GBP/USD
Quoting our last commentary on this currency pair:
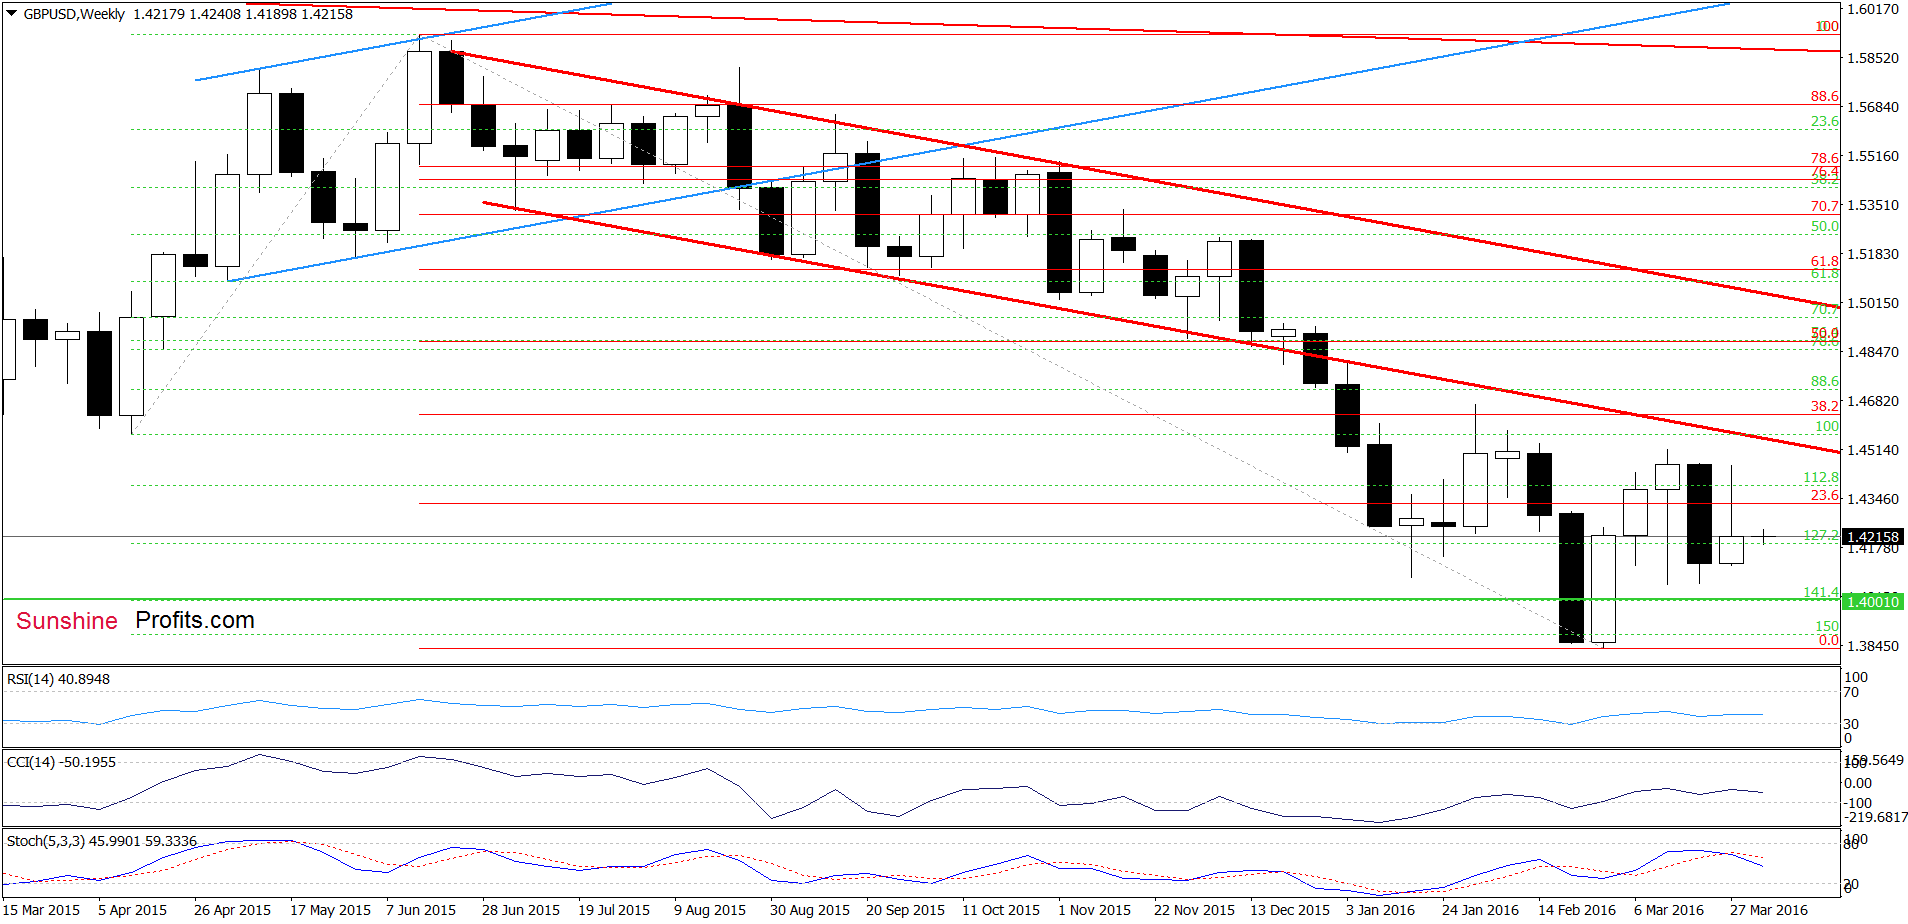
(…) the proximity to the orange resistance zone encouraged currency bears to act, which resulted in a pullback. Additionally, the Stochastic Oscillator generated a sell signal, which suggests a test of the green support line based on the recent lows (currently around 1.4138) in the coming week. (…) in this area is also support area created by the 76.4% and 78.6% Fibonacci retracement levels based on the recent upward move.
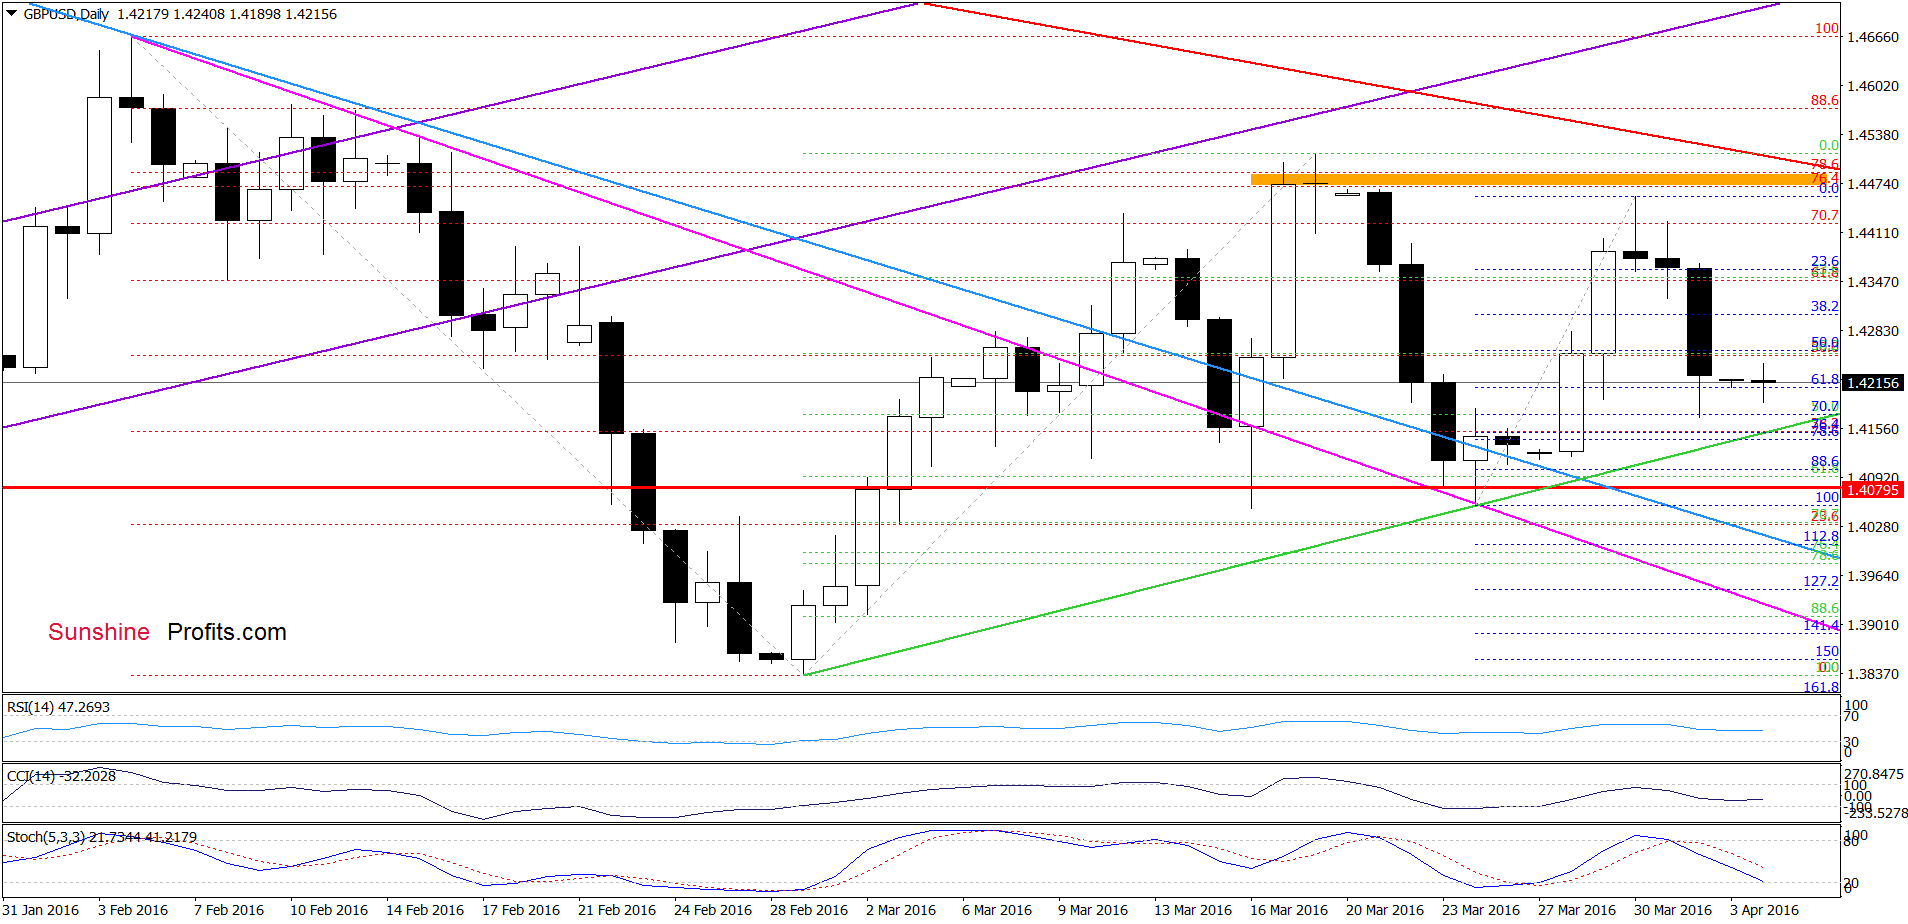
As you see on the daily chart, currency bears pushed GBP/USD lower as we had expected. With this sharp downswing the pair approached our downside targets, which suggests that we may see a rebound from here in the coming days (especially if Stochastic Oscillator generates a buy signal). If this is the case, the initial upside target would be the Friday’s high of 1.4370.
Very short-term outlook: mixed
Short-term outlook: mixed with bearish bias
MT outlook: mixed
LT outlook: mixed
Trading position (short-term; our opinion): No positions are justified from the risk/reward perspective at the moment. We will keep you informed should anything change, or should we see a confirmation/invalidation of the above.
USD/JPY
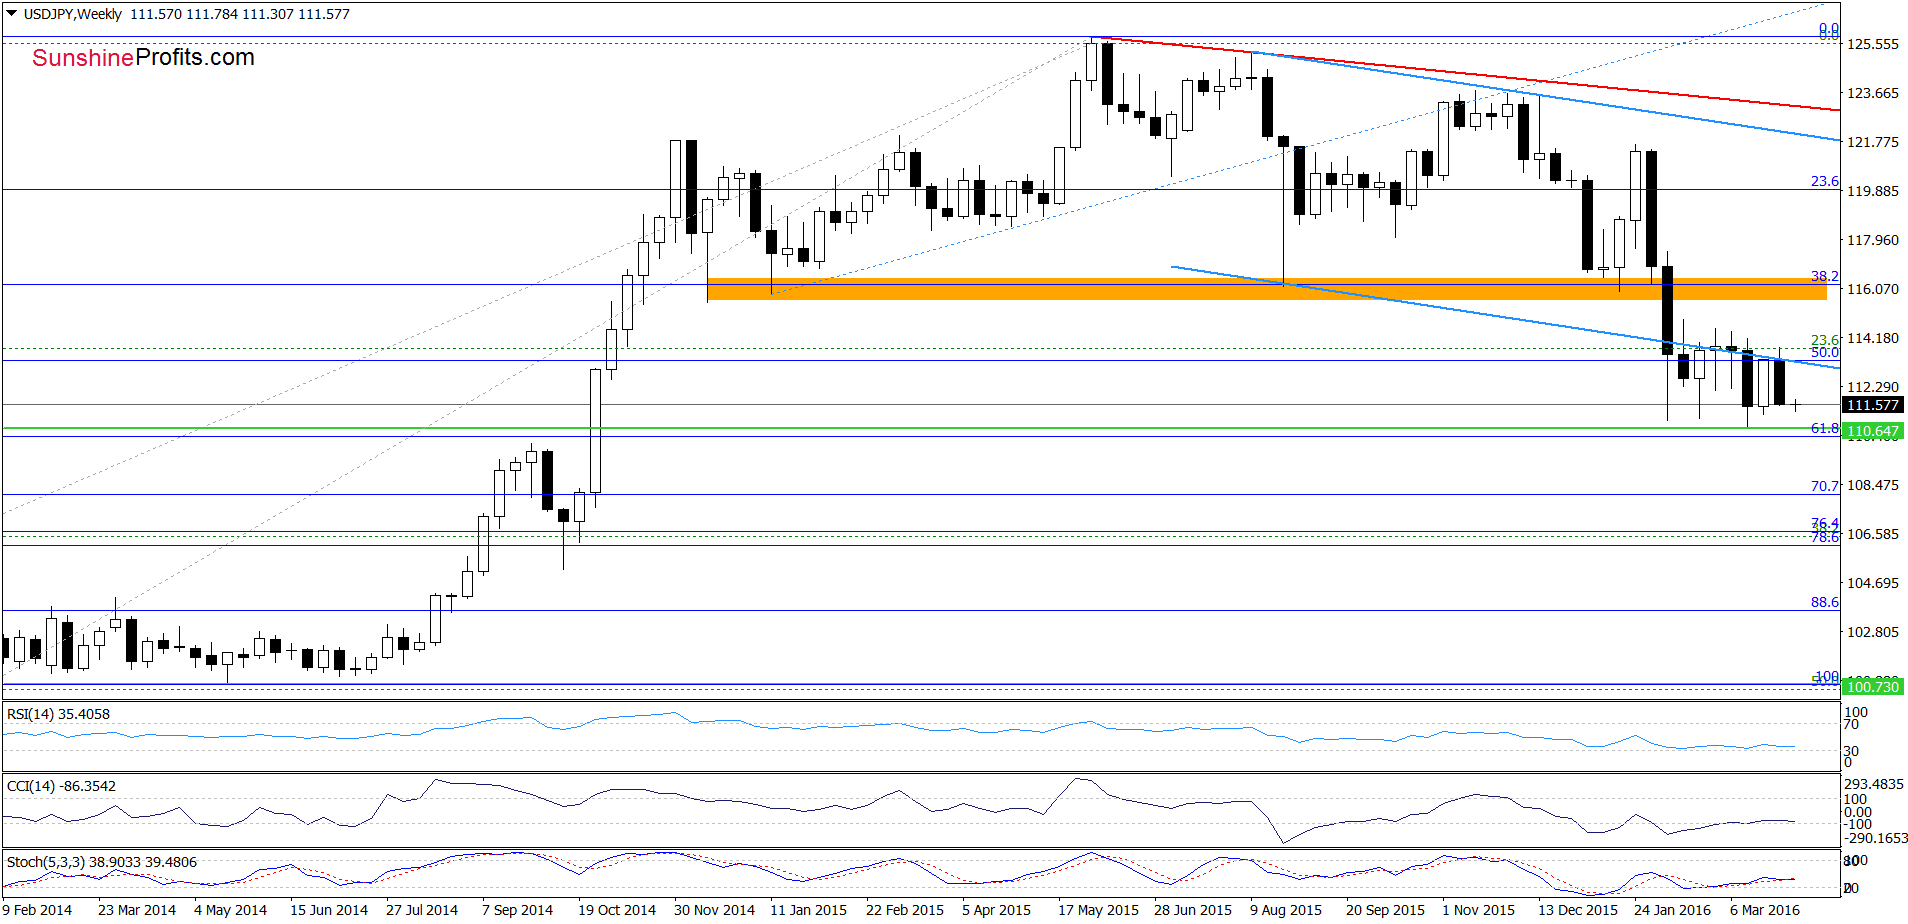
On the weekly chart, we see that invalidation of small breakout above the lower border of the blue declining trend channel, triggered further deterioration and USD/JPY declined below 112.
How did this move affect the very short-term picture? Let’s check.
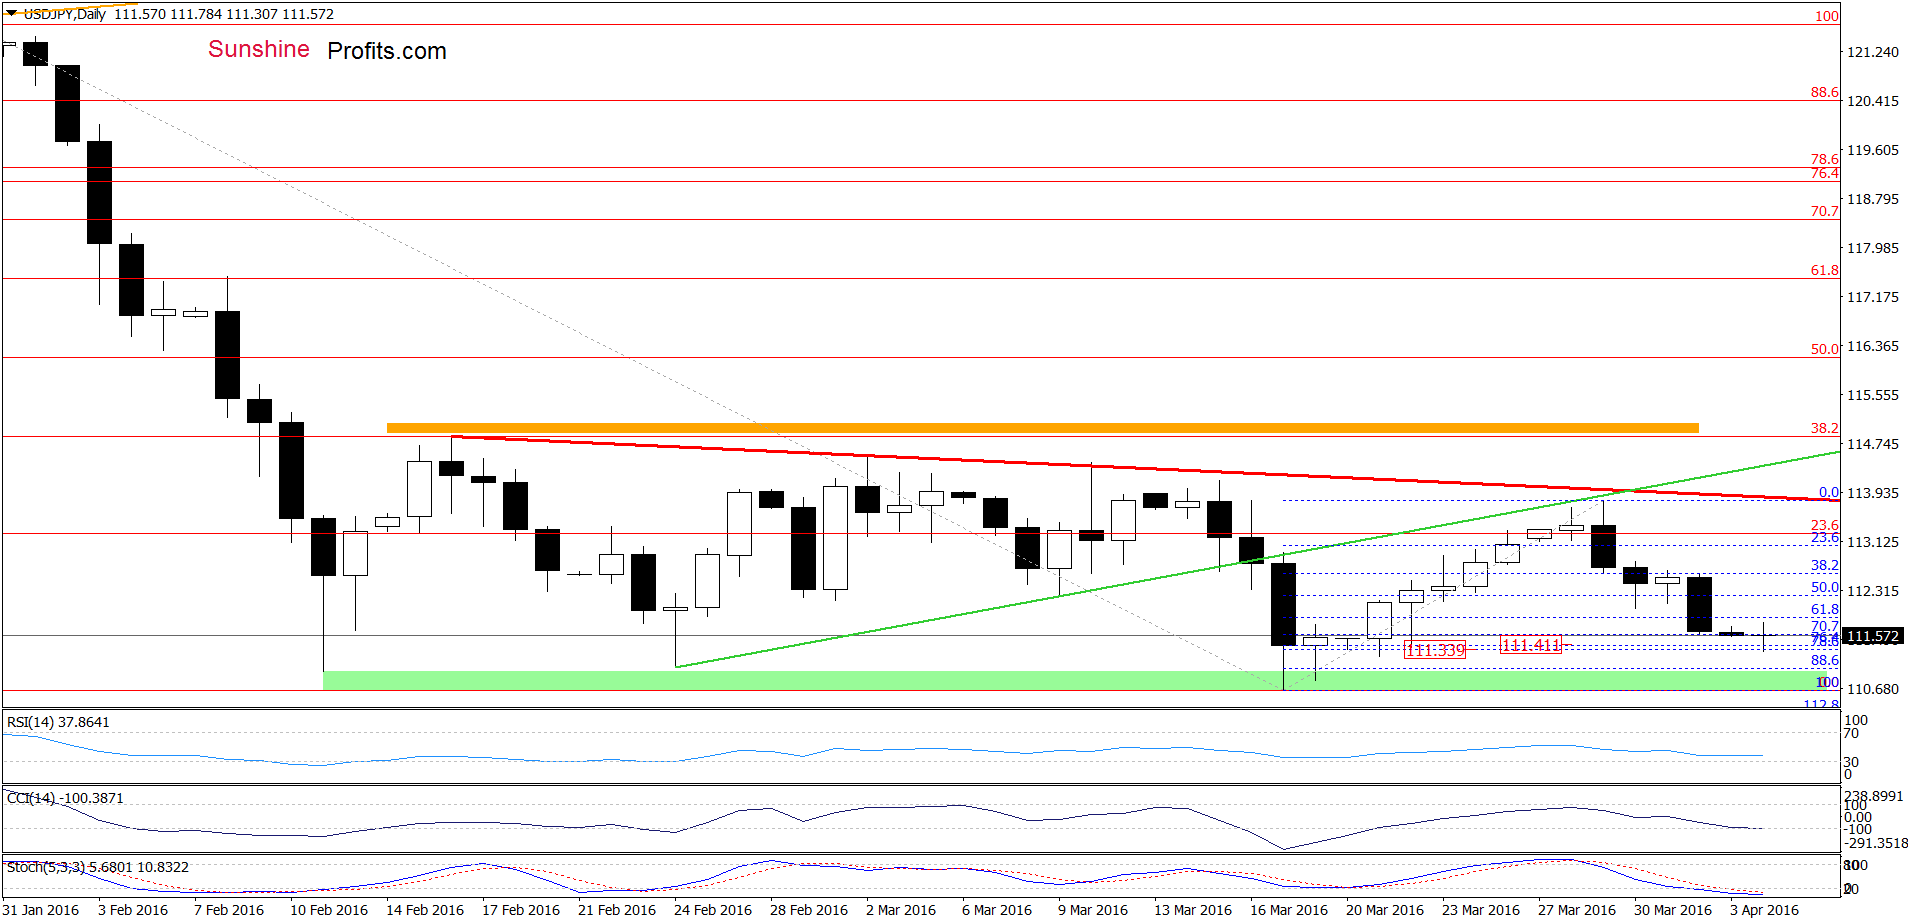
Quoting our previous commentary on this currency pair:
(…) USD/JPY not only slipped to our first downside target, but also dropped below it, which in combination with sell signals generated by the indicators suggests that further declines are likely. Therefore, if the pair extends losses, we may see a drop even to around 111.34-111.41, where the support area created by the 76.4% and 78.6% Fibonacci retracement levels is.
From today’s point of view, we see that the situation developed in line with the above scenario and USD/JPY reached our downside target earlier today. Although the pair could rebound from here, it seems to us that the exchange rate will re-test the strength of the green support zone in the coming week.
Very short-term outlook: mixed with bearish bias
Short-term outlook: mixed
MT outlook: mixed
LT outlook: mixed
Trading position (short-term; our opinion): No positions are justified from the risk/reward perspective at the moment. We will keep you informed should anything change, or should we see a confirmation/invalidation of the above.
USD/CAD
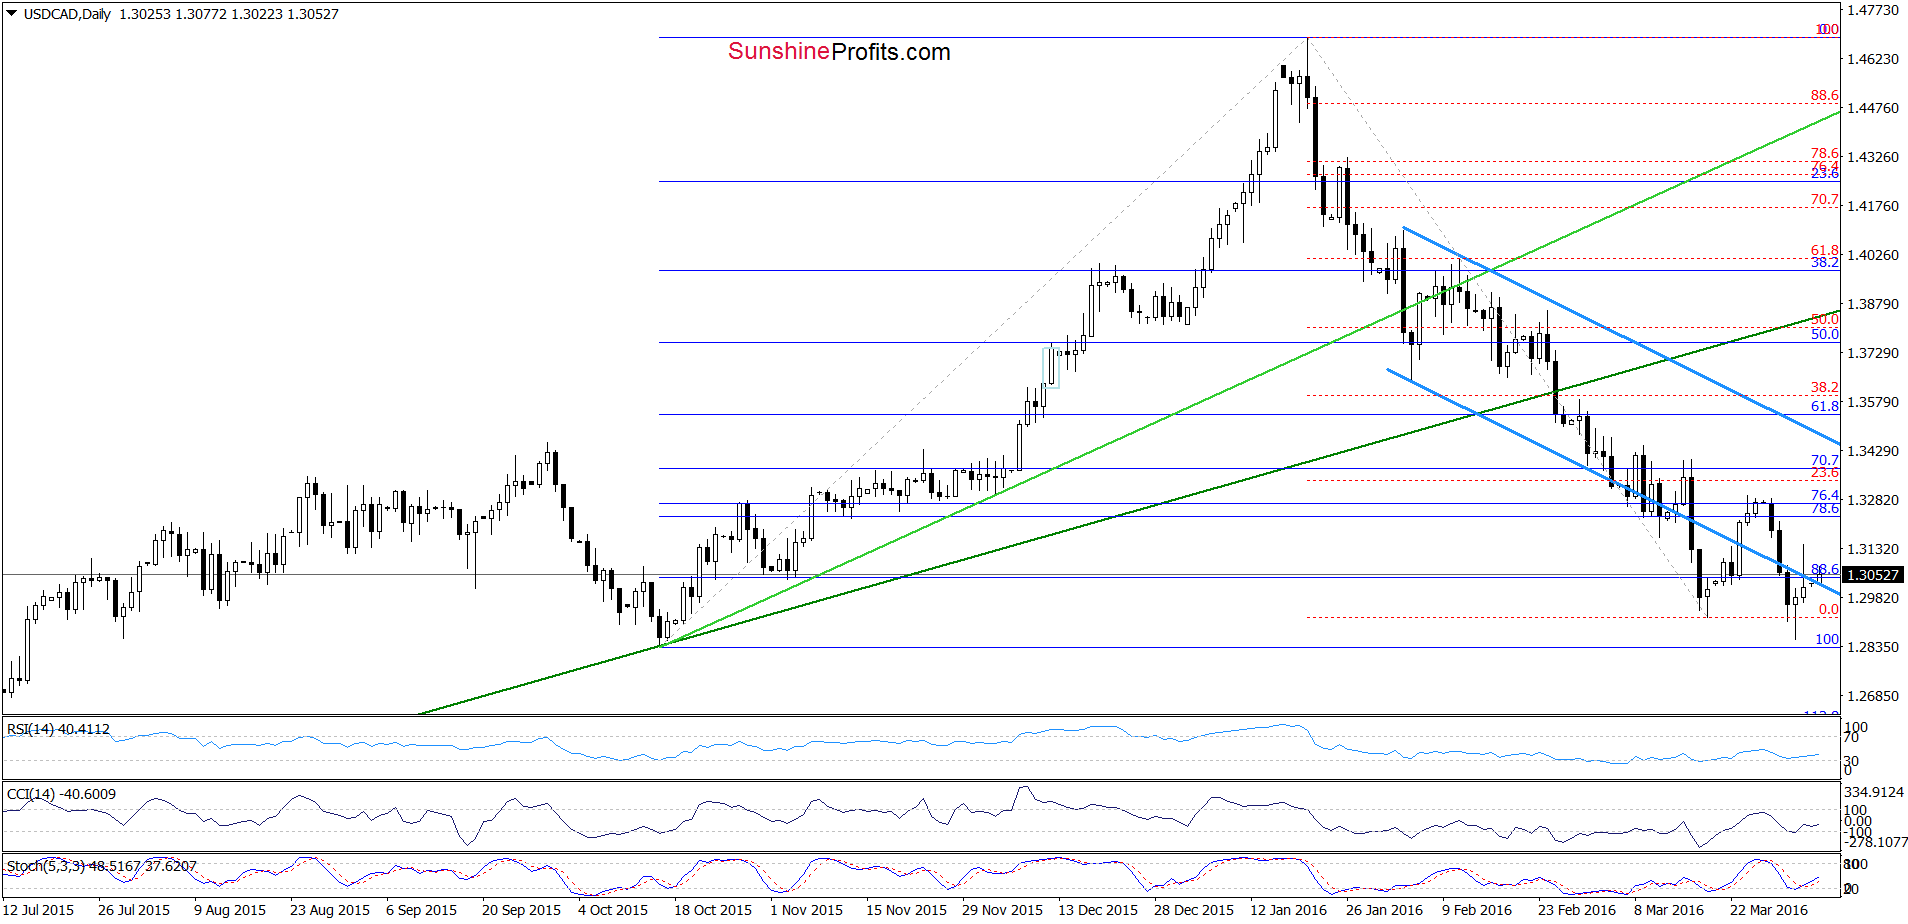
On Thursday, we wrote:
(…) the exchange rate dropped under the lower border of the blue declining trend channel (marked on the daily chart) and reached the March low yesterday. What’s next? Taking into account the medium-term picture and sell signals generated by the daily indicators, we think that further deterioration is just around the corner and USD/CAD will test the Oct low and the green support zone (which is also reinforced by the medium-term green support line) in near future.
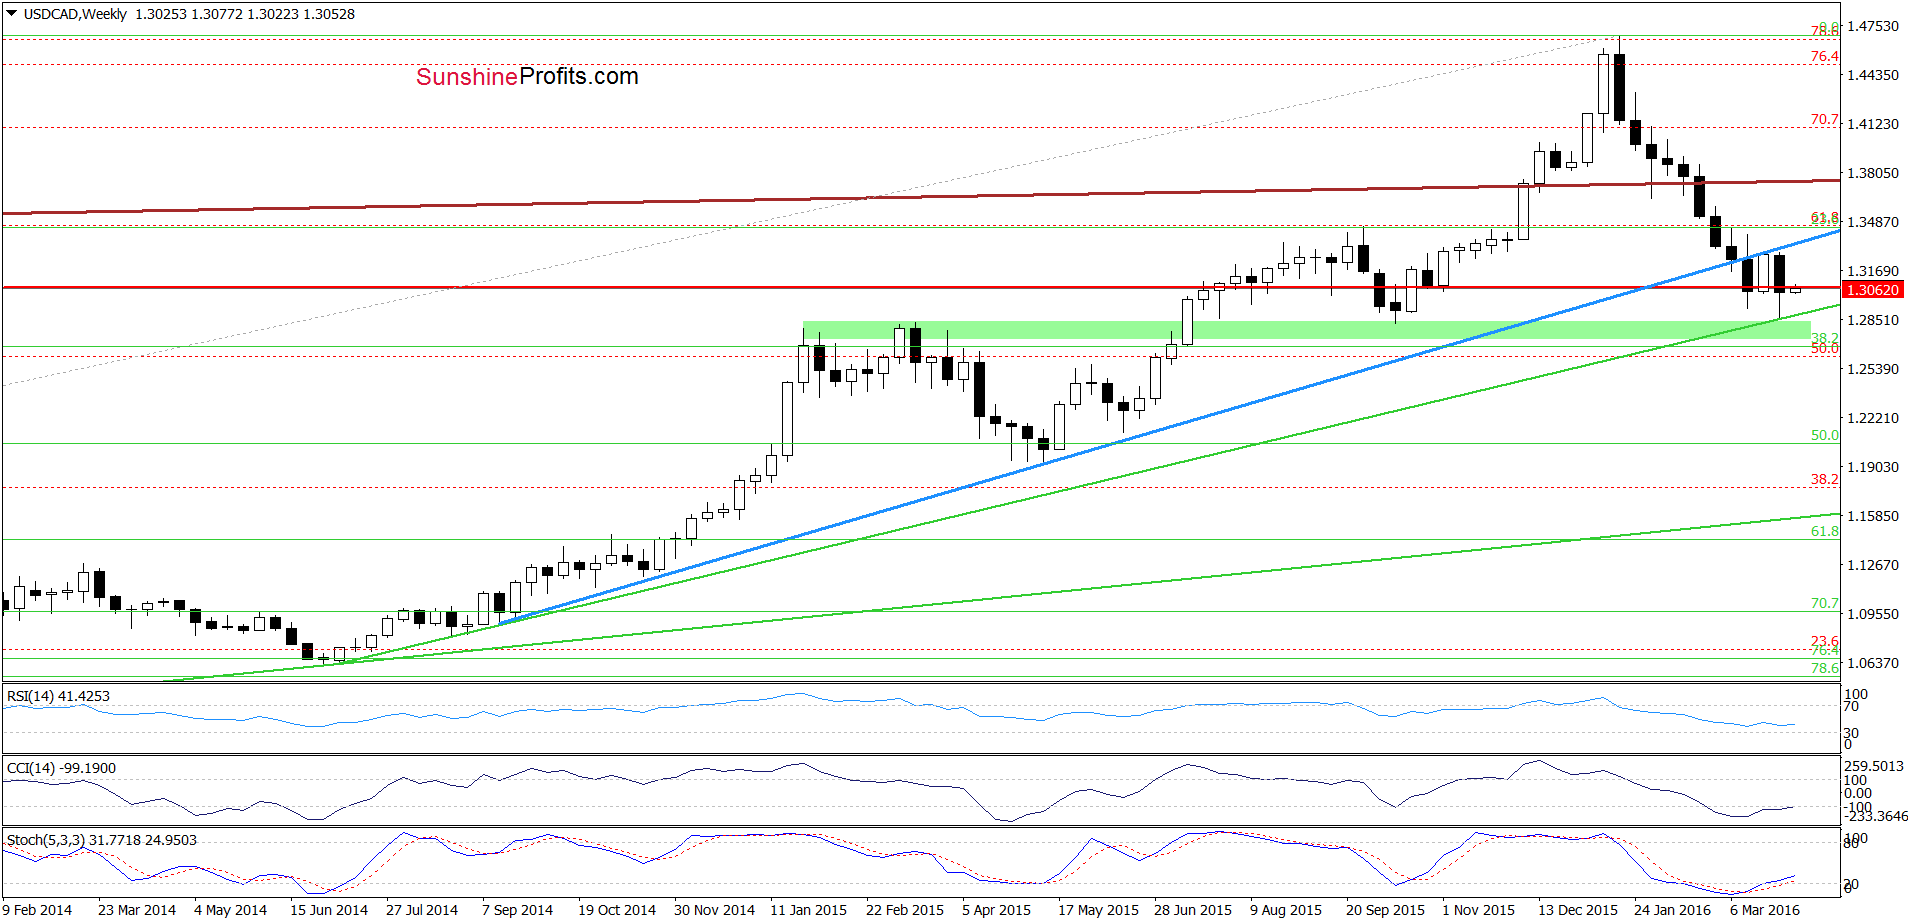
On the weekly chart, we see that currency bears pushed the pair lower in the previous week, which resulted in a drop to the medium-term green support line (as we had expected). As you see, this support triggered a rebound, which took USD/CAD above the lower border of the blue declining trend channel. Additionally, all indicators generated buy signals, which suggest further improvement. Nevertheless, in our opinion, such price action would be more reliable if we see a daily closure above this line. If this is the case and currency bulls manage to push the pair higher from here, the initial upside target would be around 1.3281, where the 23.6% Fibonacci retracement (based on the entire downward move) and late-March highs are.
Very short-term outlook: mixed with bullish bias
Short-term outlook: mixed
MT outlook: mixed
LT outlook: mixed
Trading position (short-term; our opinion): No positions are justified from the risk/reward perspective at the moment. We will keep you informed should anything change, or should we see a confirmation/invalidation of the above.
USD/CHF
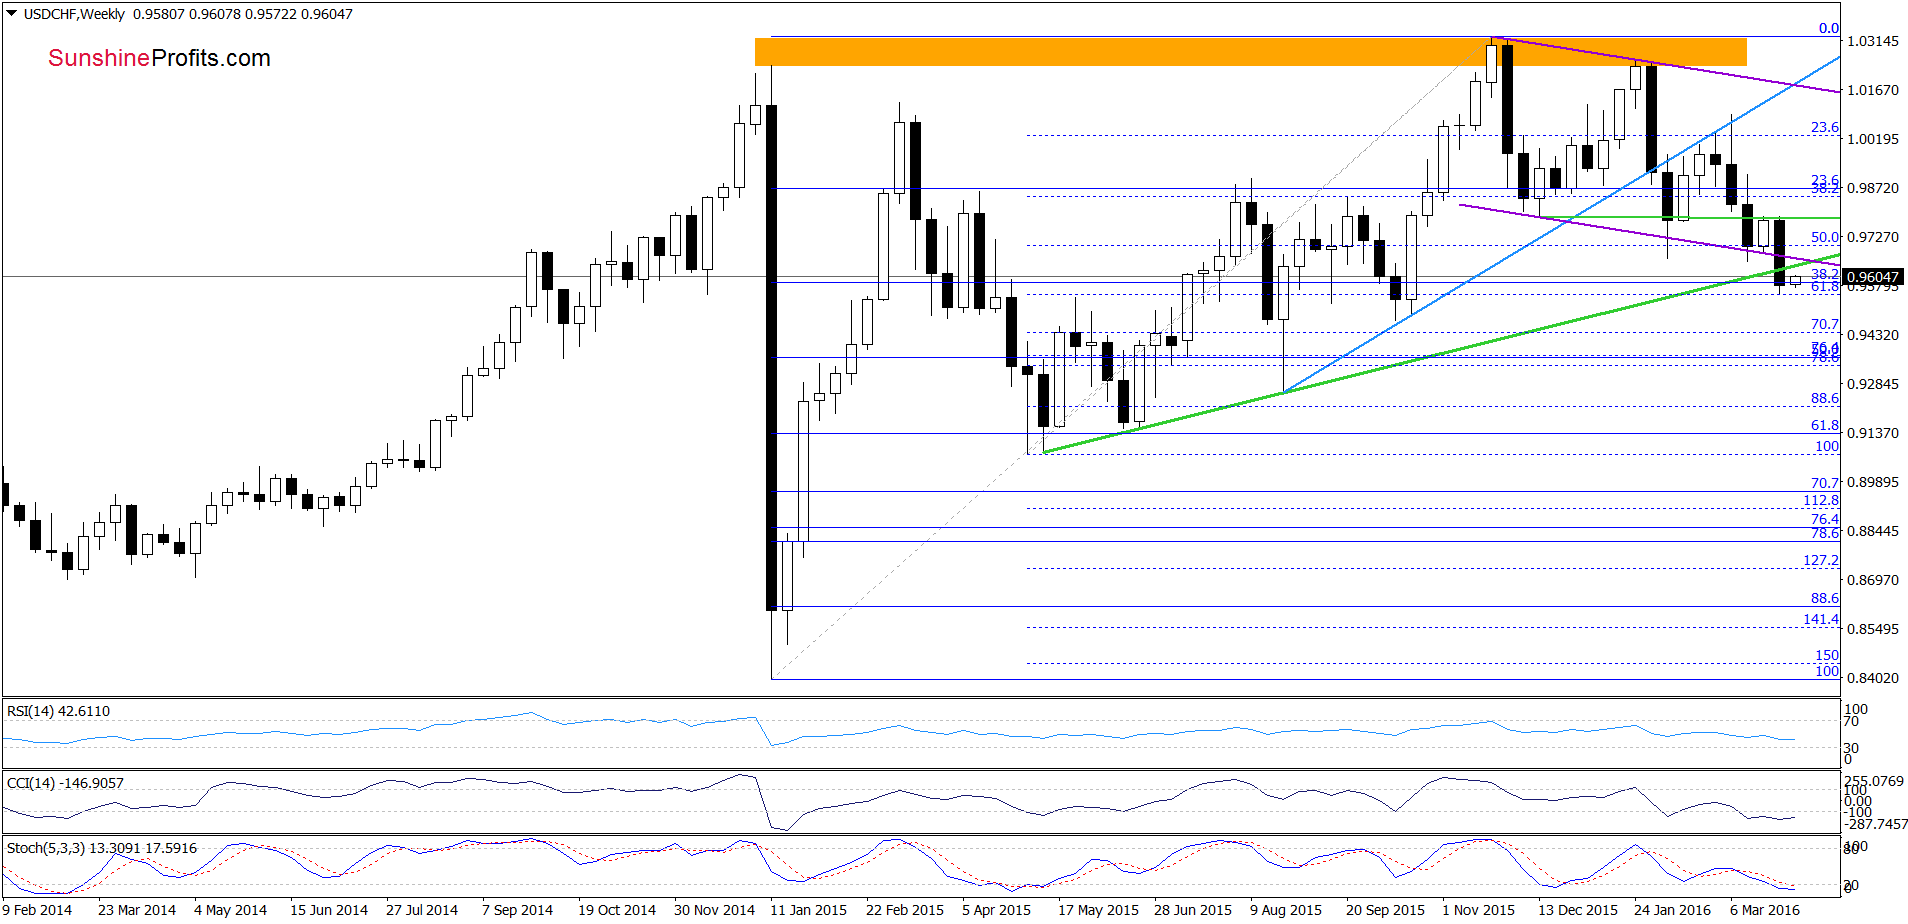
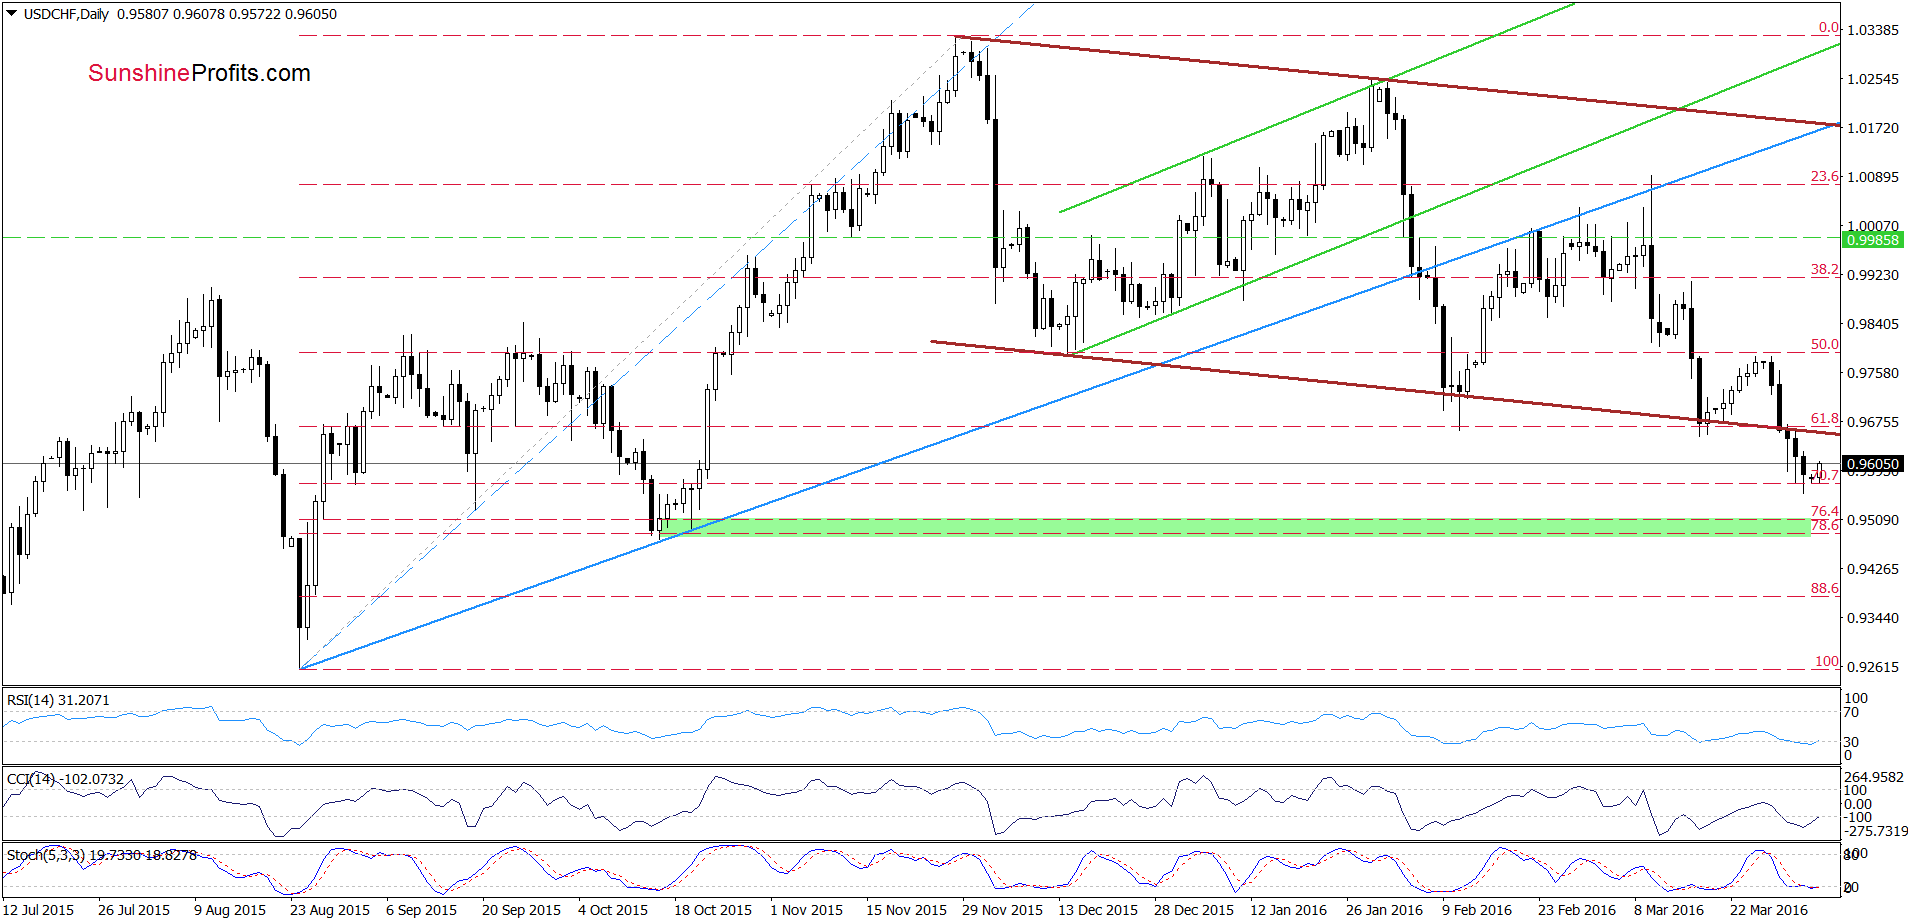
Looking at the above charts, we see that USD/CHF is still trading under the lower border of the brown declining trend channel and the green support/resistance line (marked on the weekly chart), which suggests that what we wrote in our previous commentary on this currency pair is up-to-date also today:
(…) Although the pair could rebound slightly from here, sell signals generated by the indicators remain in place, suggesting further drops. If this is the case, and the exchange rate moves lower once again, the next downside target would be the green support zone marked on the daily chart (created by the 76.4% and 78.6% Fibonacci retracement levels based on entire Aug-Nov upward move).
Very short-term outlook: mixed with bearish bias
Short-term outlook: mixed
MT outlook: mixed
LT outlook: mixed
Trading position (short-term; our opinion): No positions are justified from the risk/reward perspective. We will keep you informed should anything change, or should we see a confirmation/invalidation of the above.
AUD/USD
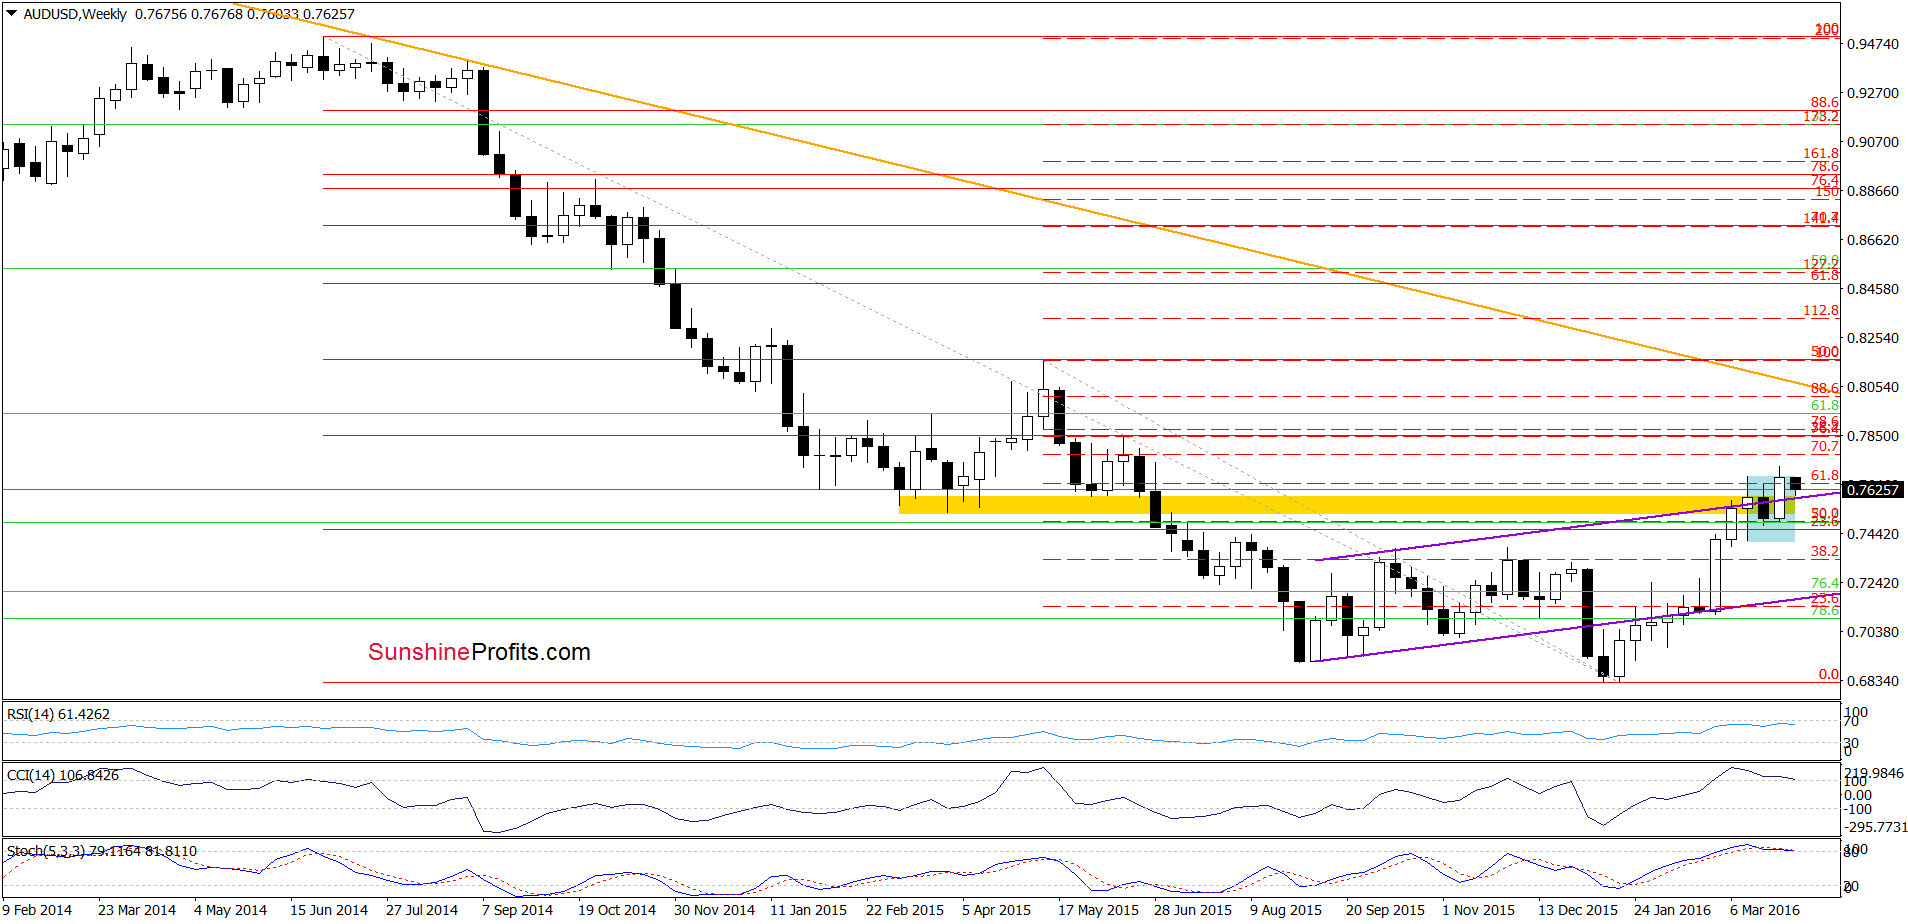
From the medium-term perspective, we see that although AUD/USD climbed above the upper border of the blue consolidation, currency bulls didn’t manage to push the pair higher, which resulted in a drop earlier today. In this way the exchange rate invalidated earlier small breakout above the upper line of the formation, which pushed AUD/USD to the previously-broken upper line of the purple rising trend channel. On one hand, the pair could rebound from here; however, there are negative divergences between the CCI, Stochastic Oscillator and the exchange rate, which is a negative signal. Additionally, all indicators are very close to generating sell signal, which suggests that reversal may be just around the corner.
Will the daily chart confirm a pro-bearish scenario? Let’s check.
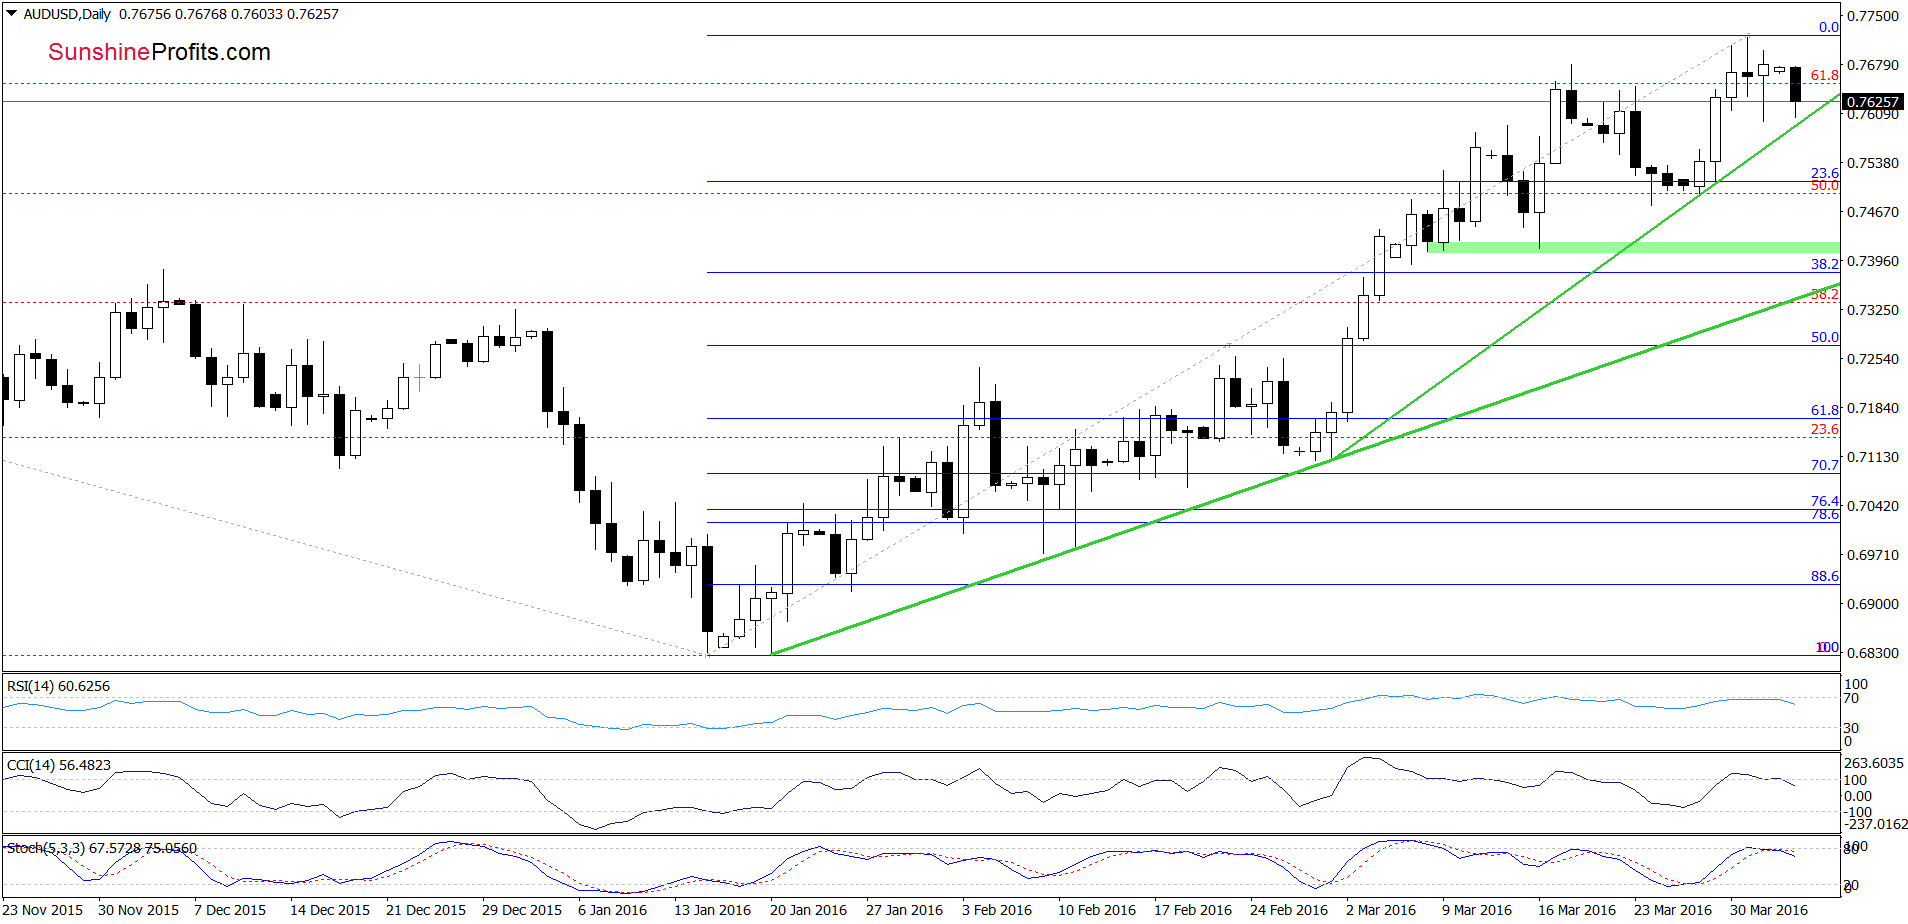
From the daily perspective, we see that today’s downswing approached the pair to the green support line based on the previous lows, which could trigger a test of recent high. Nevertheless, the current position of the daily indicators suggests that currency bears will show their claws in the coming weeks. If this is th case and the exchange rate declines under the green line, the initial downside target would be around 0.7509, where the 23.6% and late-March lows are.
Very short-term outlook: mixed with bearish bias
Short-term outlook: mixed
MT outlook: mixed
LT outlook: mixed
Trading position (short-term; our opinion): No positions are justified from the risk/reward perspective. We will keep you informed should anything change, or should we see a confirmation/invalidation of the above.
Thank you.
Nadia Simmons
Forex & Oil Trading Strategist
Przemyslaw Radomski, CFA
Founder, Editor-in-chief
Gold & Silver Trading Alerts
Forex Trading Alerts
Oil Investment Updates
Oil Trading Alerts

