

Earlier today, the euro moved lower against the greenback after official data showed that German factory orders dropped by 0.1% in the previous month. As a result, EUR/USD came back below important resistance line. What happened at the same time with other currency pairs?
In our opinion the following forex trading positions are justified - summary:
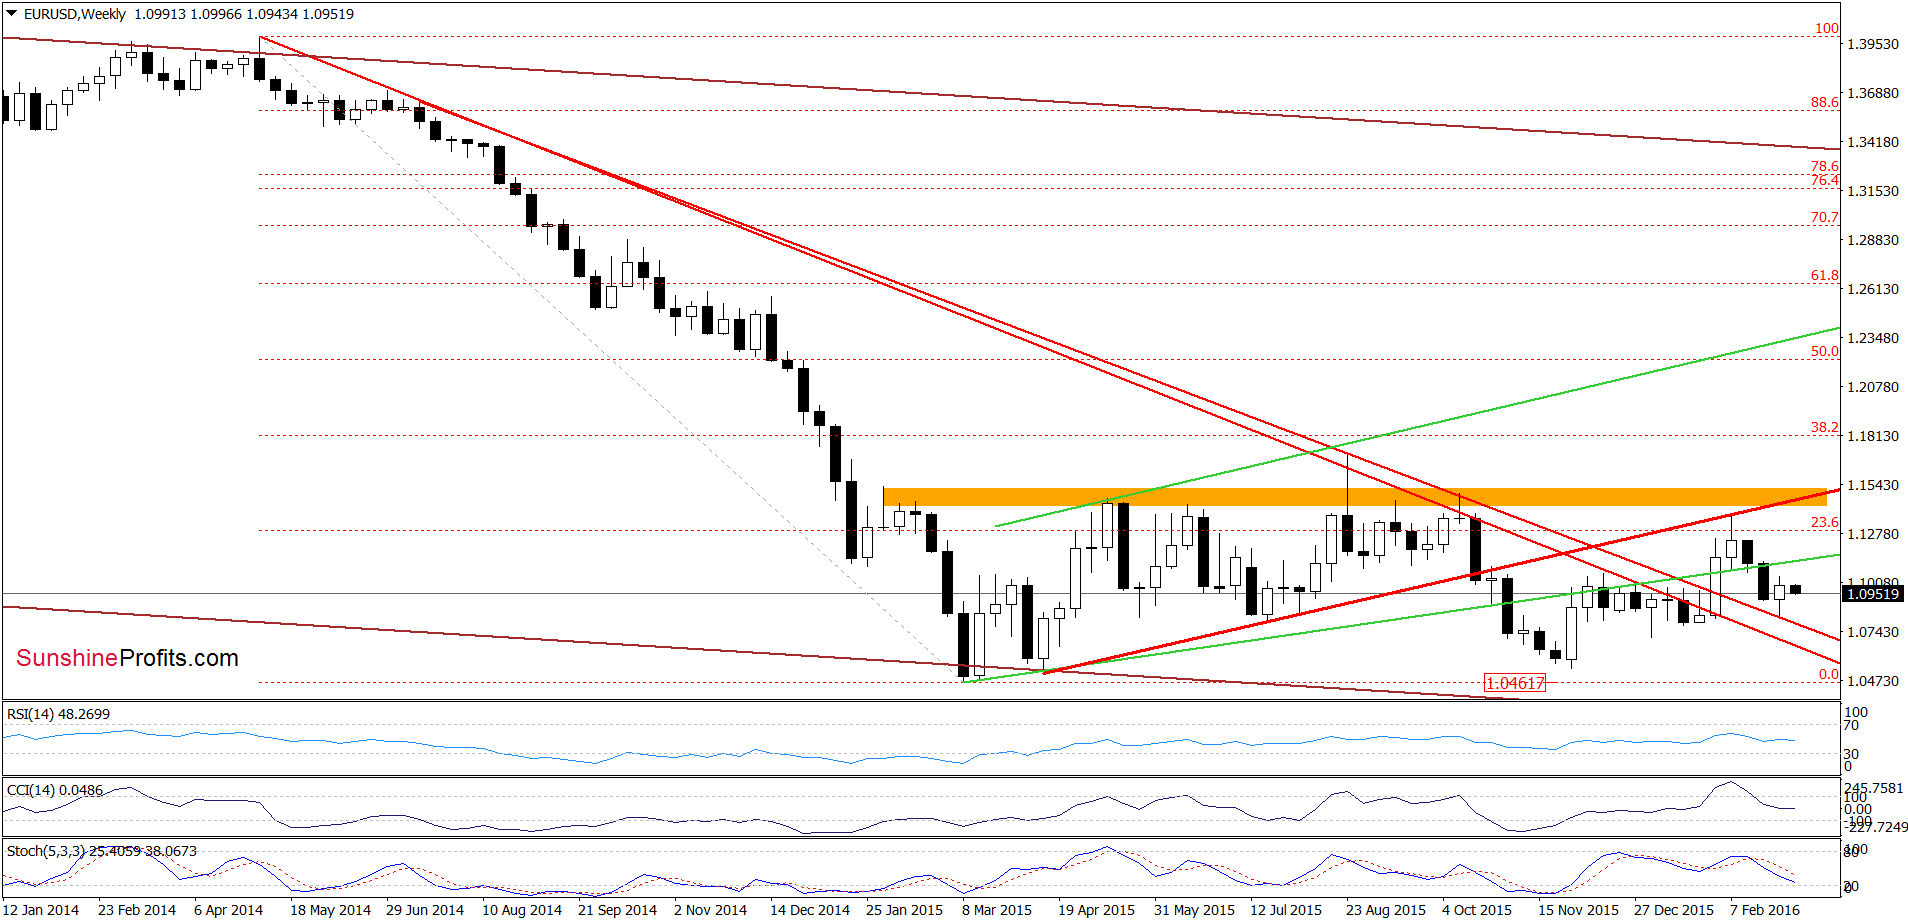
- EUR/USD: short (stop-loss order at 1.1512; initial downside target at 1.0572)
- GBP/USD: none
- USD/JPY: none
- USD/CAD: none
- USD/CHF: none
- AUD/USD: none
EUR/USD
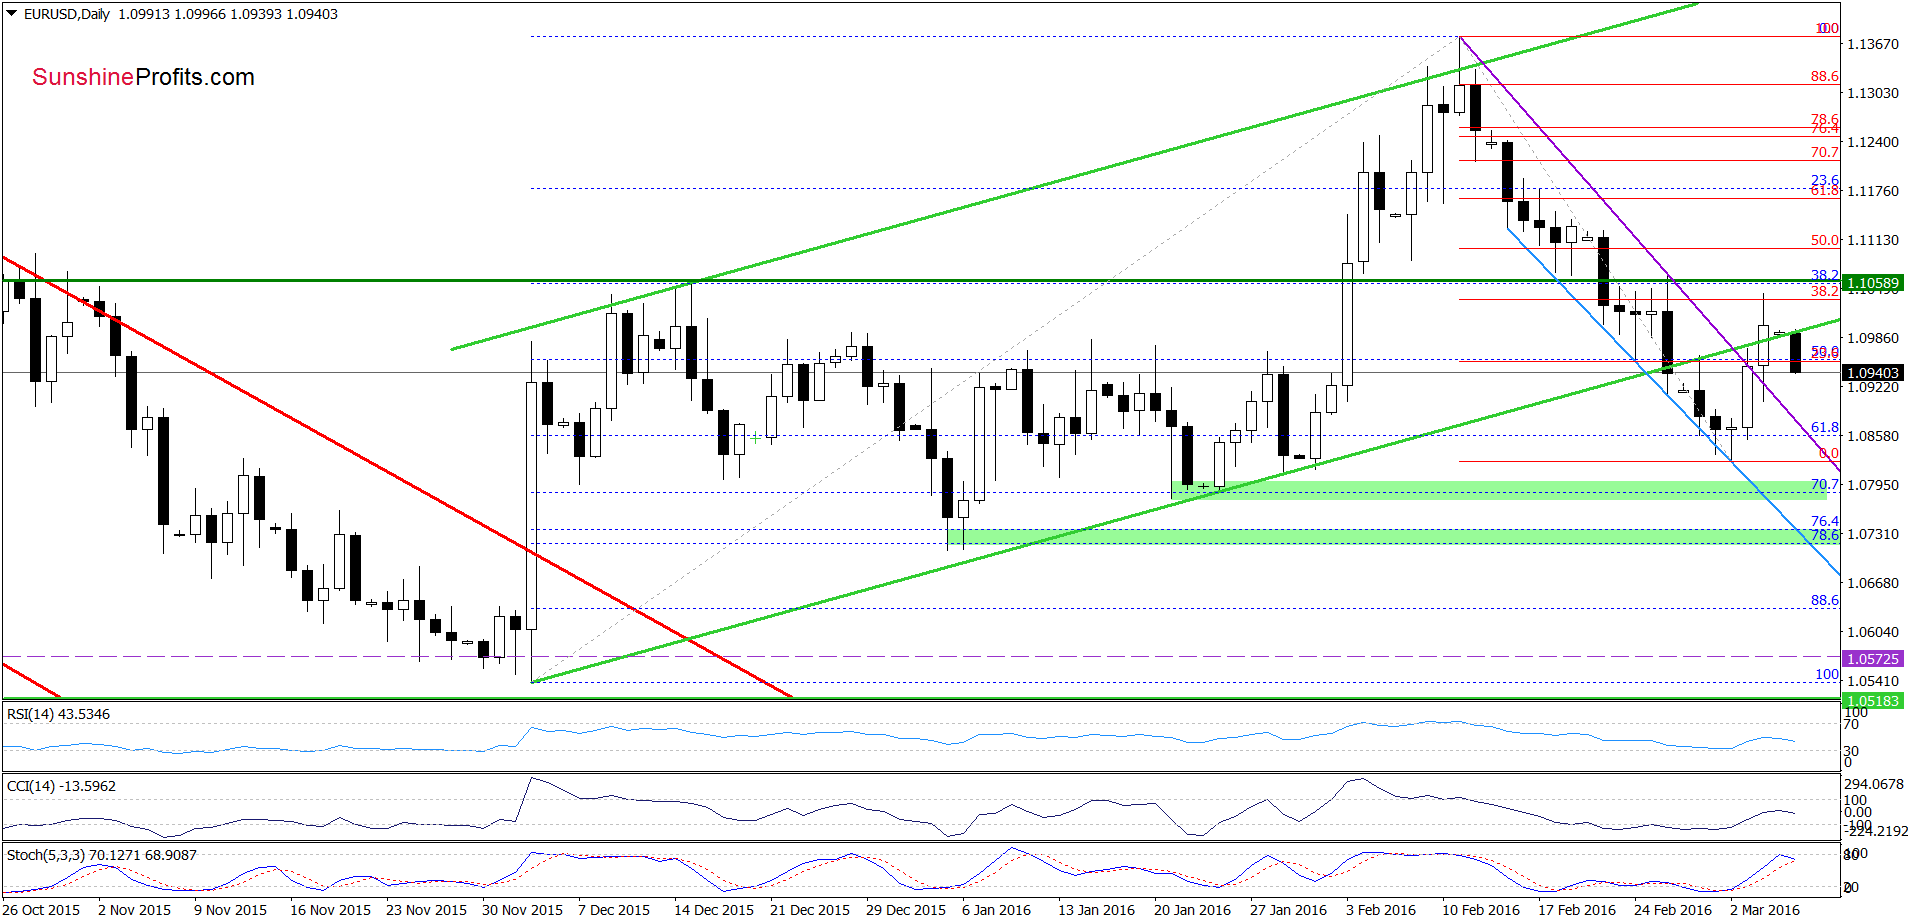
On the daily chart, we see that although EUR/USD moved sharply higher and broke above the previously-broken lower border of the green rising trend channel (invalidating earlier breakdown), the 38.2% Fibonacci retracement in combination with the horizontal resistance line based on the mid-Dec highs stopped further improvement. Earlier today, the exchange rate extended losses, which resulted in a comeback under the green support/resistance line. Taking this important fact into account and the current position of the Stochastic Oscillator (the indicator is very lose to generating a sell signal), we think that further deterioration is more likely than not. If we see suh price action, the first downside target would be the purple line, which serves as the nearest support (currently around 1.0873).
Very short-term outlook: bearish
Short-term outlook: bearish
MT outlook: mixed with bearish bias
LT outlook: mixed
Trading position (short-term; our opinion): Short positions (with a stop-loss order at 1.1512 and the initial downside target at 1.0572) are justified from the risk/reward perspective. We will keep you informed should anything change, or should we see a confirmation/invalidation of the above.
GBP/USD
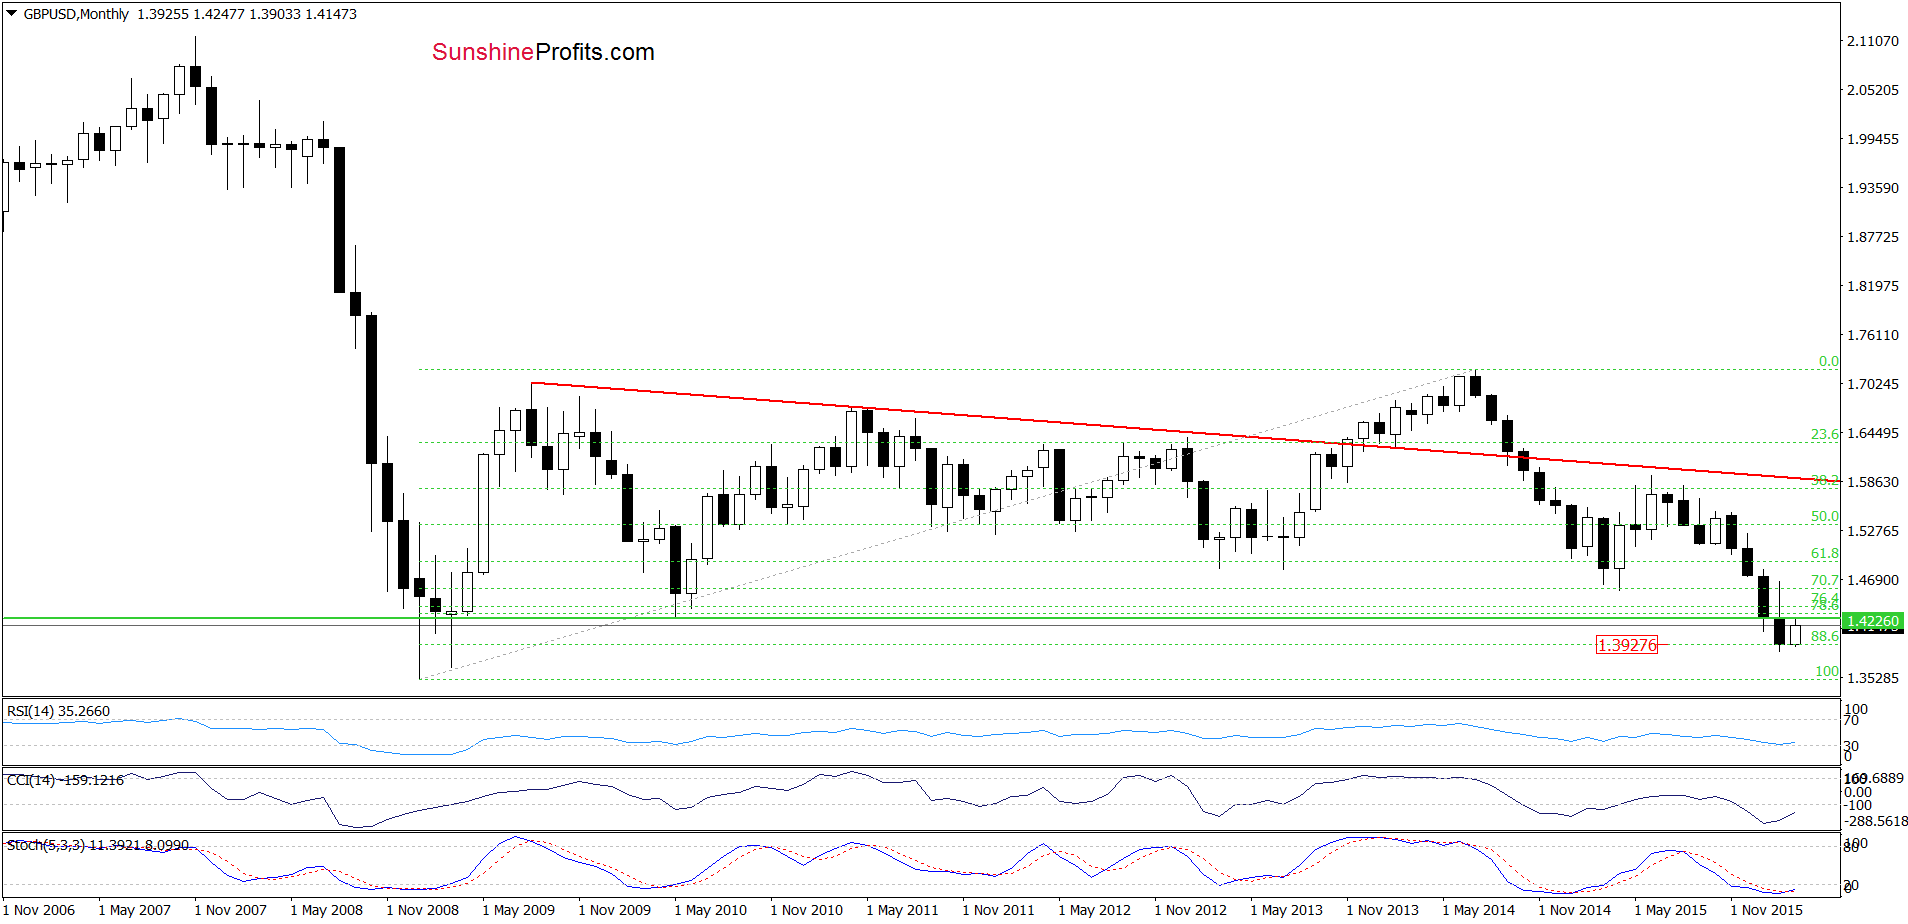
Looking at the long-term chart, we see that GBP/USD rebounded and climbed to the horizontal resistance line based on the May 2010 lows, which looks like a verification of earlier breakdown. Will we see a reversal and lower values of the exchange rate? Let’s examine the medium-term chart and find out what can we infer from it.
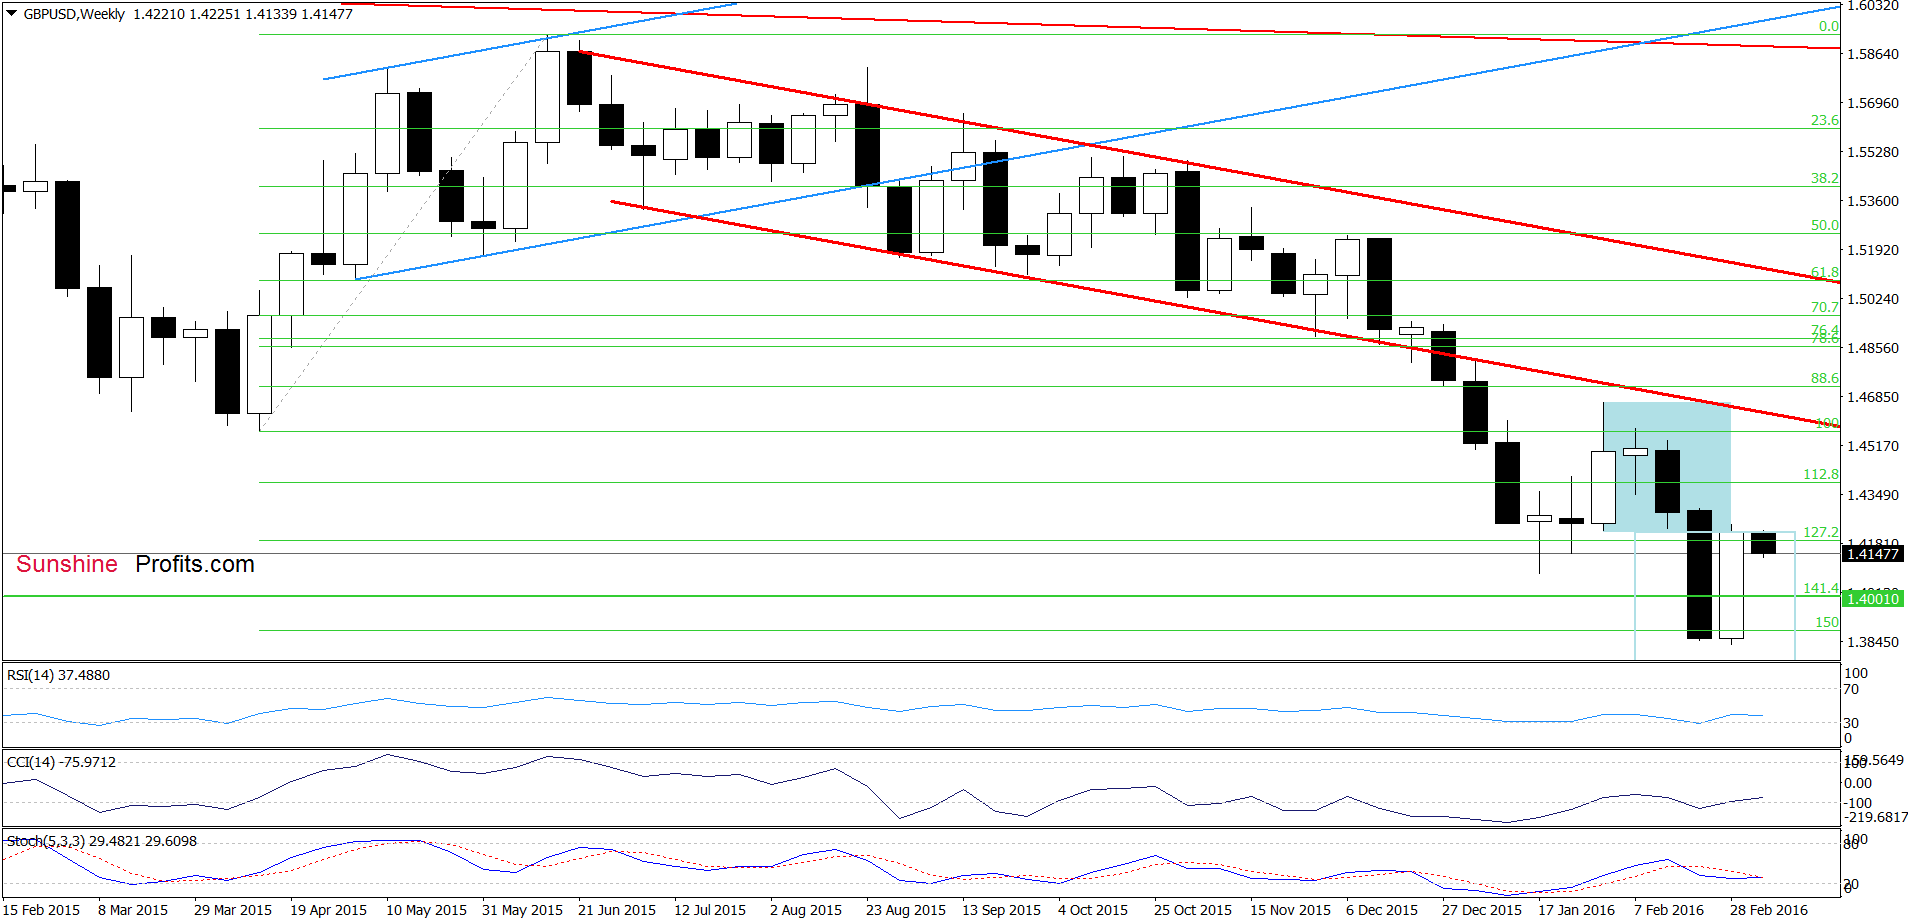
From this perspective, we see that the last week’s upward move took the pair t the lower border of the blue consolidation, which suggests a verification of the breakdown. If this is the case, we’ll see another attempt to move lower in the coming week.
How did the recent price action affect the very short-term picture? Let’s check.
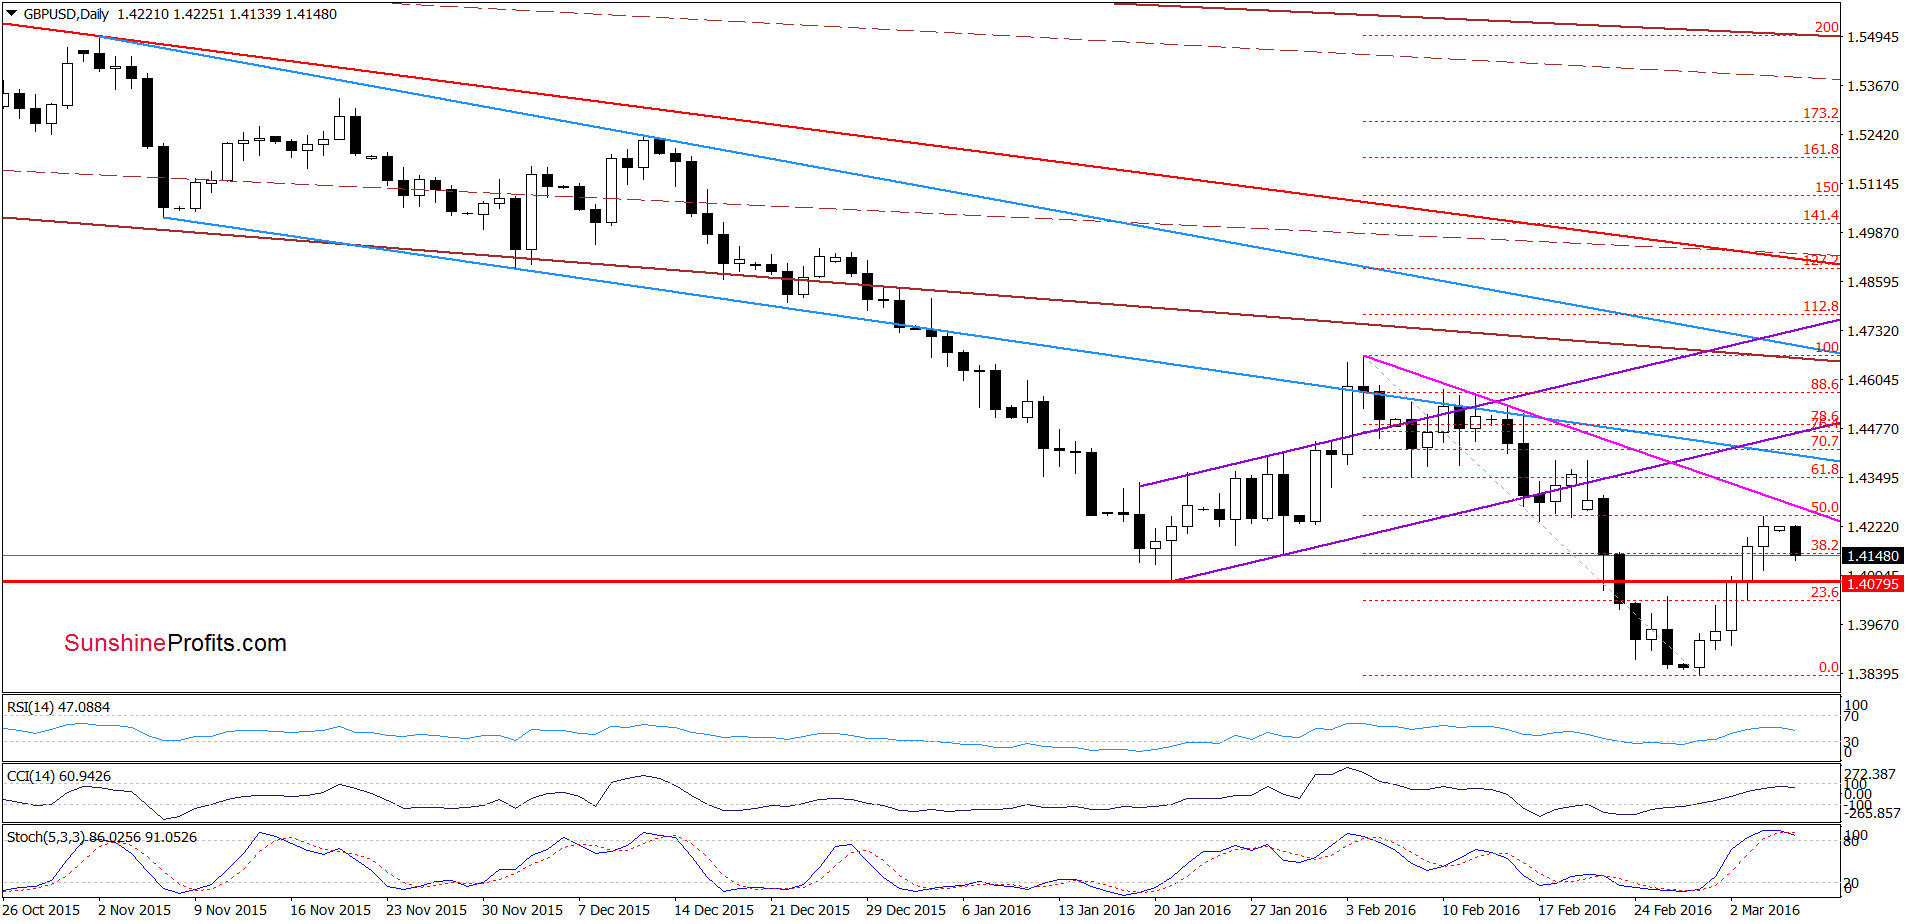
On the daily chart, we see that GBP/USD reached the 50% Fibonacci retracement based on the Feb decline. As you see this resistance in combination with the proximity to the pink resistance line based on the previous highs encouraged currency bears to act earlier today. Taking all the above and the current position of the daily CCI and Stochastic Oscillator into account, we think that lower values of GBP/USD are just around the corner. Therefore if the pair declines from here the first downside target would be around 1.4090, where the 38.2% Fibonacci retracement (based on the recent upward move) and the red horizontal support line are.
Very short-term outlook: mixed with bearish bias
Short-term outlook: mixed
MT outlook: mixed
LT outlook: mixed
Trading position (short-term; our opinion): No positions are justified from the risk/reward perspective at the moment. We will keep you informed should anything change, or should we see a confirmation/invalidation of the above.
USD/JPY
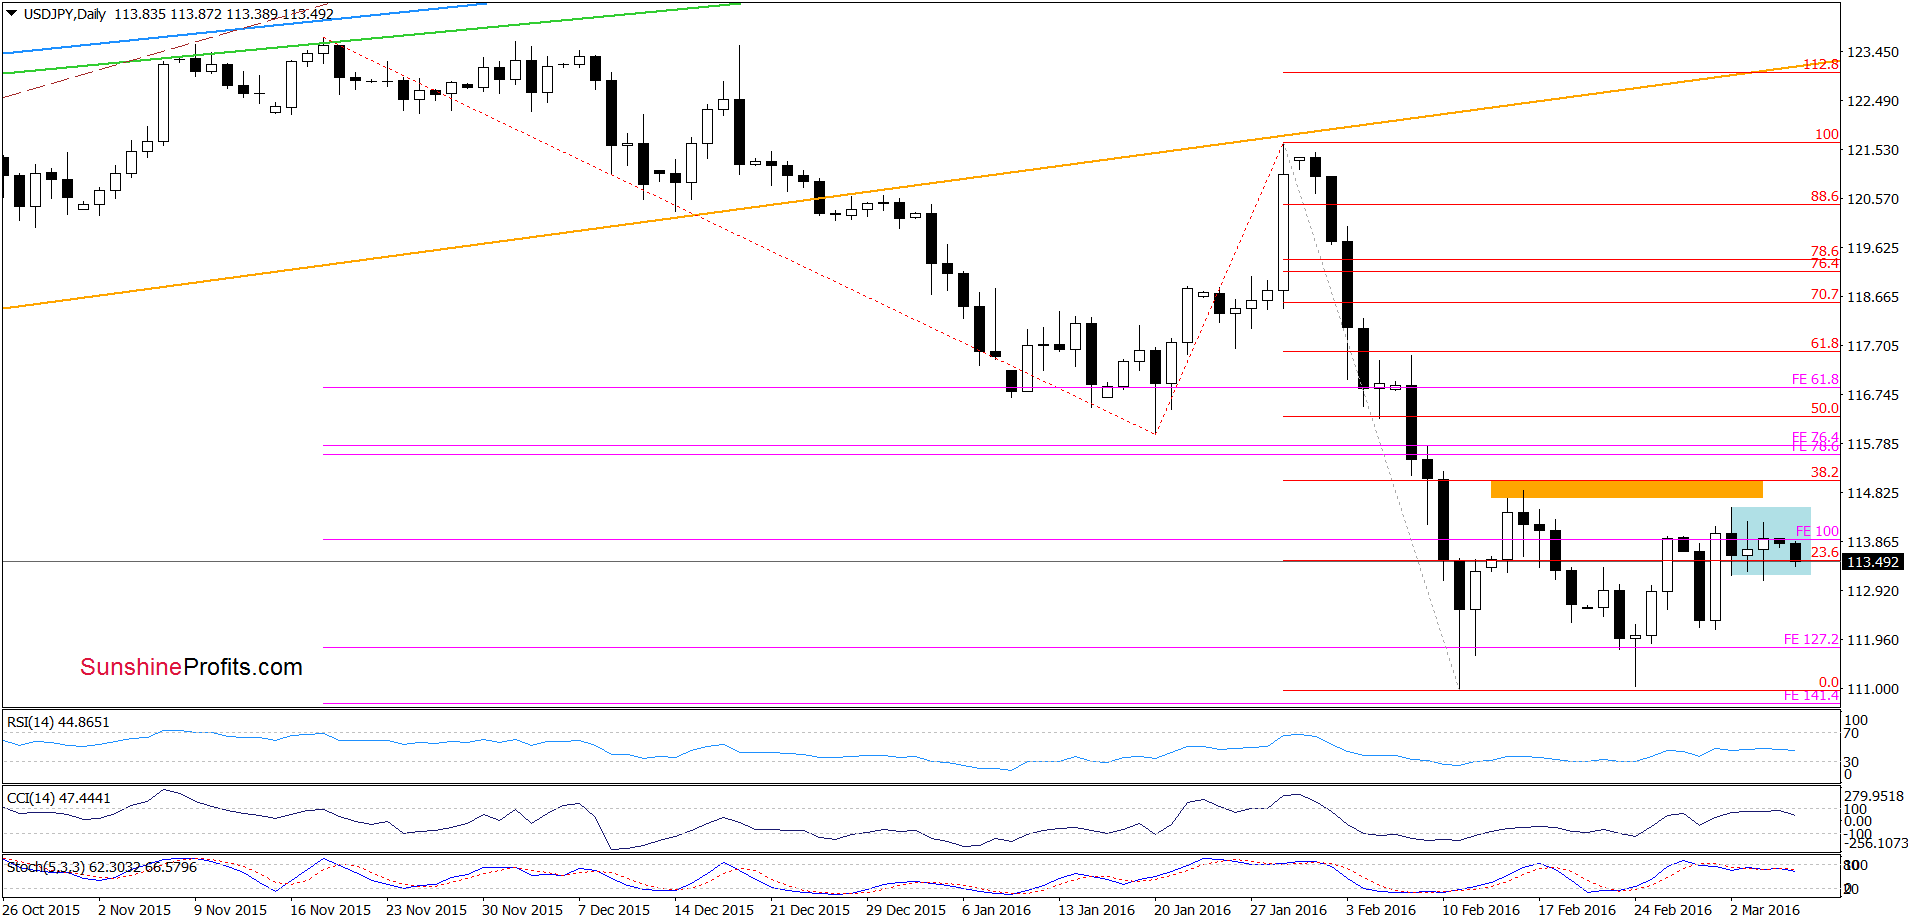
On the daily chart, we see that the situation hasn’t changed much as USD/JPY is trading in the blue consolidation under the orange resistance zone, which makes the very short-term picture a bit unclear. Nevertheless, the current position of the indicators (the Stochastic Oscillator generated a sell signal) suggests another attempt to move lower.
Are there any other factors that could encourage currency bears to act? Let’s examine the long-term chart and find out.
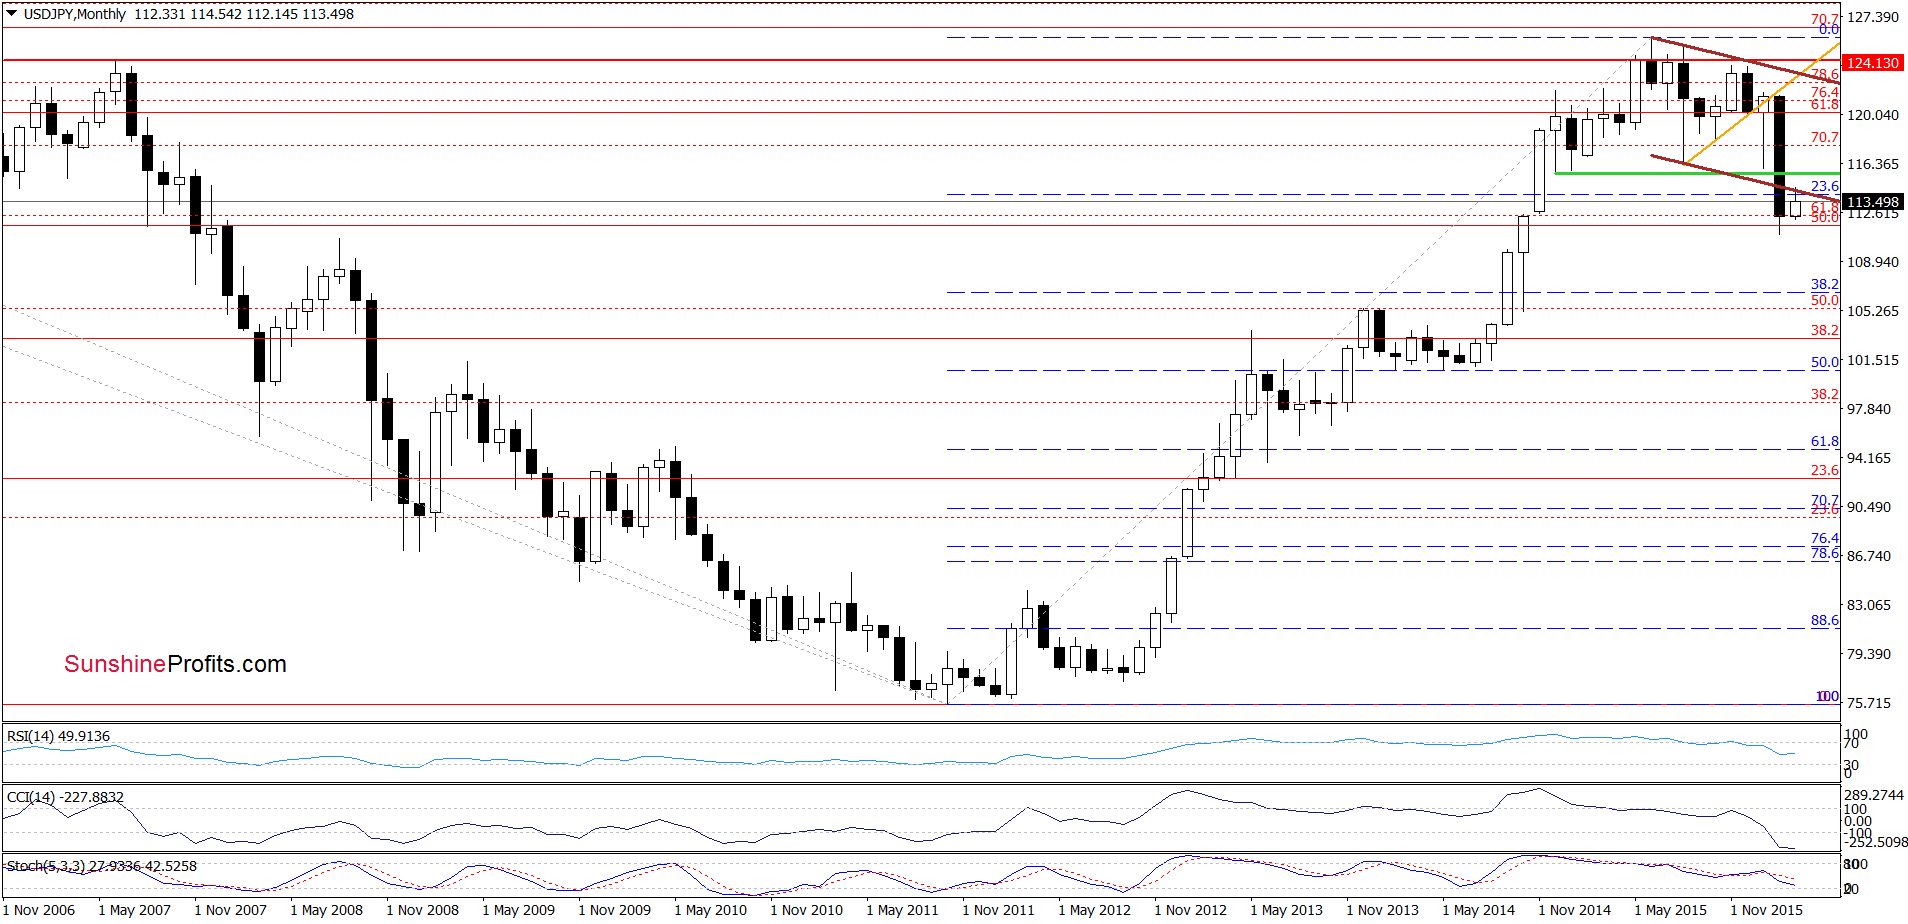
From this perspective, we see that the recent upswing took the exchange rate to the previously-broken lower border of the brown declining trend channel, which looks like a verification of earlier breakdown. Therefore, if the pair declines from here we may see a re-test of the recent lows in the coming week.
Very short-term outlook: mixed with bearish bias
Short-term outlook: mixed with bearish bias
MT outlook: mixed
LT outlook: mixed
Trading position (short-term; our opinion): No positions are justified from the risk/reward perspective at the moment. We will keep you informed should anything change, or should we see a confirmation/invalidation of the above.
USD/CAD
The situation in the medium term hasn’t changed as USD/CAD is still trading under the upper border of the long-term rising trend channel. Today, we’ll focus on the very short-term changes.
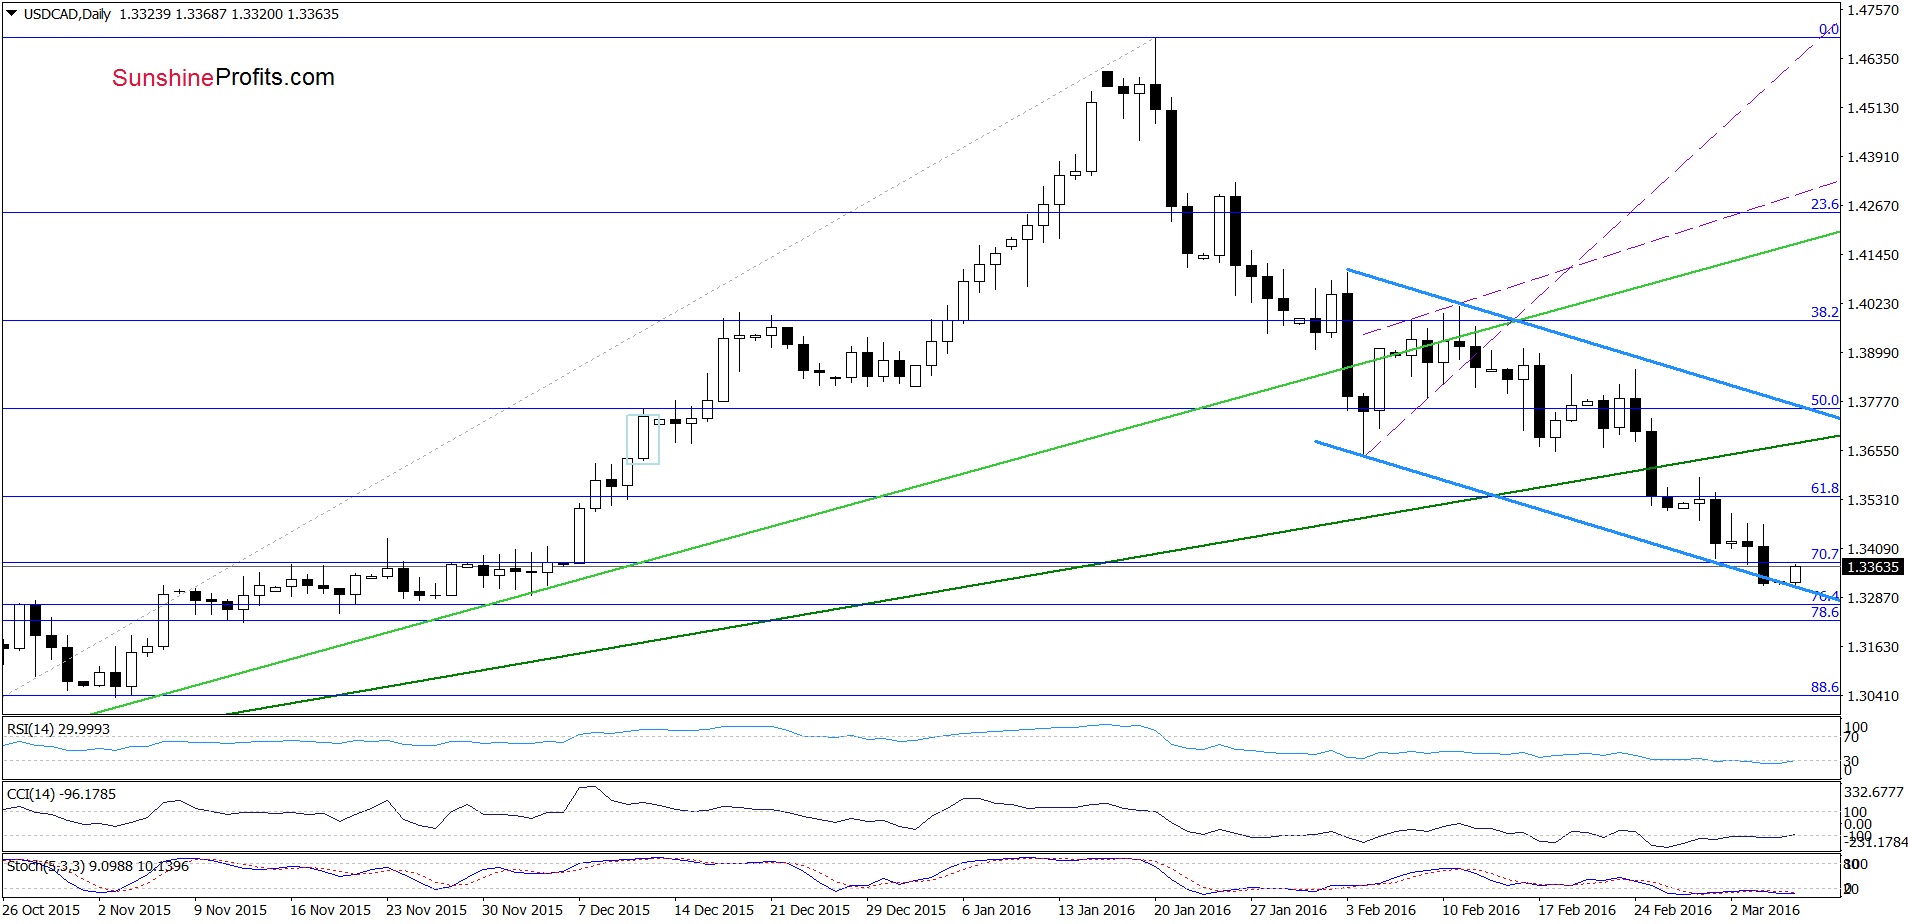
On the daily chart, we see that USD/CAD extended losses and re-tested the lower border of the blue declining trend channel on Friday. As you see this support encouraged currency bulls to act earlier today, but the size of the move is too small to say that the final bottom is already in. Nevertheless, the current position of the indicators (they all are oversold) suggests that reversal and higher values of USD/CAD are just around the corner.
Very short-term outlook: mixed with bullish bias
Short-term outlook: mixed
MT outlook: mixed
LT outlook: mixed
Trading position (short-term; our opinion): No positions are justified from the risk/reward perspective at the moment. We will keep you informed should anything change, or should we see a confirmation/invalidation of the above.
USD/CHF
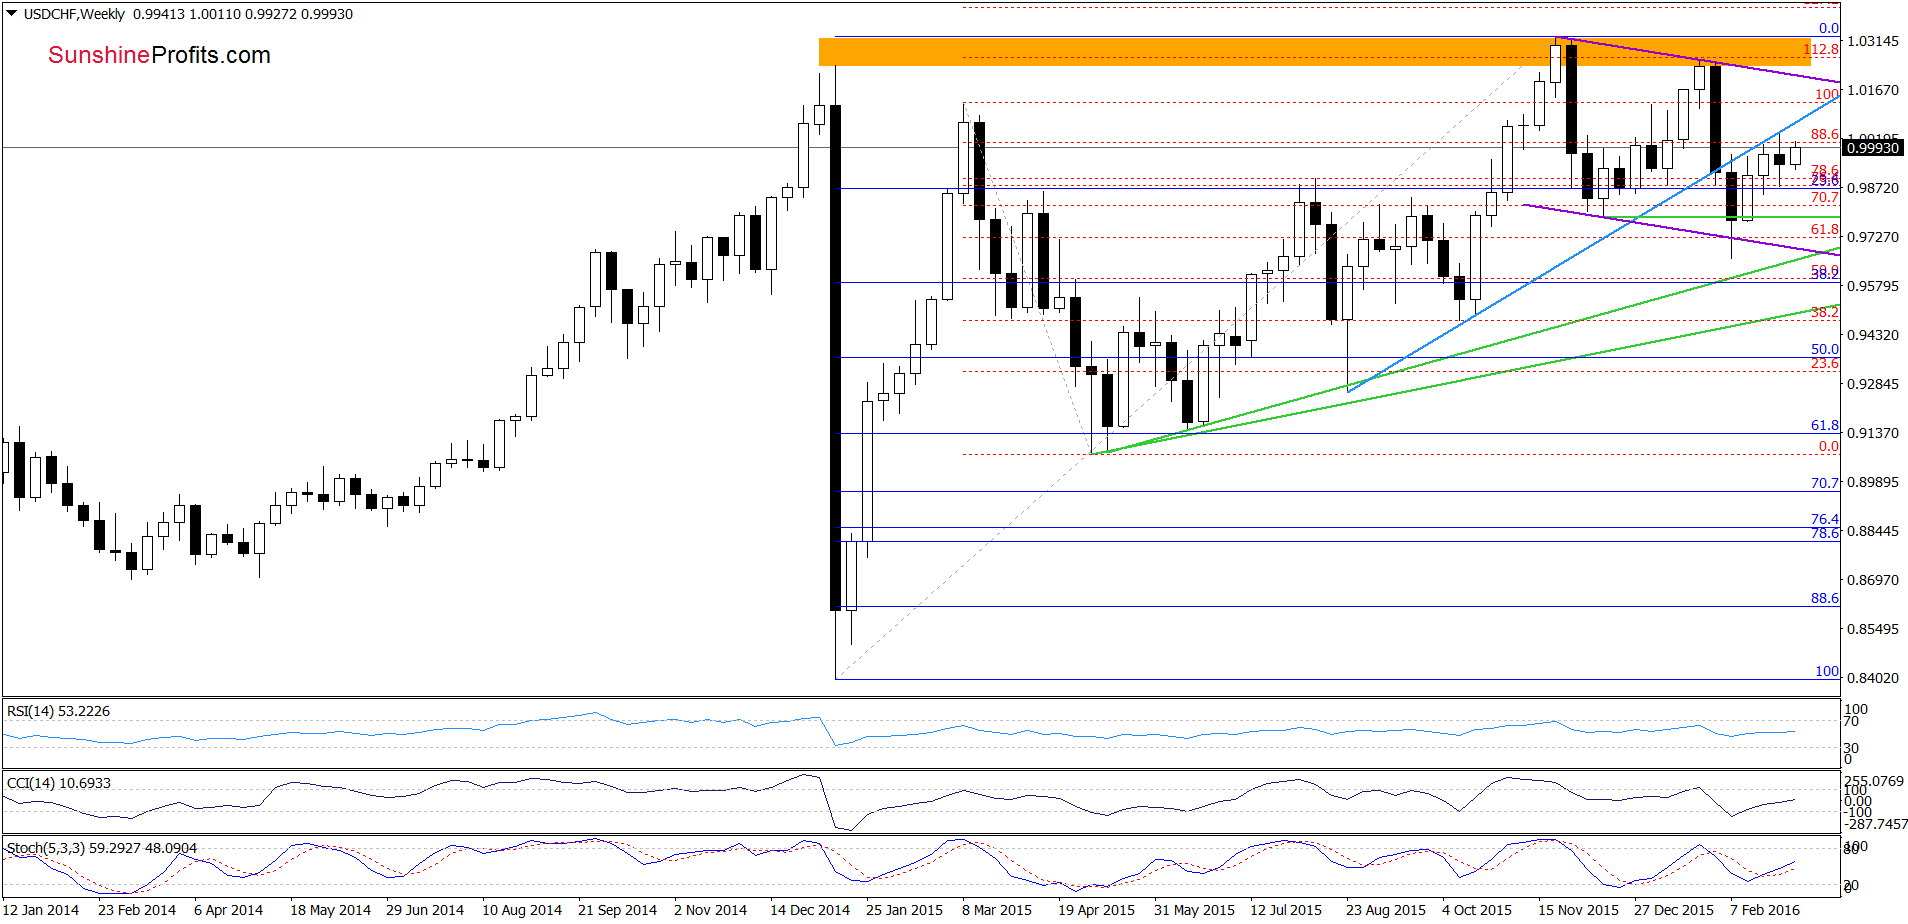
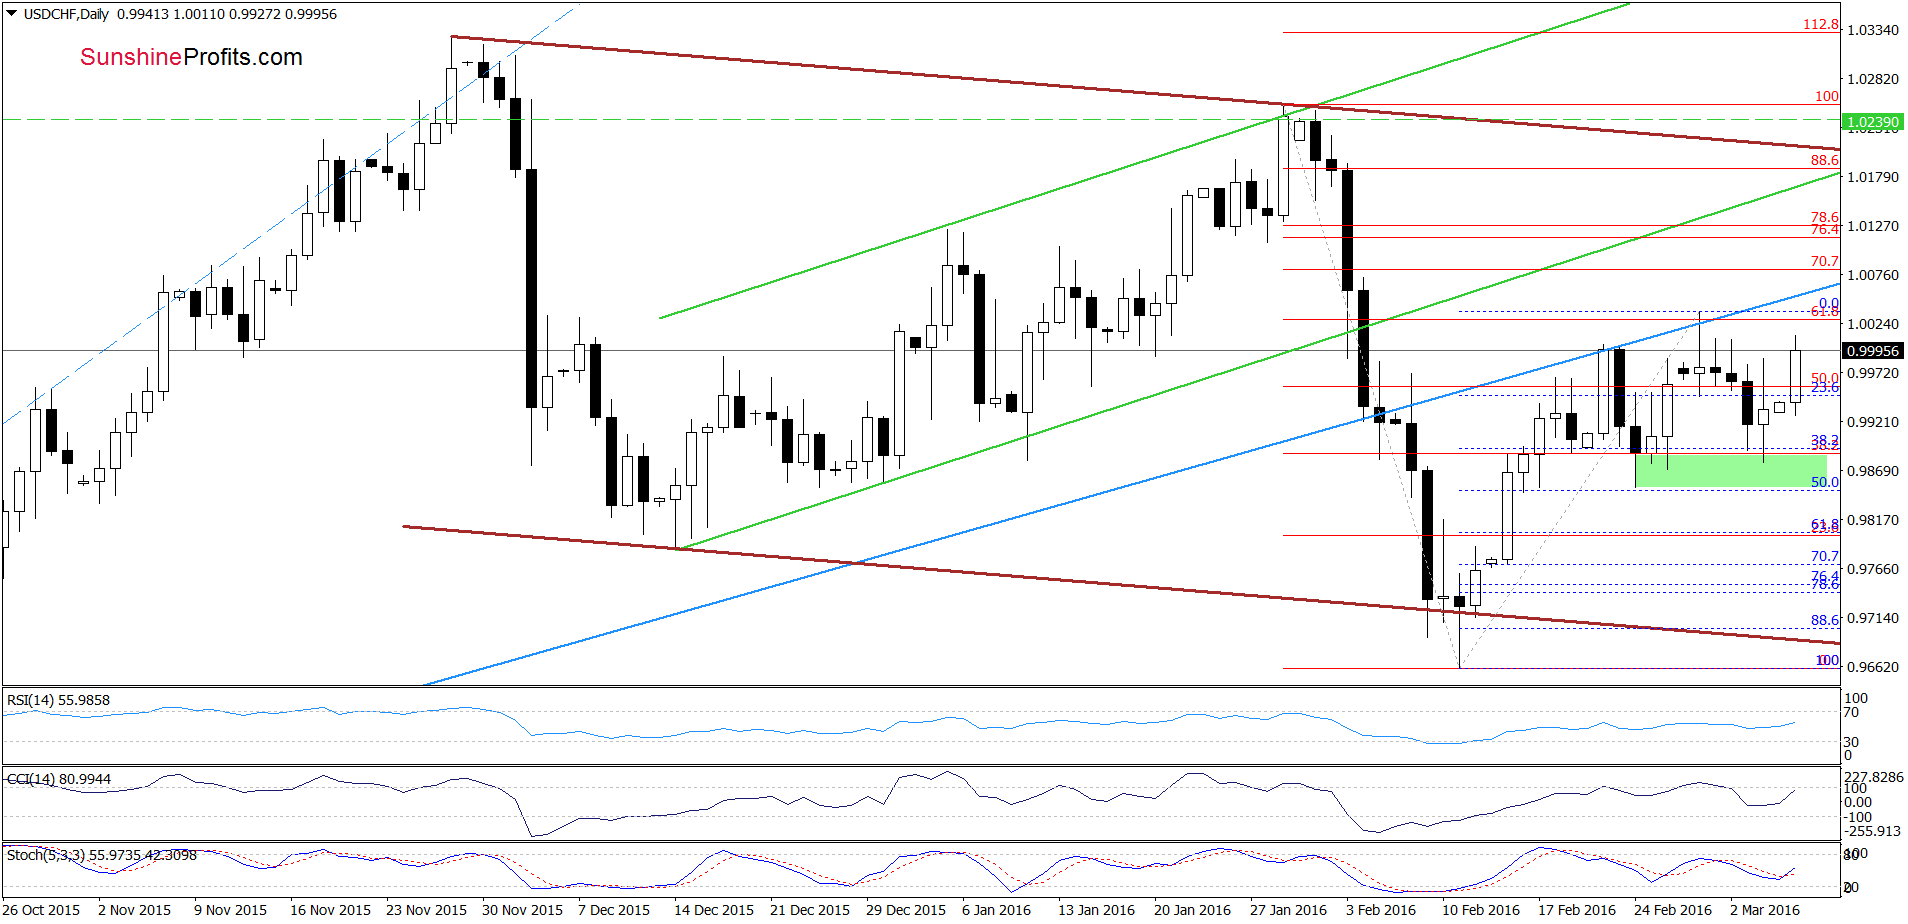
As you see on the charts, USD/CHF declined to the 38.2% Fibonacci retracement and approached the green support zone (based on the previous lows), which encouraged currency bulls to act. As a result, the exchange rate rebounded sharply and approached the previous highs. Despite this improvement, we think that as long as there is no invalidation of the breakdown under the blue resistance line another bigger upward move is questionable. Nevertheless, if we see such price action, we’ll consider re-opening long positions.
Very short-term outlook: mixed with bullish bias
Short-term outlook: mixed
MT outlook: mixed
LT outlook: mixed
Trading position (short-term; our opinion): No positions are justified from the risk/reward perspective. We will keep you informed should anything change, or should we see a confirmation/invalidation of the above.
AUD/USD
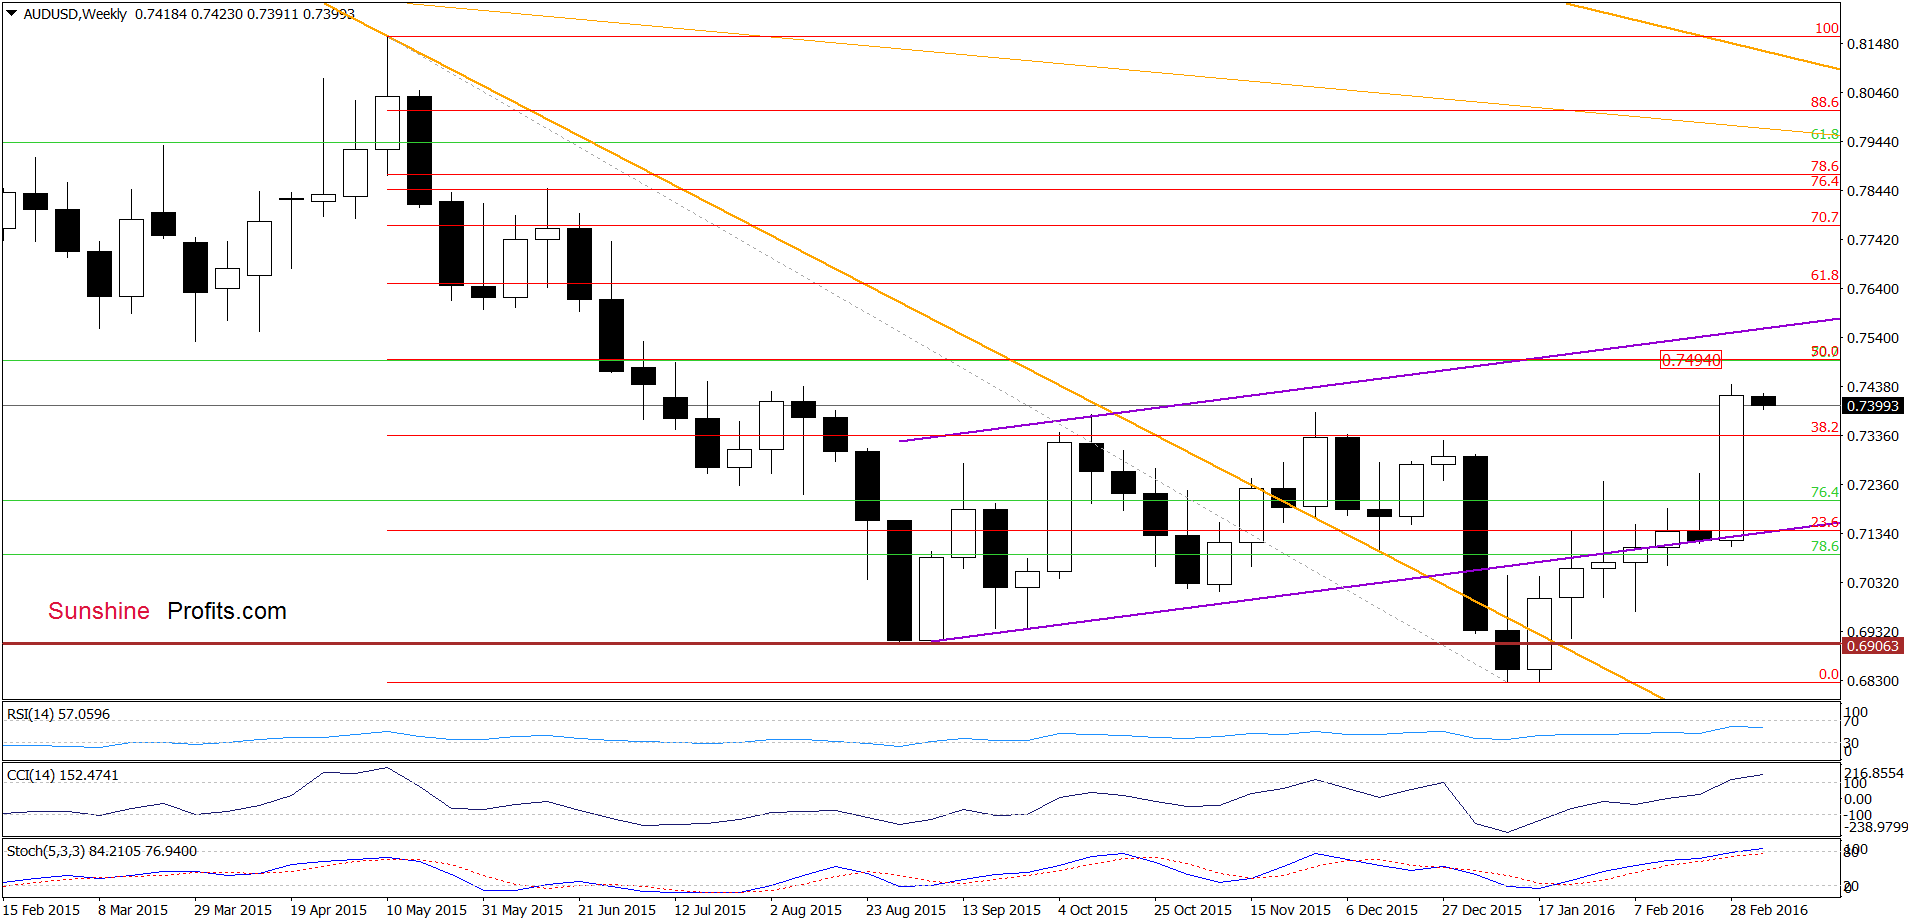
The medium-term picture improved as AUD/USD bounced off the lower border of the purple rising trend channel and climbed above the 38.3% Fibonacci retracement based on the entire May-Jan downward move. This is a positive signal, which suggests that we’ll likely see a test of the next retracement (around 0.7500) or even the higher border of the formation.
Are there any short-term factors that could hinder the realization of the above scenario? Let’s take a look at the daily chart and find out.
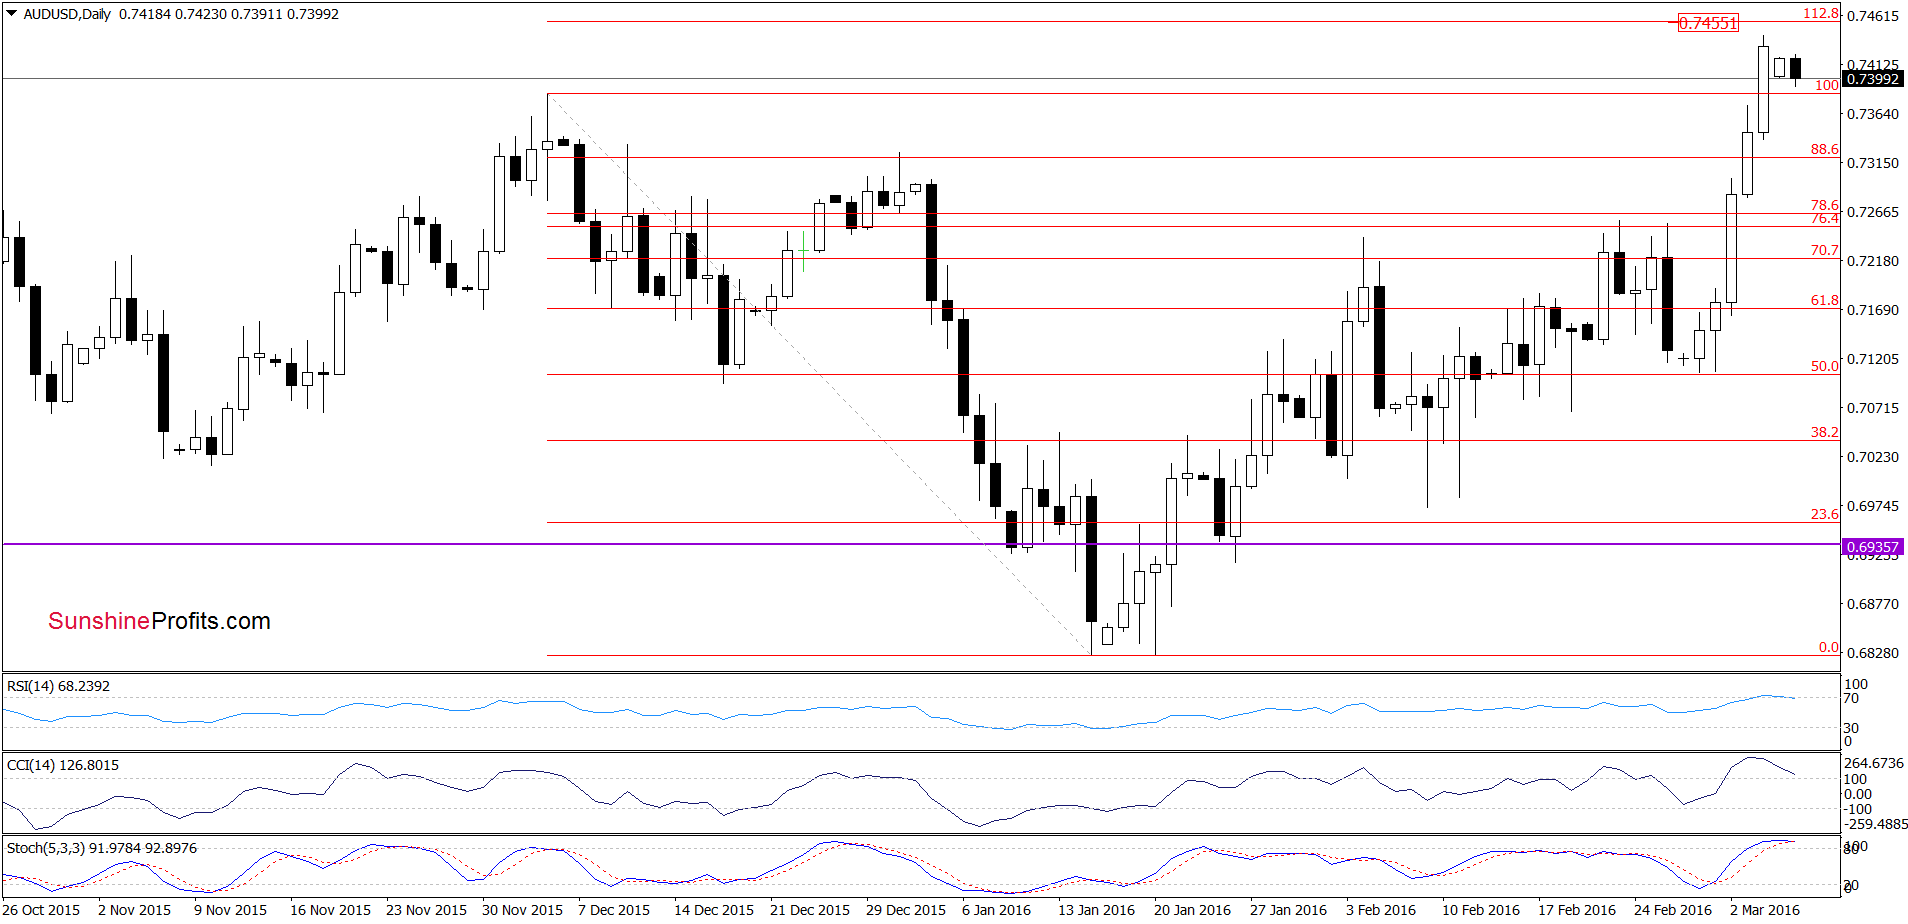
From this perspective, we see that AUD/USD broke above the previous highs, which suggests an increase to the 112.8% (around 0.7455) or even 127.2% Fibonacci extension (around 0.7535) in the coming days. Nevertheless, we should keep in mind that all indicators are overbought, which suggests that reversal is just around the corner.
Very short-term outlook: mixed with bullish bias
Short-term outlook: mixed
MT outlook: mixed
LT outlook: mixed
Trading position (short-term; our opinion): No positions are justified from the risk/reward perspective. We will keep you informed should anything change, or should we see a confirmation/invalidation of the above.
Thank you.
Nadia Simmons
Forex & Oil Trading Strategist
Przemyslaw Radomski, CFA
Founder, Editor-in-chief
Gold & Silver Trading Alerts
Forex Trading Alerts
Oil Investment Updates
Oil Trading Alerts

