

Earlier today, the U.S. dollar reversed and increased against its Canadian counterpart after the price of crude oil moved lower once again. As a result, USD/CAD approached the previously-broken upper border of the rising trend channel. Verification of the breakdown or further rally?
In our opinion the following forex trading positions are justified - summary:
- EUR/USD: short (stop-loss order at 1.1363; initial downside target at 1.0462)
- GBP/USD: none
- USD/JPY: none
- USD/CAD: none
- USD/CHF: none
- AUD/USD: none
EUR/USD
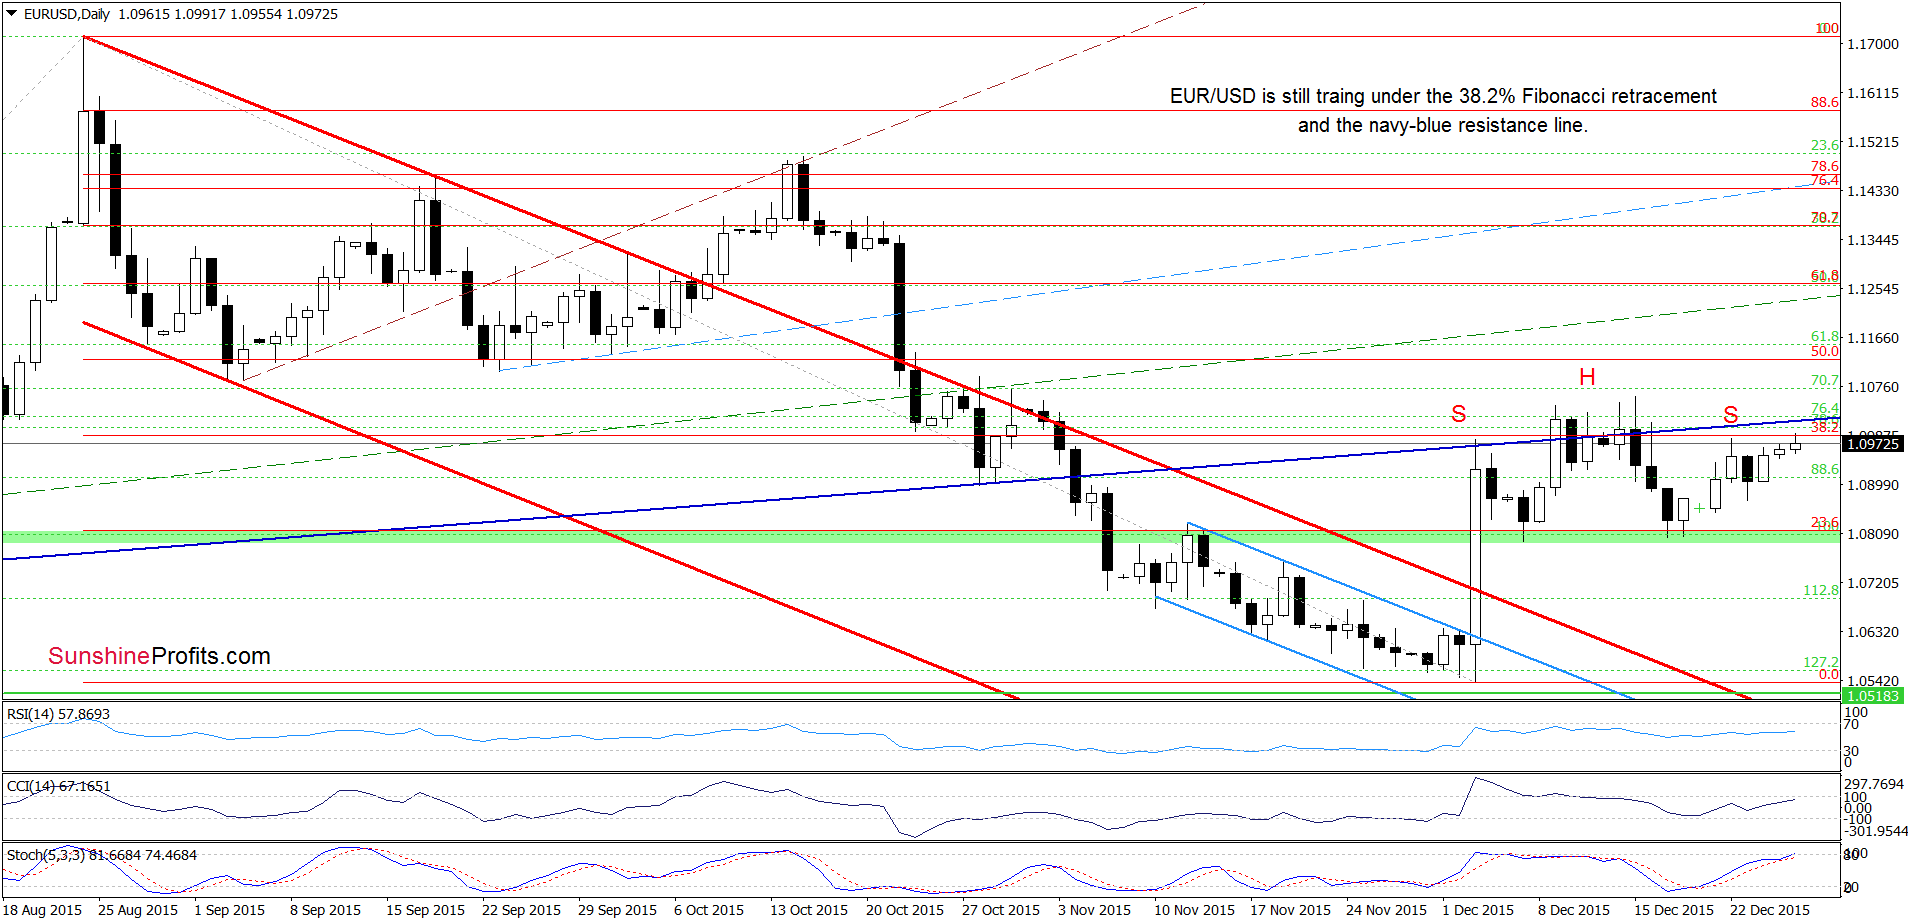
Looking at the daily chart, we see that EUR/USD reversed and increased to the key short-term resistance area created by the combination of the 38.2% Fibonacci retracement and the navy blue resistance line. In previous weeks, it was strong enough to stop further rally, which suggests that we may see a similar price action in near future. Therefore, in our opinion, as long as there is no breakout above this zone, further increases are doubtful. At this point, it is also worth noting that the current position of daily indicators suggests a reversal and lower values of the exchange rate in the coming days.
Are there any other factors that could encourage currency bears to act?
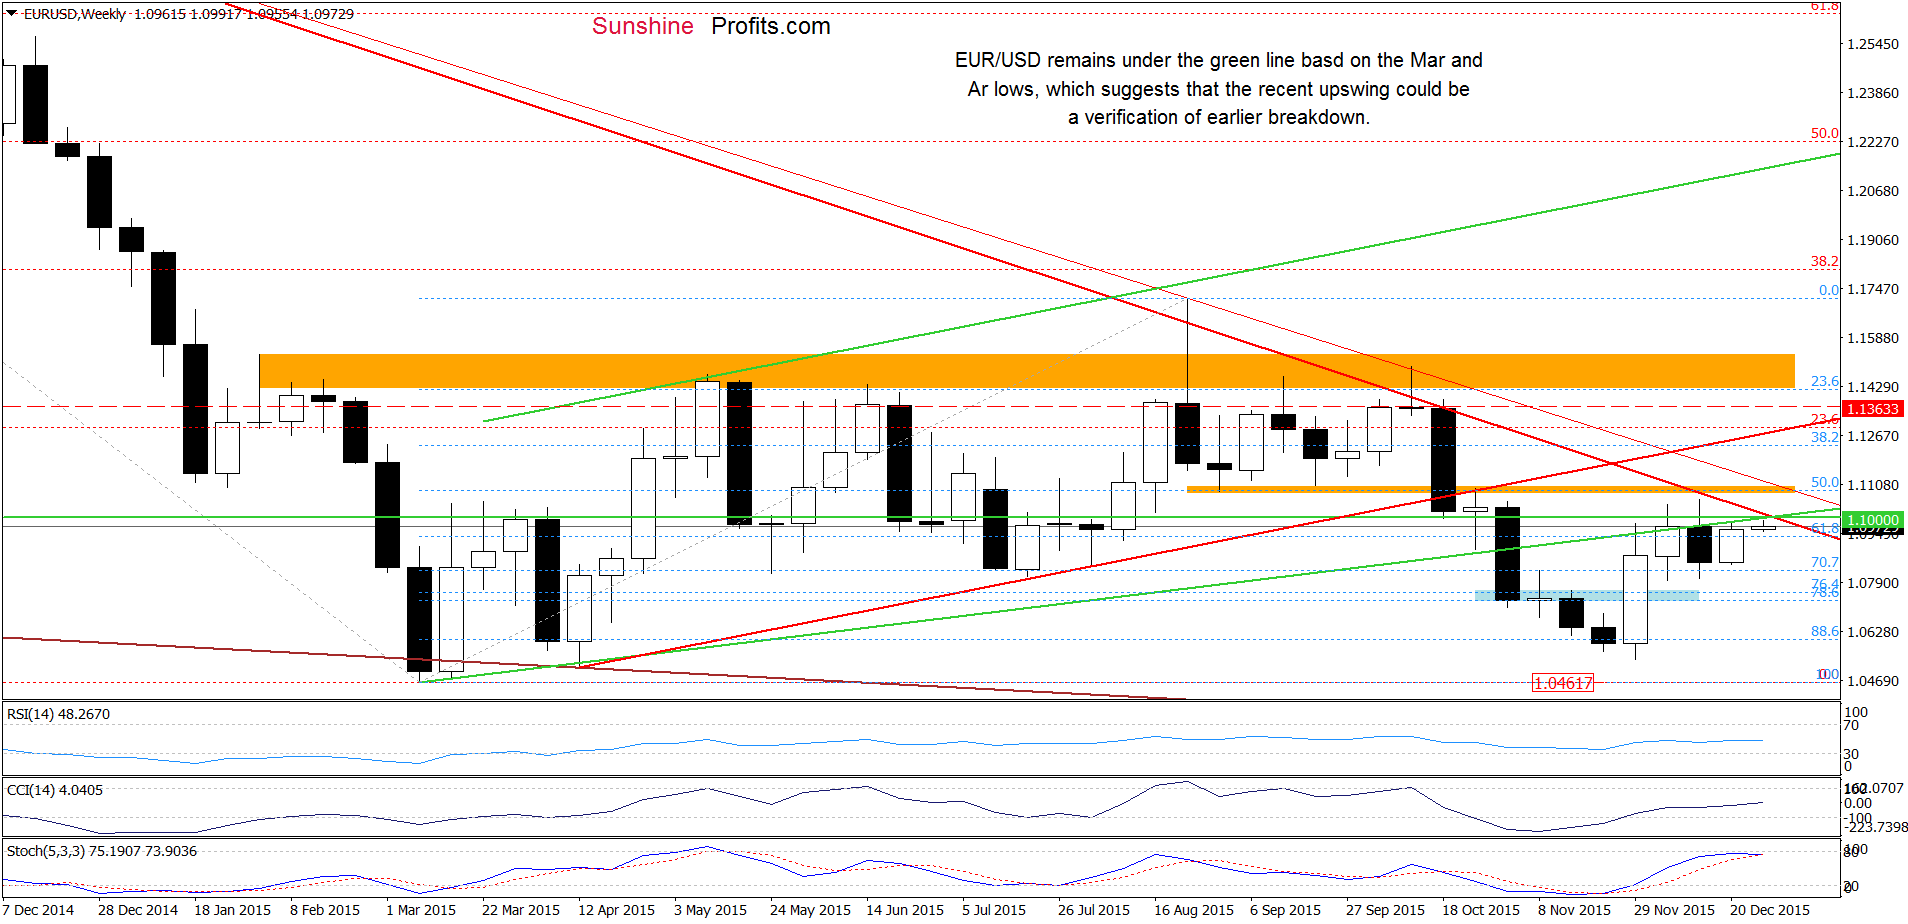
From this perspective, we see that the combination of the previously-broken green resistance line, the barrier of 1.1000 and the orange resistance zone continues to keep gains in check. Additionally, the pair reached long-term red declining resistance line, which has successfully stopped currency bulls several times in the past. Taking all the above into account, and the position of the weekly Stochastic Oscillator (it is very close to generating a sell signal), we believe that reversal and declines from here are just around the corner.
Very short-term outlook: bearish
Short-term outlook: bearish
MT outlook: bearish
LT outlook: mixed
Trading position (short-term; our opinion): Short positions (with a stop-loss order at 1.1363 and the initial downside target at 1.0462) are justified from the risk/reward perspective. We will keep you informed should anything change, or should we see a confirmation/invalidation of the above.
USD/CAD
Quoting our last commentary on this currency pair:
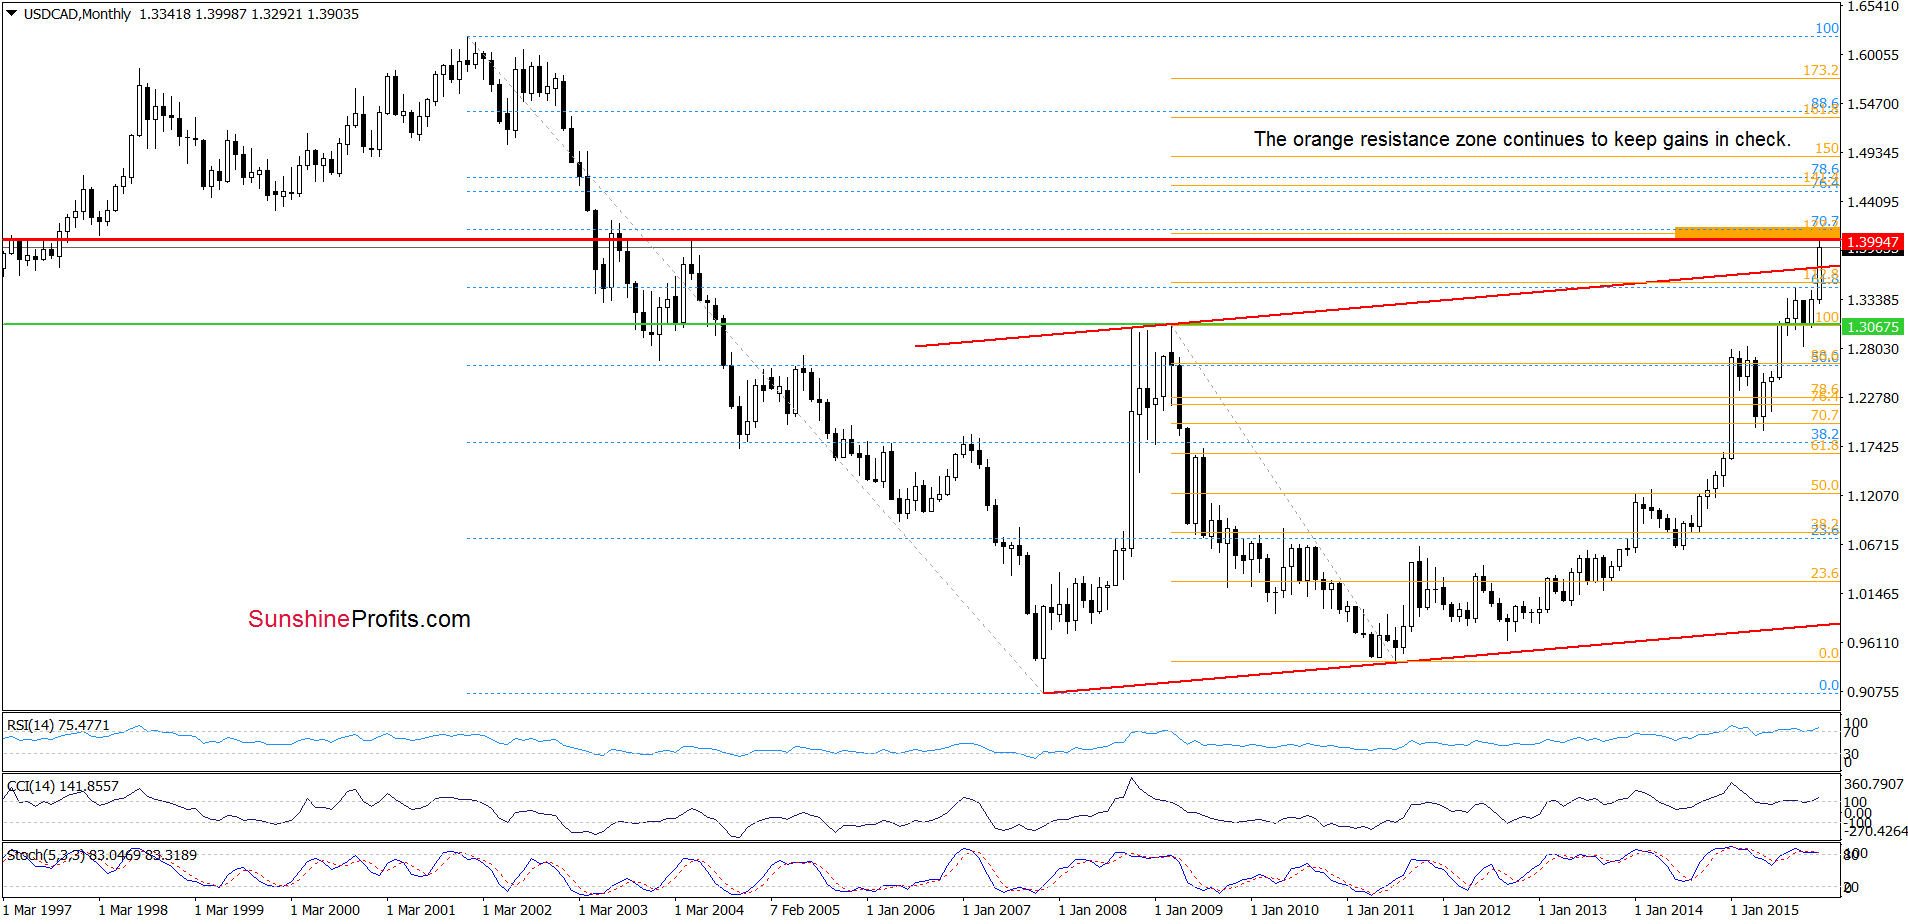
(…) the exchange rate approached the red line and the orange resistance zone created by the 27.2% Fibonacci extension and the 70.7% Fibonacci retracement based on the Jan 2002-Nov 2007 declines. Taking into account the current position of the daily and monthly indicators, we think that this solid resistance area will stop further rally and trigger a pullback in the coming week.
As you see on the long-term chart, the situation developed in line with the above scenario and USD/CAD moved slightly lower. What impact did this move have on the very short-term chart? Let’s check.
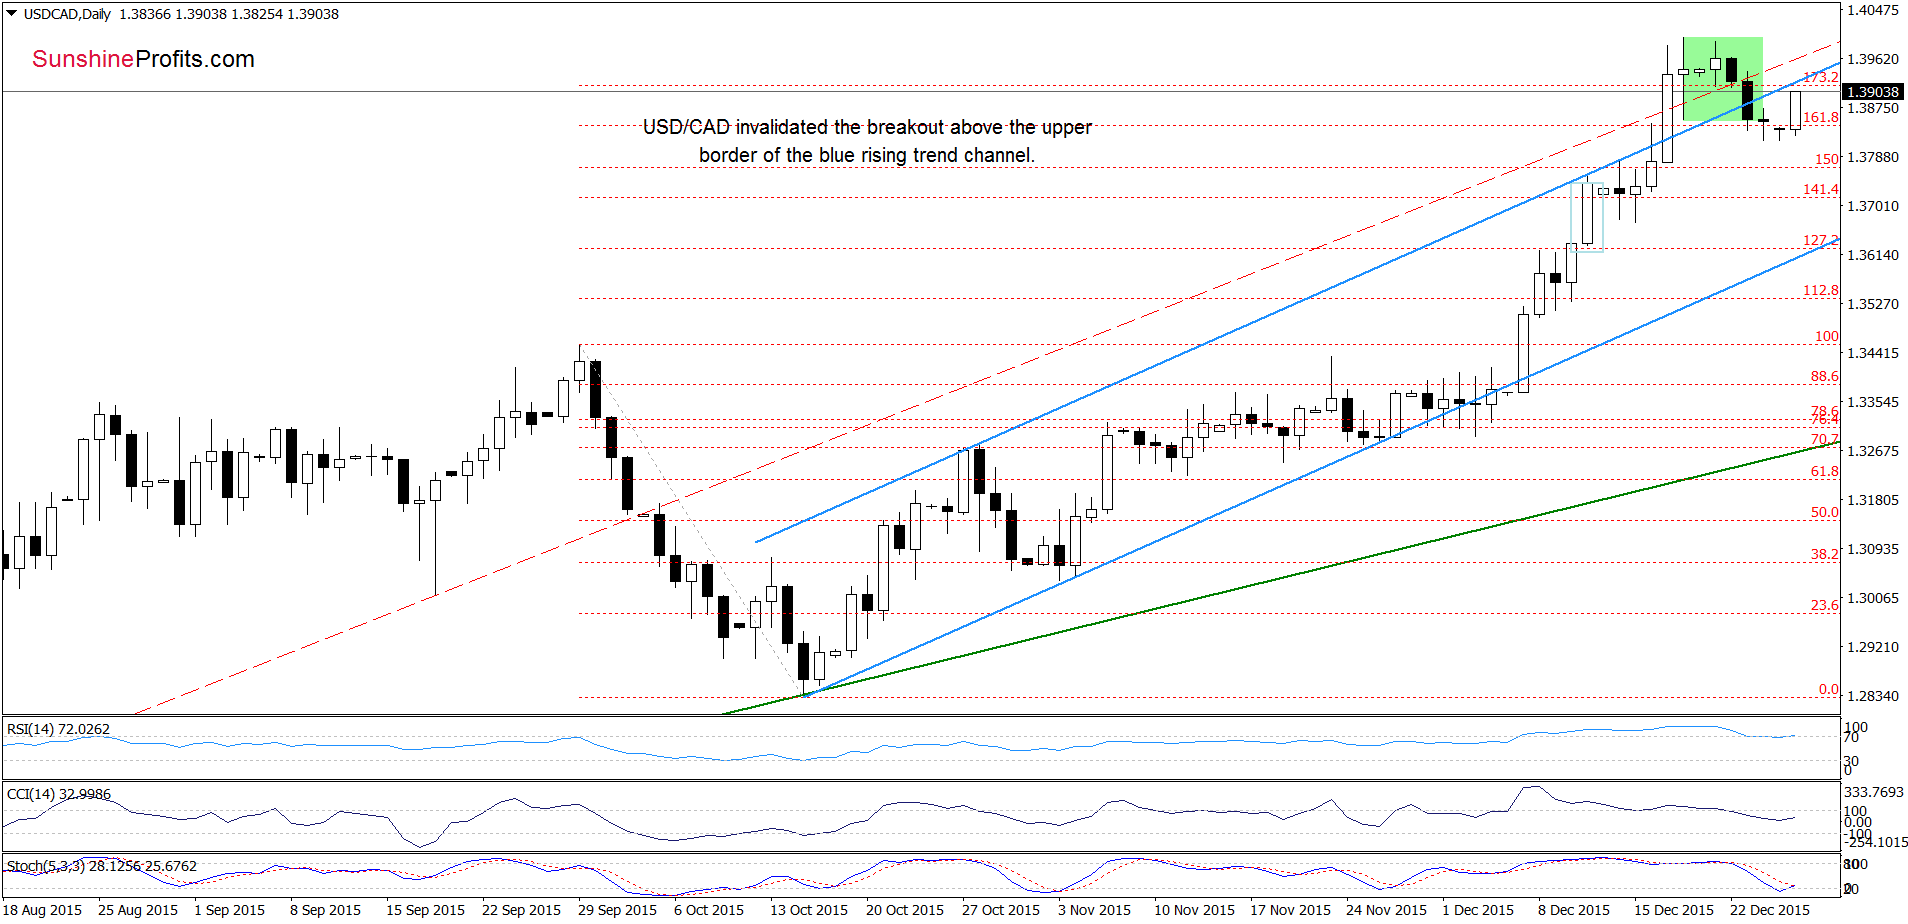
From today’s point of view, we see that USD/CAD pulled back and dropped under the previously-broken upper border of the blue trend channel in the previous week. Although this downswing invalidated earlier breakout, currency bulls managed to stop their opponents and trigger a reversal, which suggests a test of the blue line. If the pair declines from there, the recent upswing would be just a verification of earlier breakdown (in this case, the initial downside target would be around 1.3817). However, taking into account the current position of the Stochastic Oscillator (it is very close to generating a buy signal), it seems that we’ll see further improvement and a test of the Dec highs in the coming days.
Very short-term outlook: mixed
Short-term outlook: mixed
MT outlook: mixed
LT outlook: mixed
Trading position (short-term; our opinion): No positions are justified from the risk/reward perspective at the moment. We will keep you informed should anything change, or should we see a confirmation/invalidation of the above.
AUD/USD
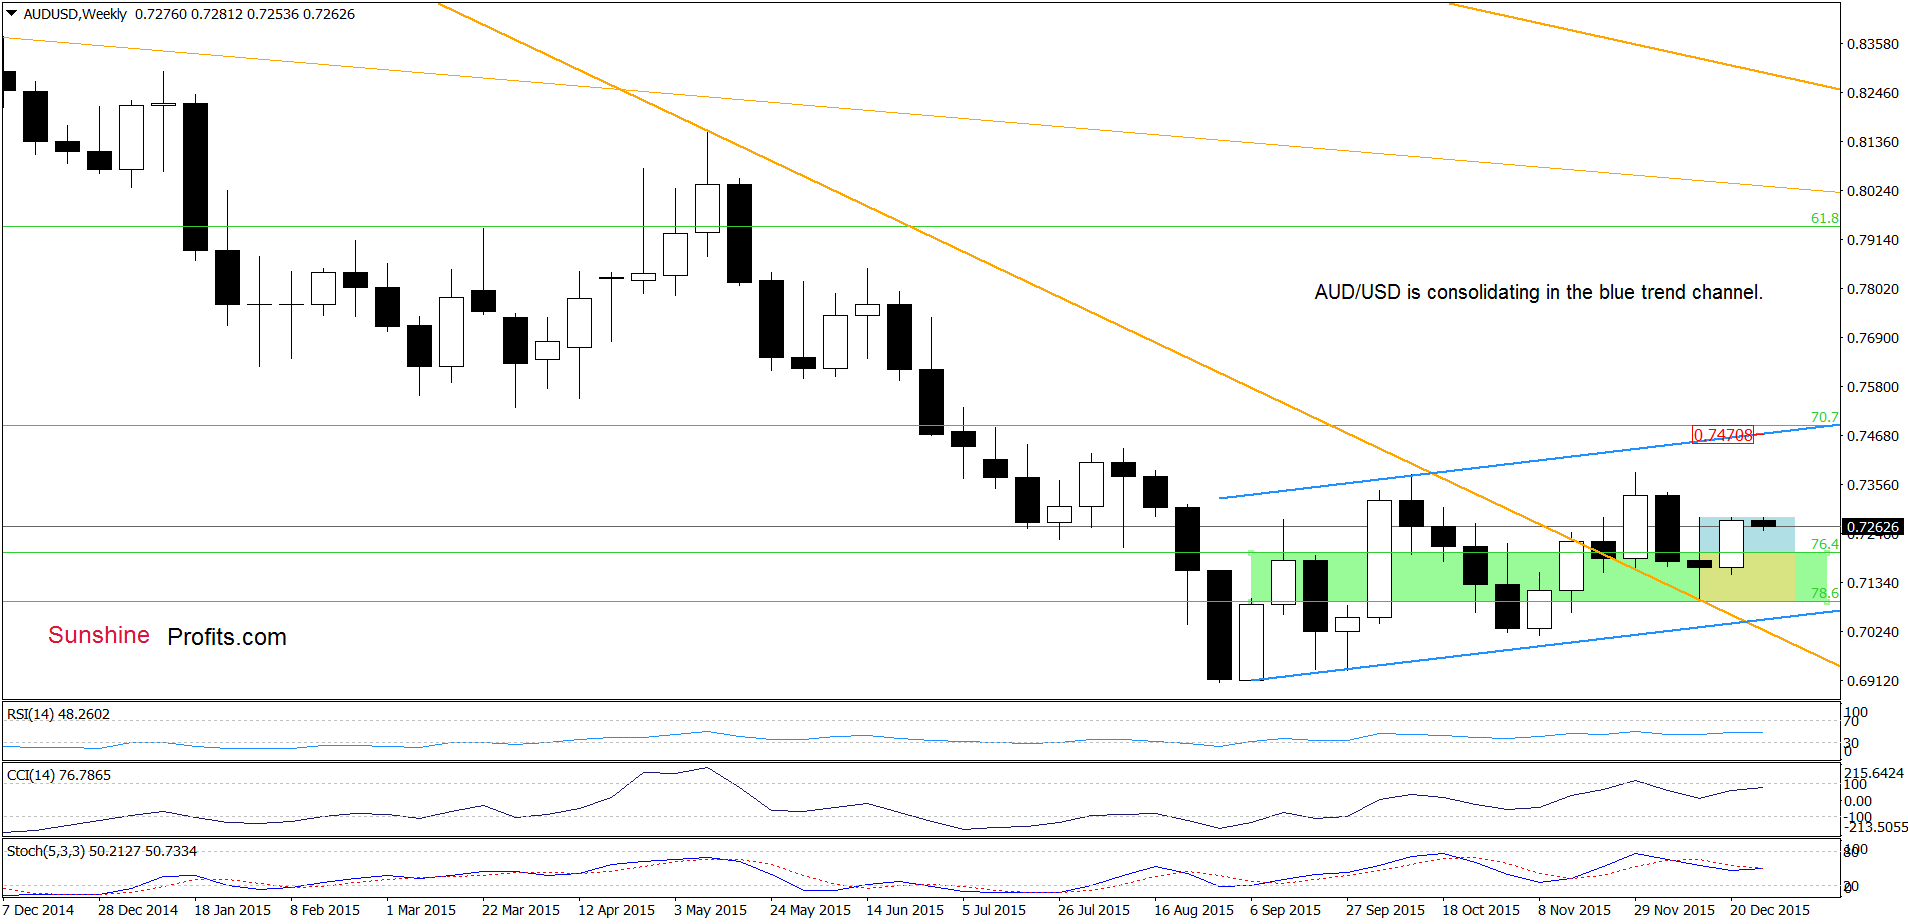
Looking at the weekly chart, we see that AUD/USD is consolidating above the orange support line and the green support zone, which makes the medium-term picture unclear.
Will the daily chart give us more clues about future moves? Let’s check.
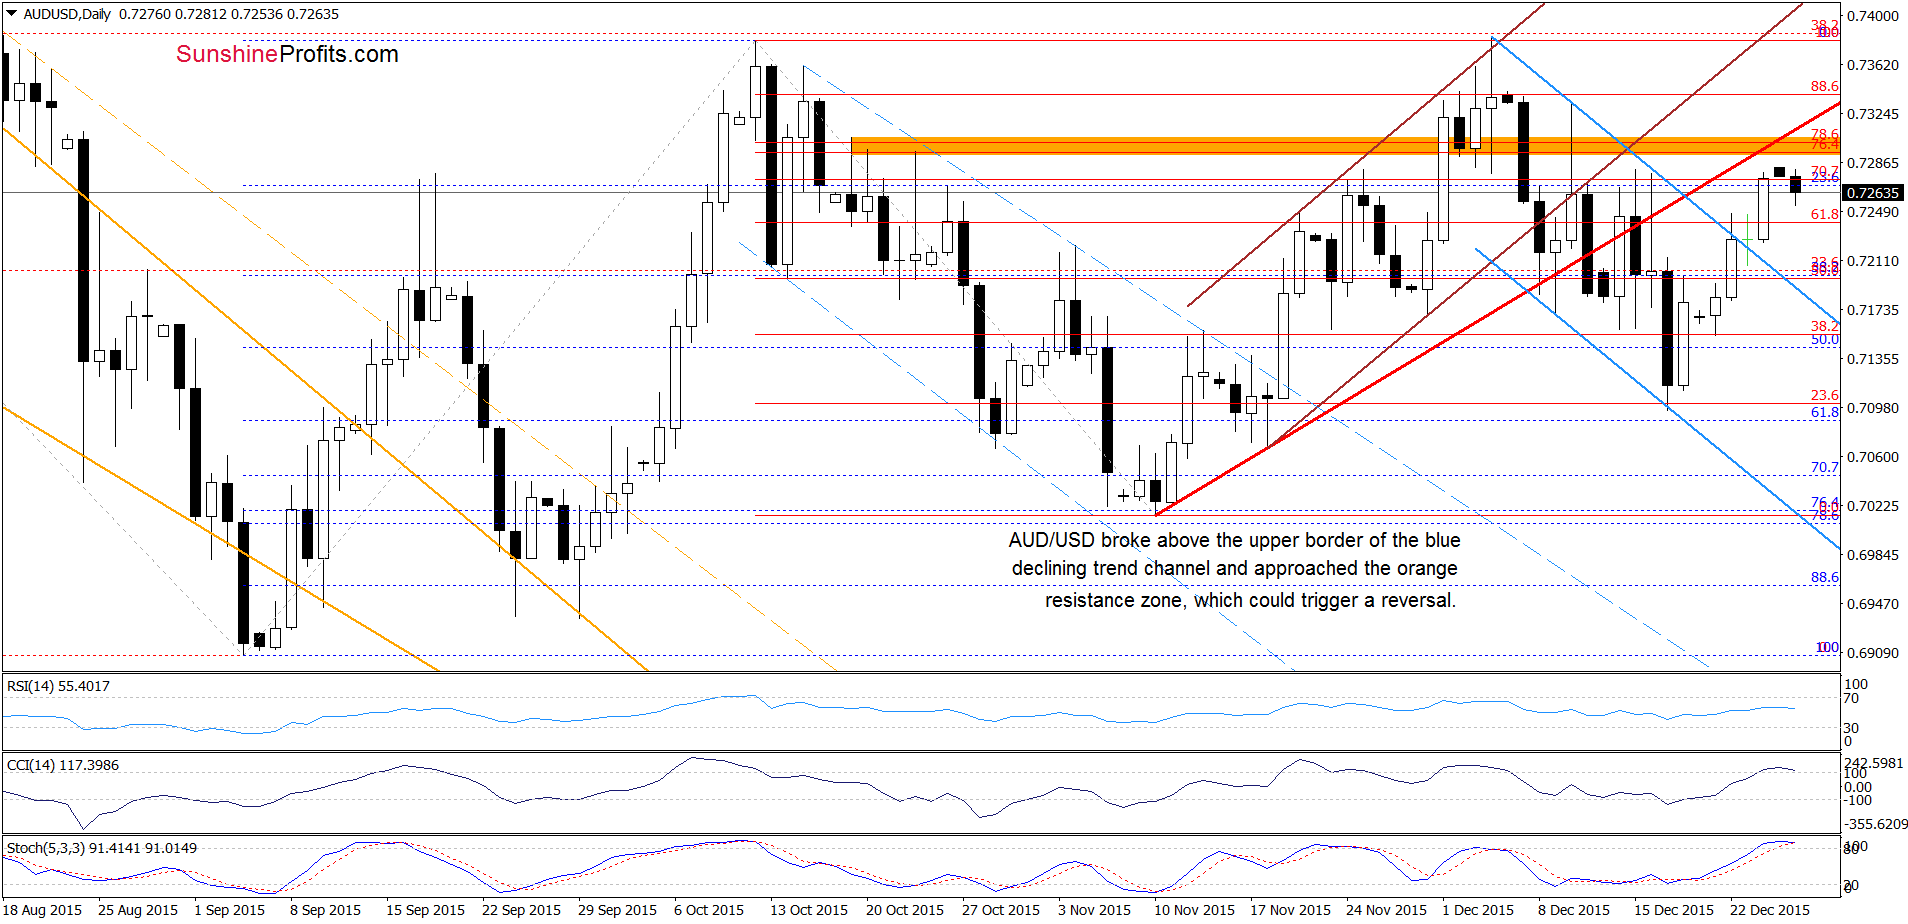
Quoting our Wednesday’s alert:
(…) AUD/USD broke above the upper line of the blue declining trend channel. This is a positive signal, which suggests a test of the orange resistance zone in the coming days (please note that buy signals generated by the indicators support currency bulls).
On the daily chart, we see that currency bulls approached the exchange rate to our upside target as we had expected. Despite this move, the proximity to the orange zone and the red rising resistance line triggered a pullback – similarly to what we saw earlier this month. Taking this fact into account, and combining it with the current position of the indictors (they are very close to generating sell signals), we think that further deterioration is just around the corner. If this is the case, and AUD/USD declines from here, we’ll see a test of the previously-broken upper line of the blue declining trend channel in the coming days.
Very short-term outlook: mixed with bearish bias
Short-term outlook: mixed
MT outlook: mixed
LT outlook: mixed
Trading position (short-term; our opinion): No positions are justified from the risk/reward perspective at the moment. We will keep you informed should anything change, or should we see a confirmation/invalidation of the above.
Thank you.
Nadia Simmons
Forex & Oil Trading Strategist
Przemyslaw Radomski, CFA
Founder, Editor-in-chief
Gold & Silver Trading Alerts
Forex Trading Alerts
Oil Investment Updates
Oil Trading Alerts

