

Although yesterday’s disappointing jobless claims numbers pushed the USD Index lower, the greenback remains supported by rising expectations that the Fed will raise interest rates for the first time since 2006 at its upcoming meeting on December 15-16. Will the technical picture of the U.S. dollar against other currency pairs give us more clues about future moves?
In our opinion the following forex trading positions are justified - summary:
EUR/USD
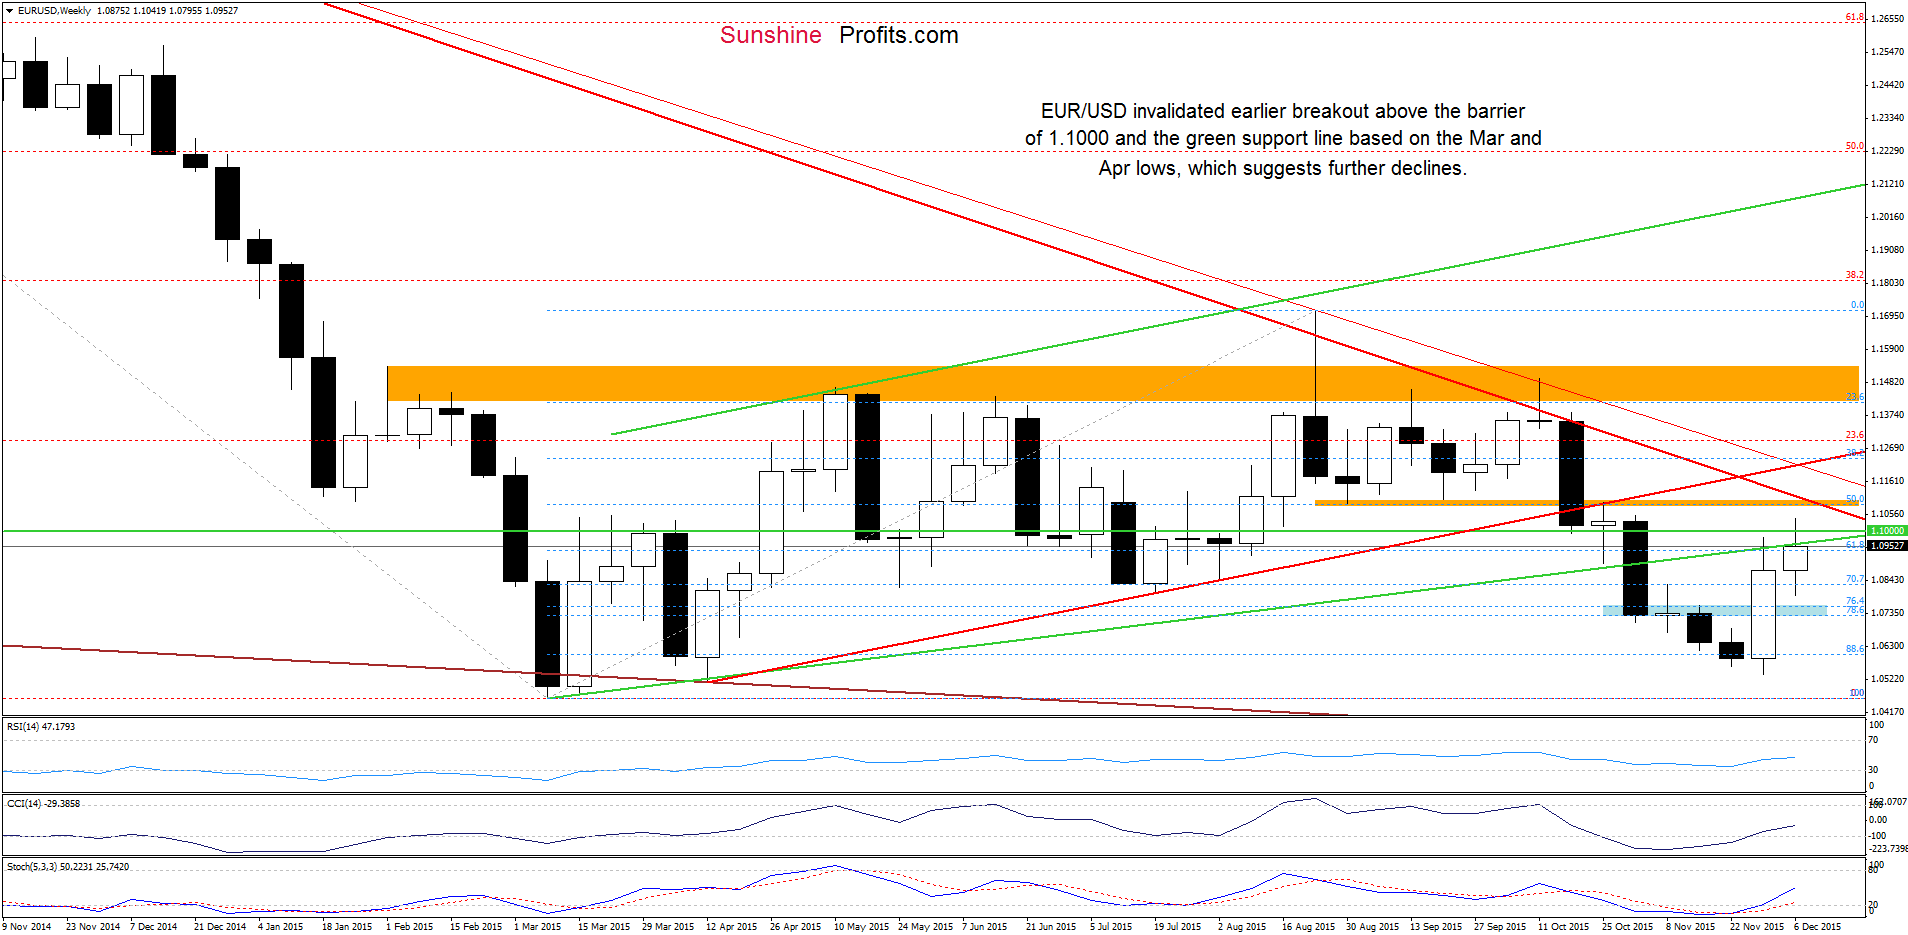
Looking at the weekly chart, we see that EUR/USD is still trading under the previously-broken barrier of 1.1000 and the green line based on the Mar and Apr lows, which suggests that another downswing is likely (especially if the pair closes the week under these resistance levels).
Having said that, let’s focus on the daily chart.
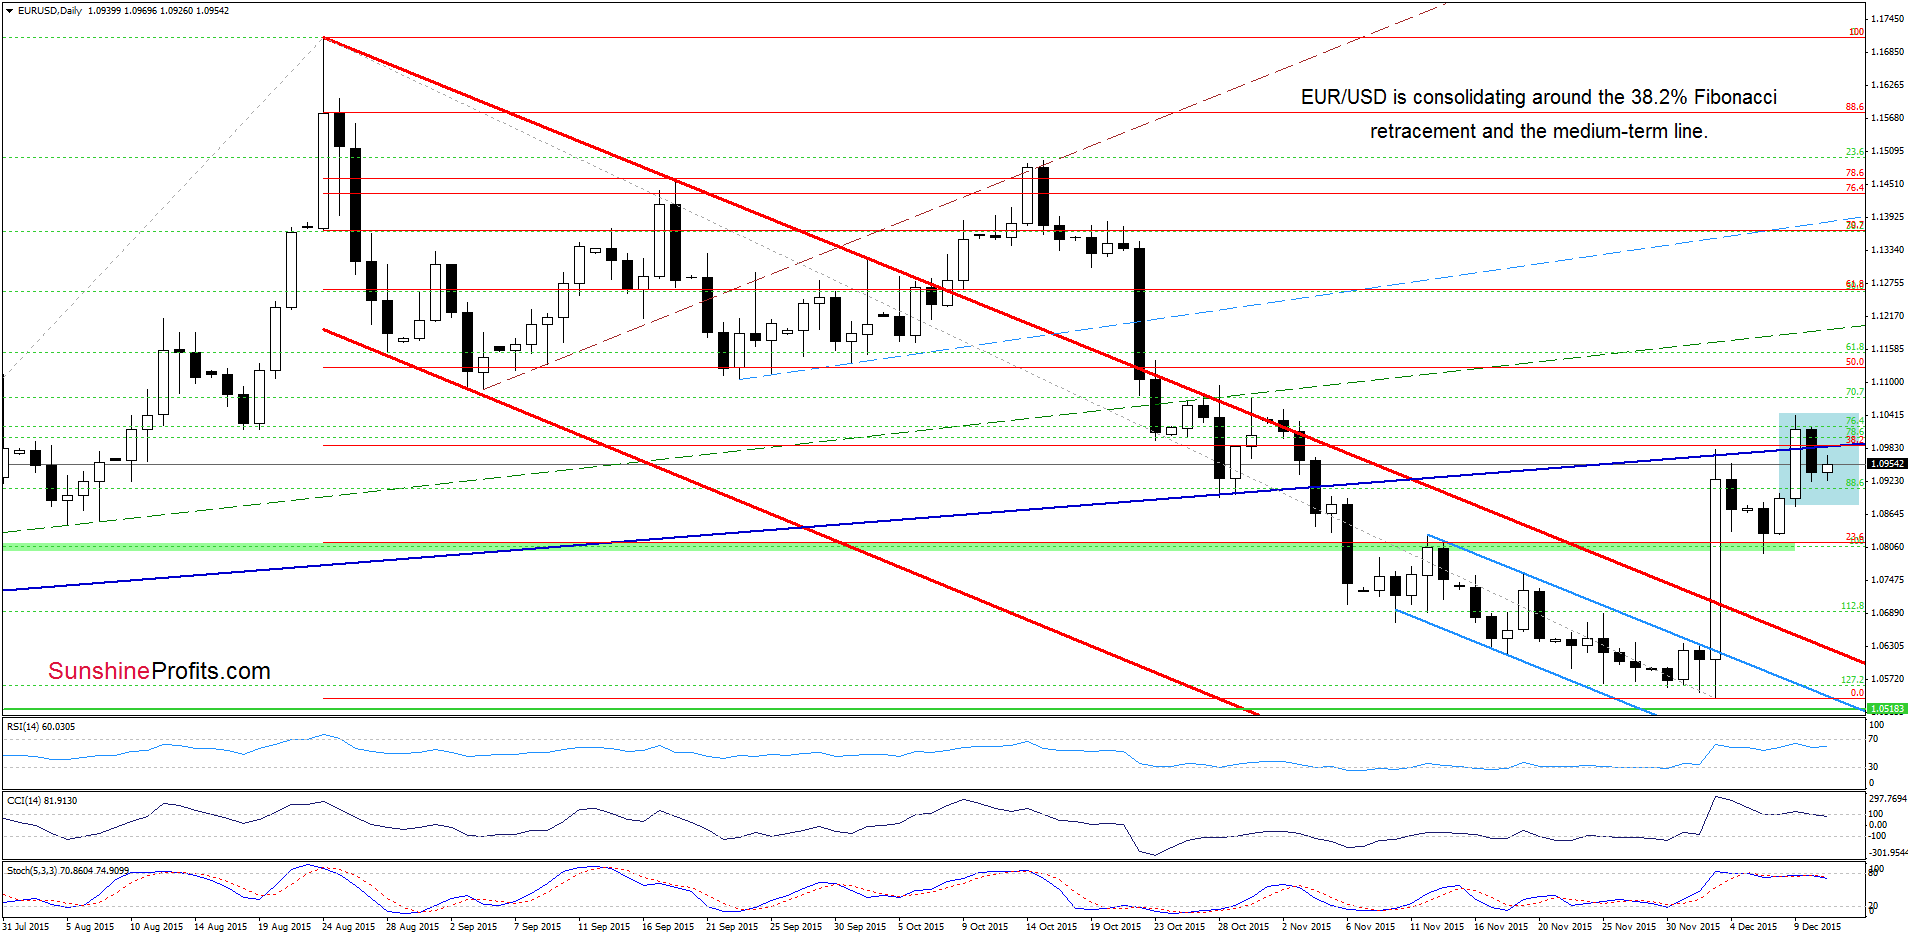
From this perspective, we see that EUR/USD closed the day under the 38.2% Fibonacci retracement and the navy blue support/resistance line. Although this is a negative signal, which suggests further declines, we think that as long as the exchange rate remains in a consolidation (marked with blue) another sizable move is not likely to be seen. Nevertheless, please keep in mind that the current position of the indicators suggests that reversal and lower values of EUR/USD are just around the corner.
Very short-term outlook: mixed
Short-term outlook: mixed
MT outlook: mixed
LT outlook: mixed
Trading position (short-term; our opinion): No positions are justified from the risk/reward perspective at the moment. Nevertheless, we’ll consider re-opening short positions if EUR/USD declines and closes the day below the green support zone. We will keep you informed should anything change, or should we see a confirmation/invalidation of the above.
GBP/USD
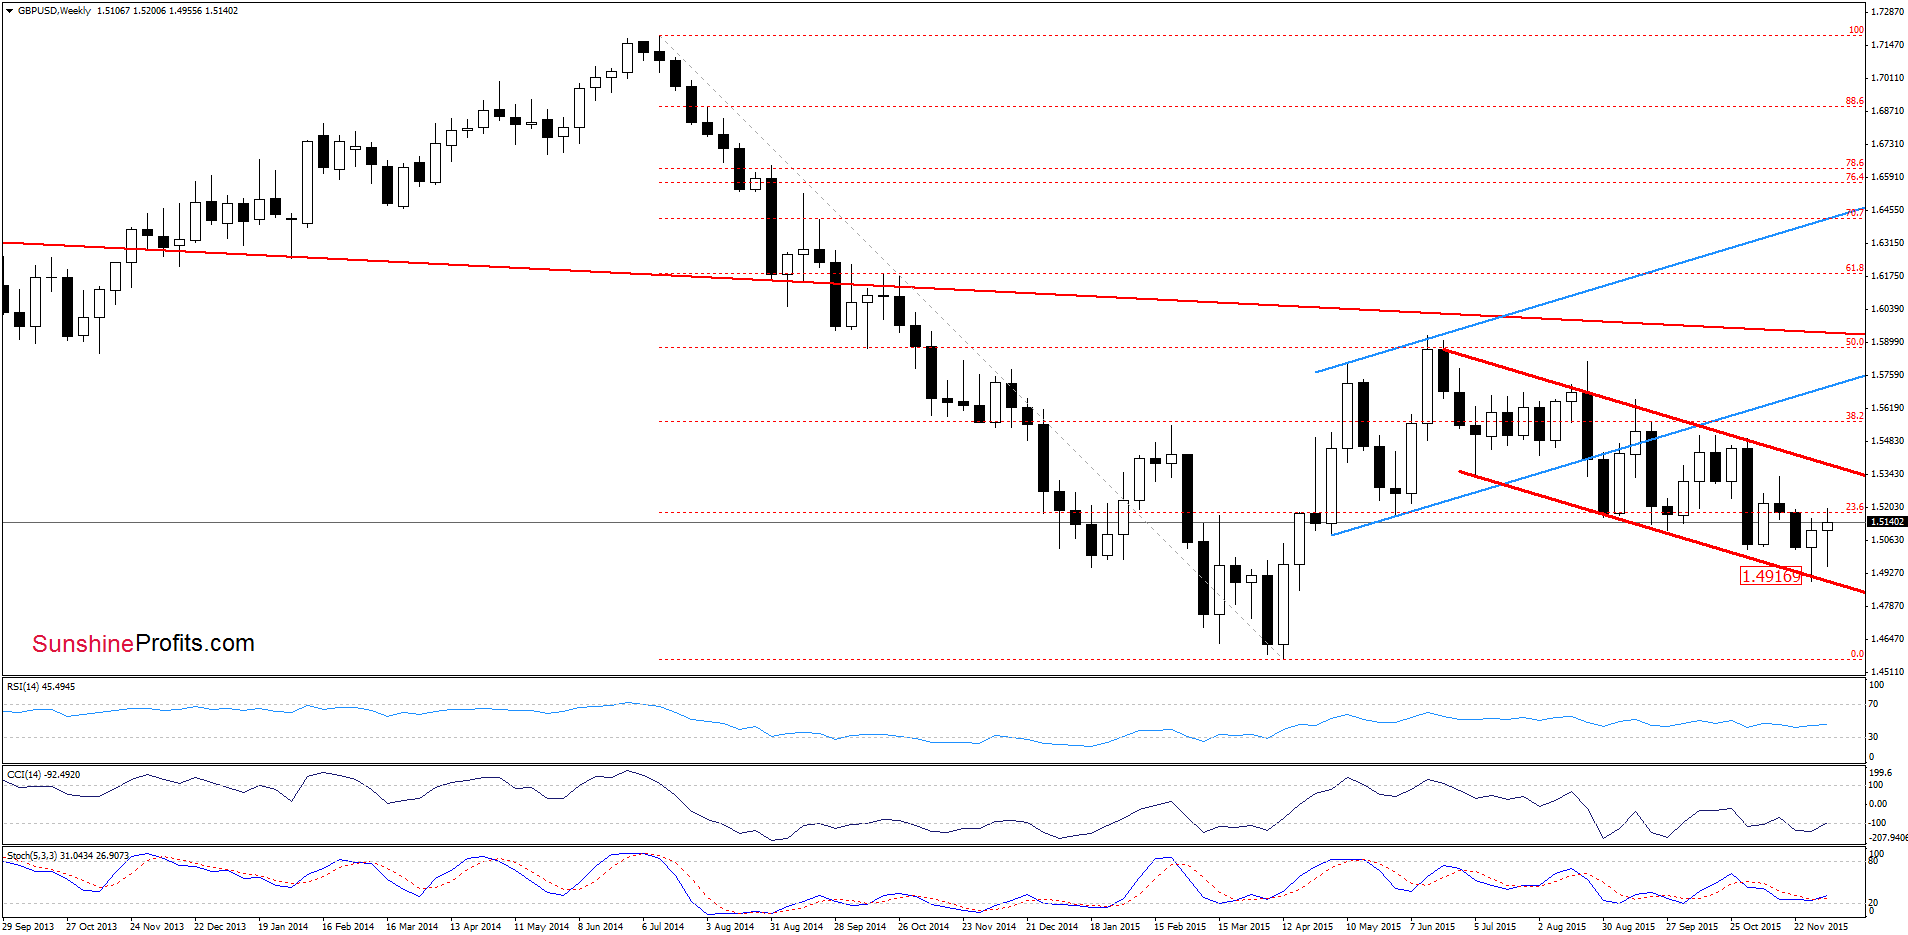
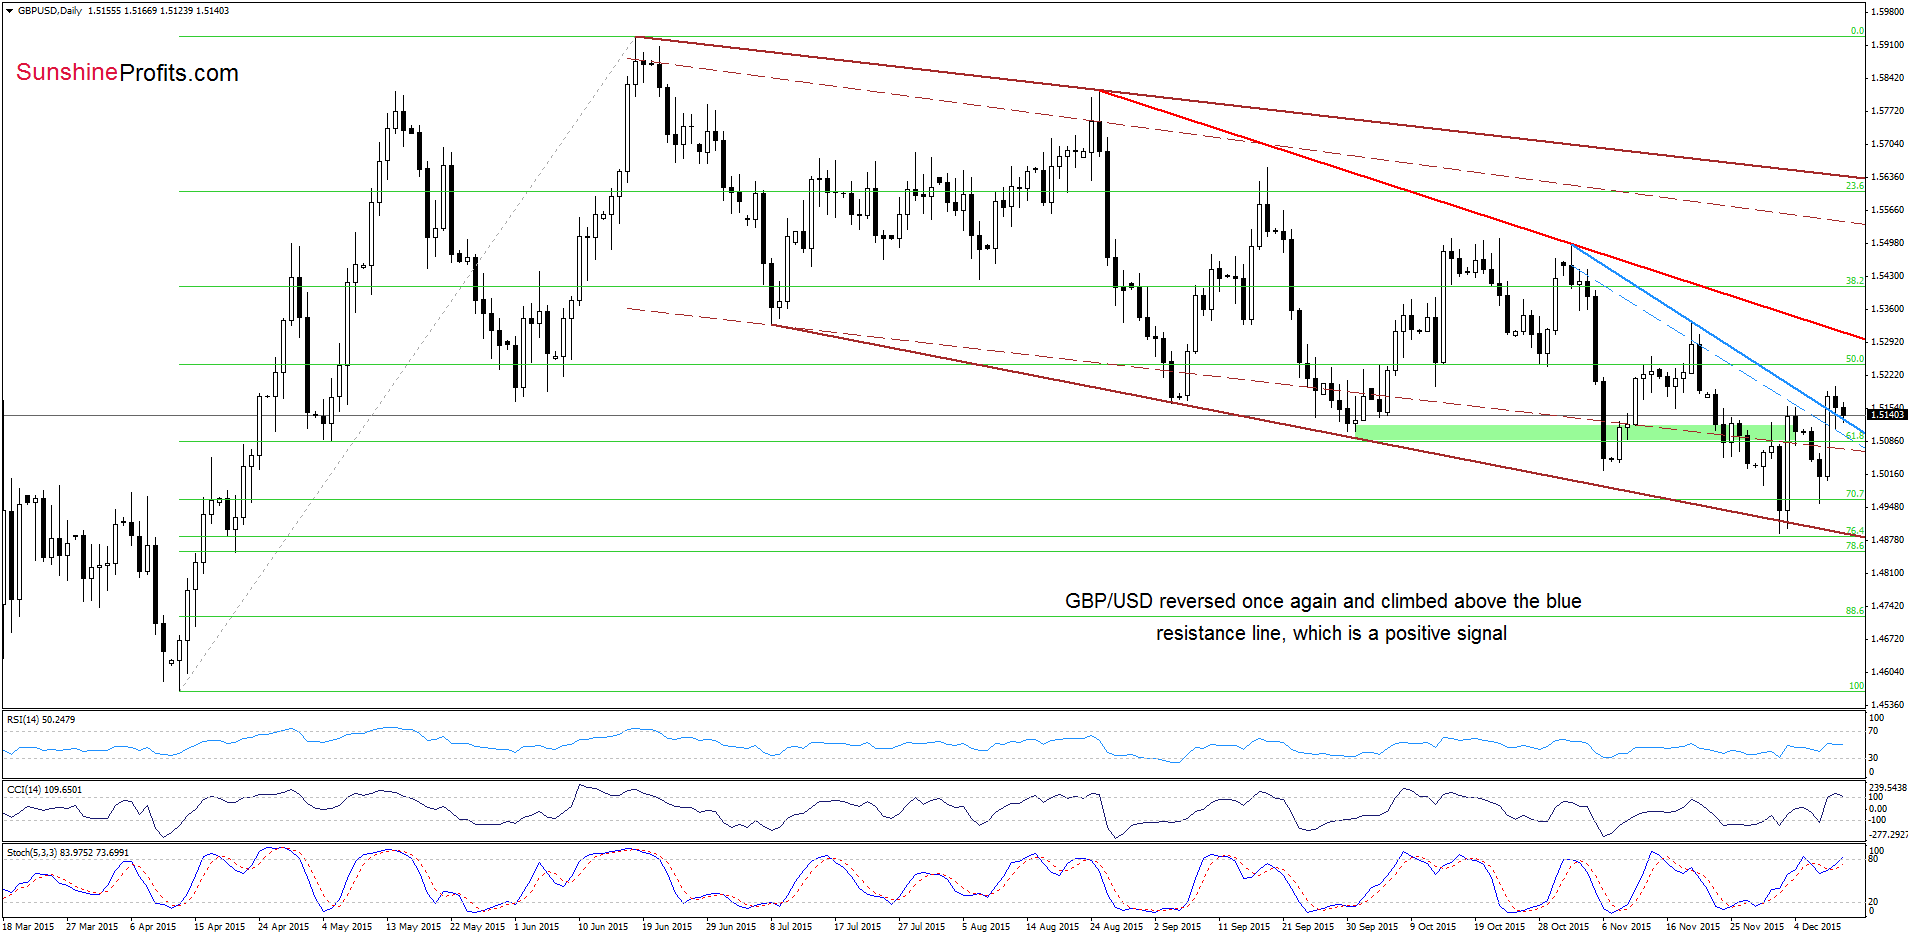
From today’s point of view we see that GBP/USD reversed once again and rebounded sharply, which resulted in a climb above the blue resistance line based on the previous highs. Although this is a positive signal, which suggests further improvement, the exchange rate gave up some gains in previous days, which looks like a verification of earlier breakout. Therefore, if the blue line withstood the selling pressure, we’ll likely see an increase to around 1.5290, where the 38.2% Fibonacci retracement (based on the entire mid-Jun-Dec declines) and the red resistance line (based on the Aug and Nov highs) are. On the other hand, if the pair invalidates earlier breakout and closes today’s session under the above-mentioned support line, we’ll see another test of the 70.7% Fibonacci retracement in the coming week.
Very short-term outlook: mixed
Short-term outlook: mixed
MT outlook: mixed
LT outlook: mixed
Trading position (short-term; our opinion): No positions are justified from the risk/reward perspective at the moment. We will keep you informed should anything change, or should we see a confirmation/invalidation of the above.
USD/JPY
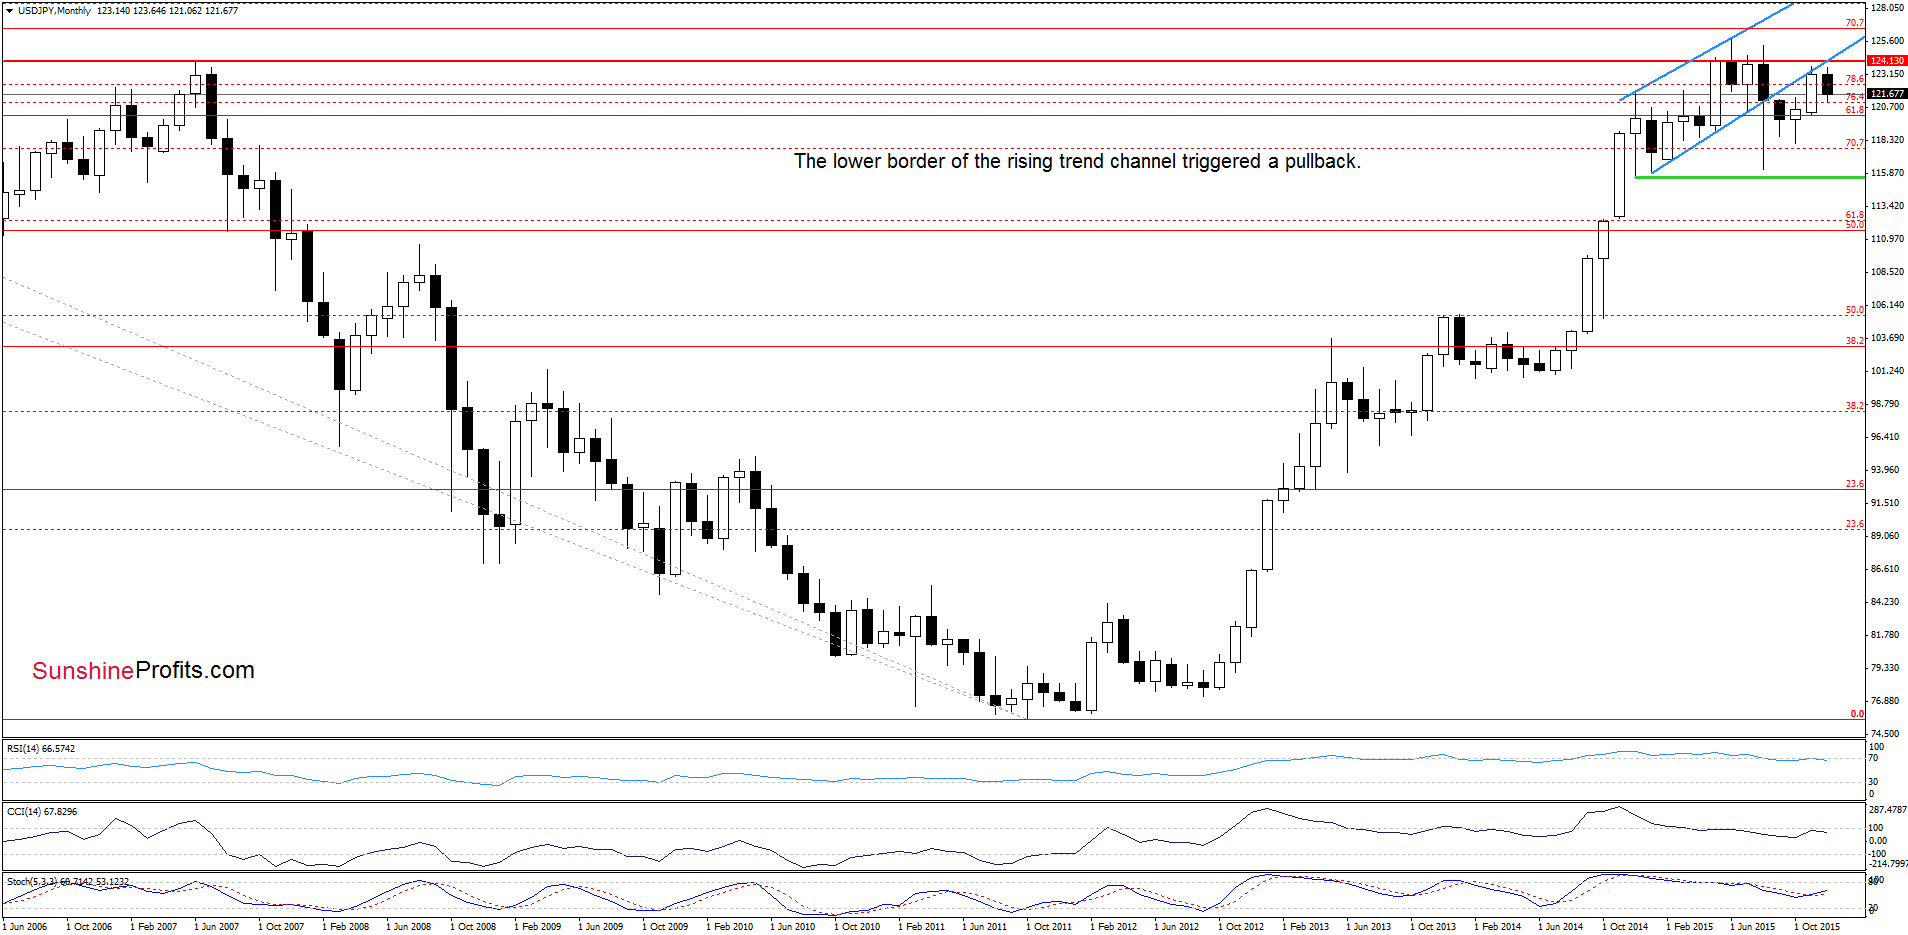
The lower border of the blue rising trend channel triggered a pullback. How did this mve affect the very short-term chart? Let’s examine the daily chart and find out.
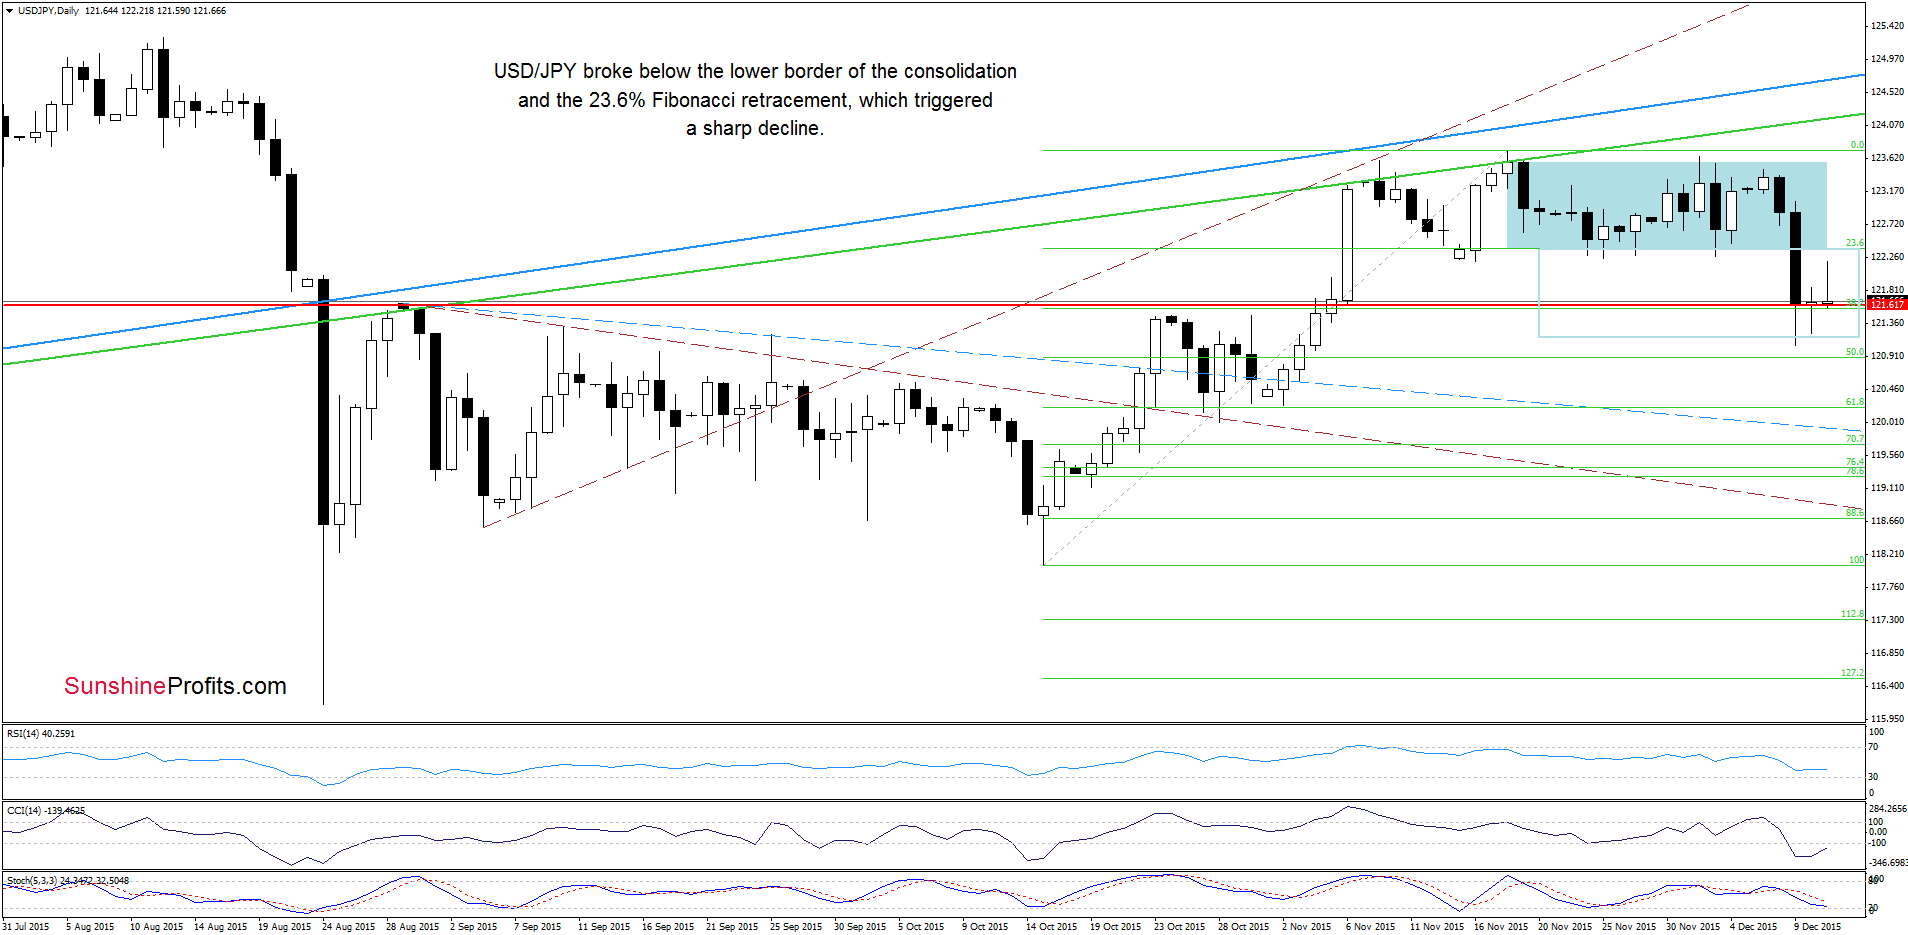
On Wednesday, we wrote the following:
(…) Finishing today’s commentary on this currency pair, please note that sell signals generated by the indicators suggests further deterioration. If this is the case, and USD/JPY closes the day under recent lows, we may see a decline to the red horizontal support line in the coming days.
From this perspective we see that the situation developed in line with the above scenario as USD/JPY broke below the lower border of the consolidation, triggering a sharp decline. With this downswing, the pair not only reached our downside target, but also approached the 50% Fibonacci retracement (based on the mid-Oct-Nov upward move). Earlier today, the exchange rate rebounded and climbed to the previous lows and the 23.6% retracement, which looks like a verification of earlier breakdown. If this is the case and USD/JPY declines from here, we’ll likely see a drop to around 120-120.22, where the 61.8% Fibonacci retracement and the bottom of the pullback that we saw at the end of Oct are.
Very short-term outlook: mixed with bearish bias
Short-term outlook: mixed
MT outlook: mixed
LT outlook: mixed
Trading position (short-term; our opinion): No positions are justified from the risk/reward perspective at the moment. We will keep you informed should anything change, or should we see a confirmation/invalidation of the above.
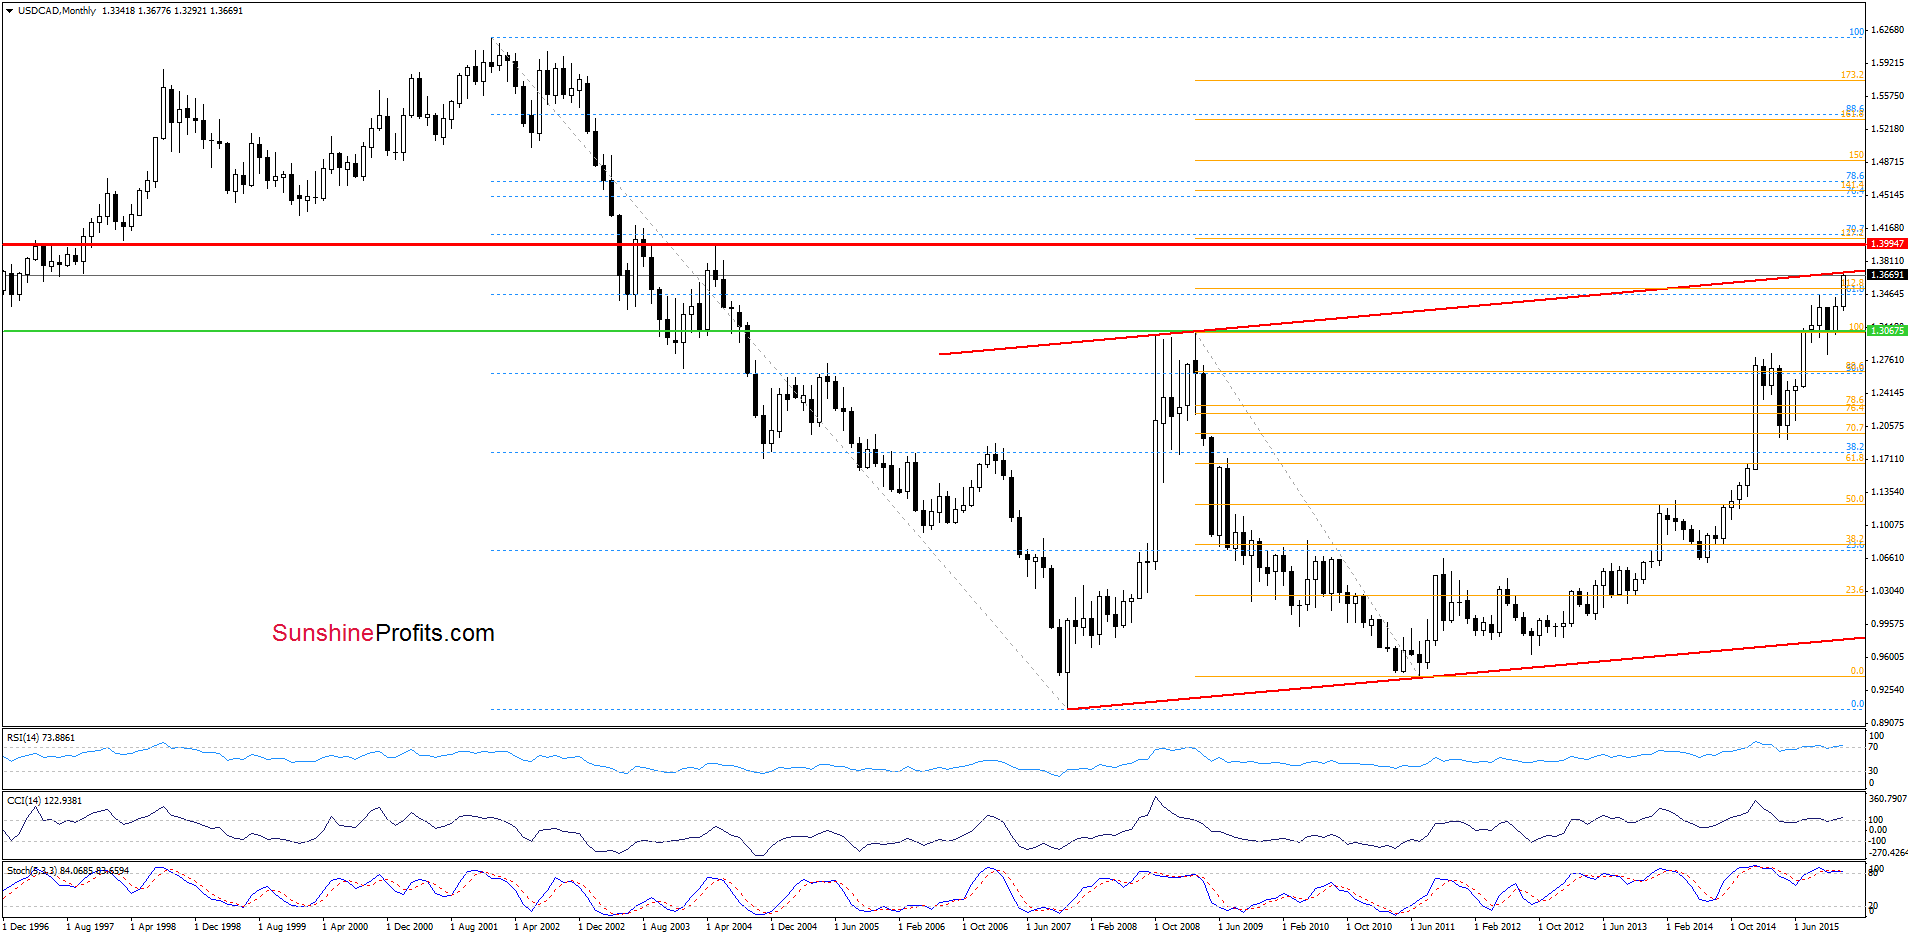
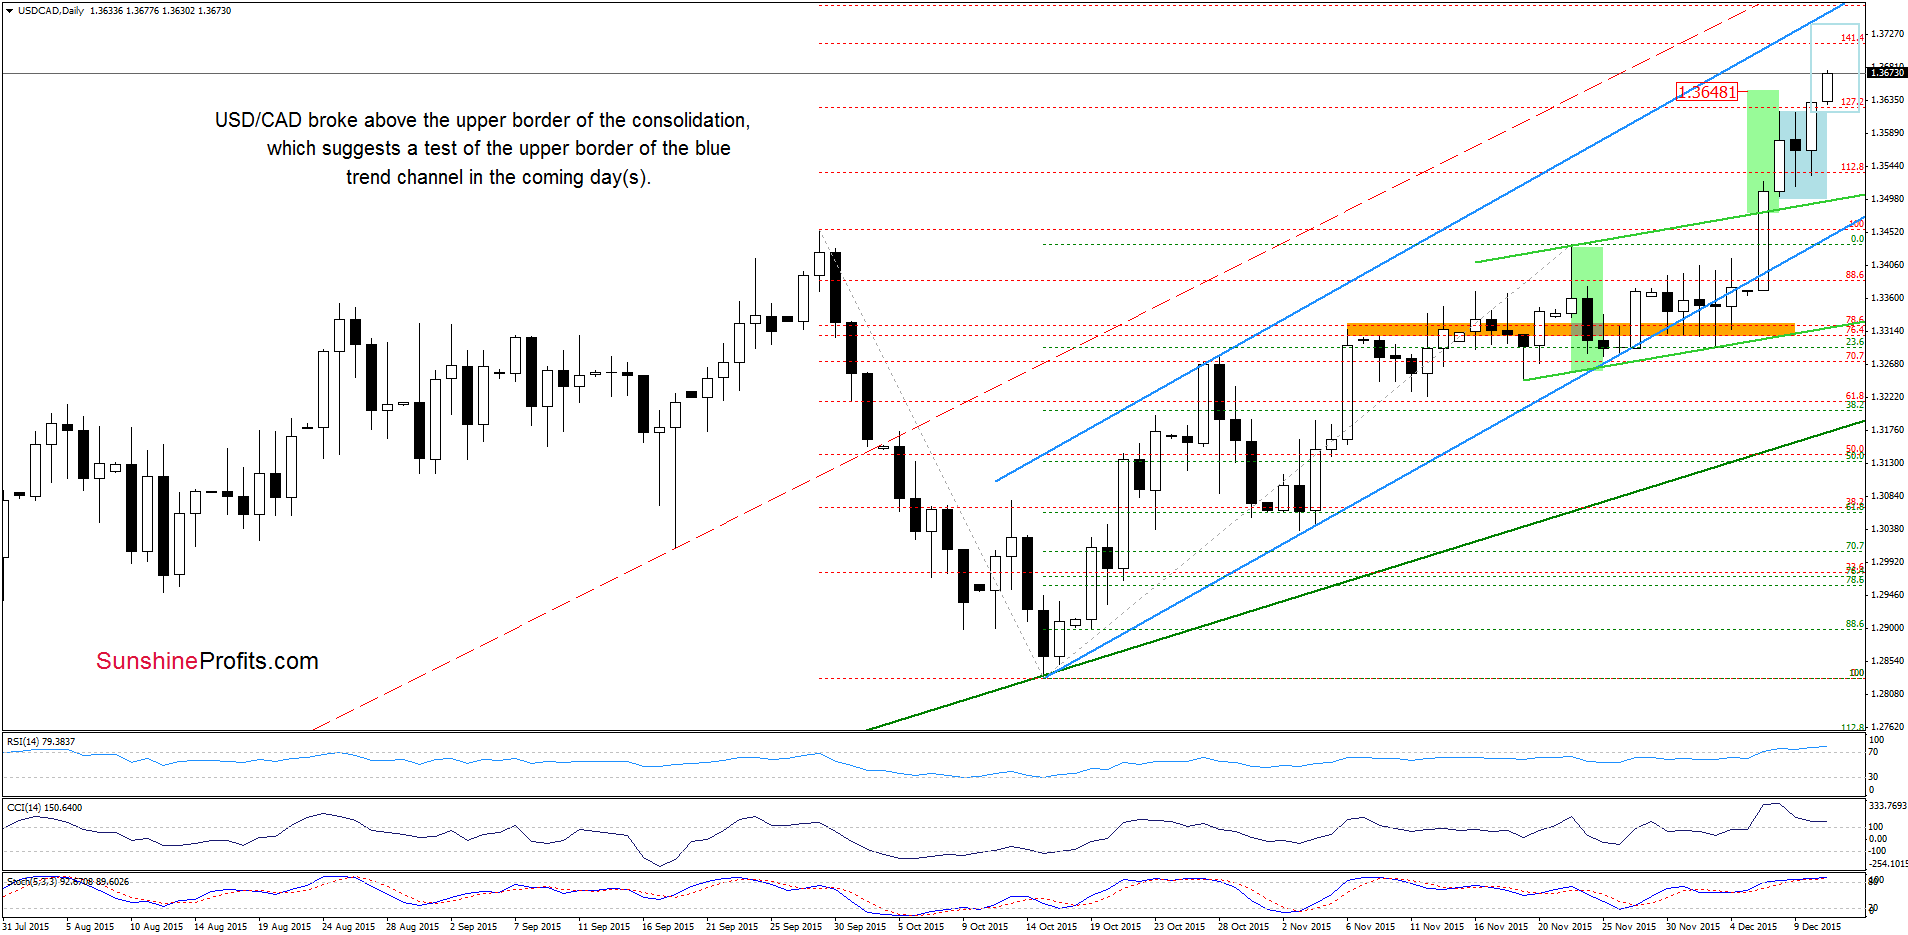
USD/CAD
Quoting our yesterday’s alert:
(…) USD/CAD bounced off the orange zone and the lower border of the green rising trend channel, which resulted not only in a rally to a fresh 2015 high, but also in a breakout above the upper border of the channel. This positive signal triggered further improvement and an increase to the 127.2% Fibonacci extension. As you see this resistance level pushed the pair little lower, but USD/CAD remains in the blue consolidation. Although the current position of the indicators suggests further declines, we think that earlier breakouts and the current situation in crude oil (if you want to have a more complete picture of the commodity and the oil sector we encourage you to sign up for Oil Trading Alerts or the Fundamental Package that includes it) will encourage currency bulls to act – especially when we factor in the long-term picture.
From todays point of view, we see that currency bulls pushed the pair higher as we had expected. With today’s upswing, USD/CAD broke above the uper border of the consolidation and the 127.2% Fibonacci extension, which suggests further improvement and an increase to around 1.3740, where the size of the move will correspond to the height of the formation. Nevertheless, before we see such price action the initial upside target would be the barrier of 1.3700, where the upper border of the red rising trend channel (marked on the weekly chart) is.
Very short-term outlook: mixed with bullish bias
Short-term outlook: mixed
MT outlook: mixed
LT outlook: mixed
Trading position (short-term; our opinion): No positions are justified from the risk/reward perspective at the moment. We will keep you informed should anything change, or should we see a confirmation/invalidation of the above.
USD/CHF
On Wednesday, we wrote the following:
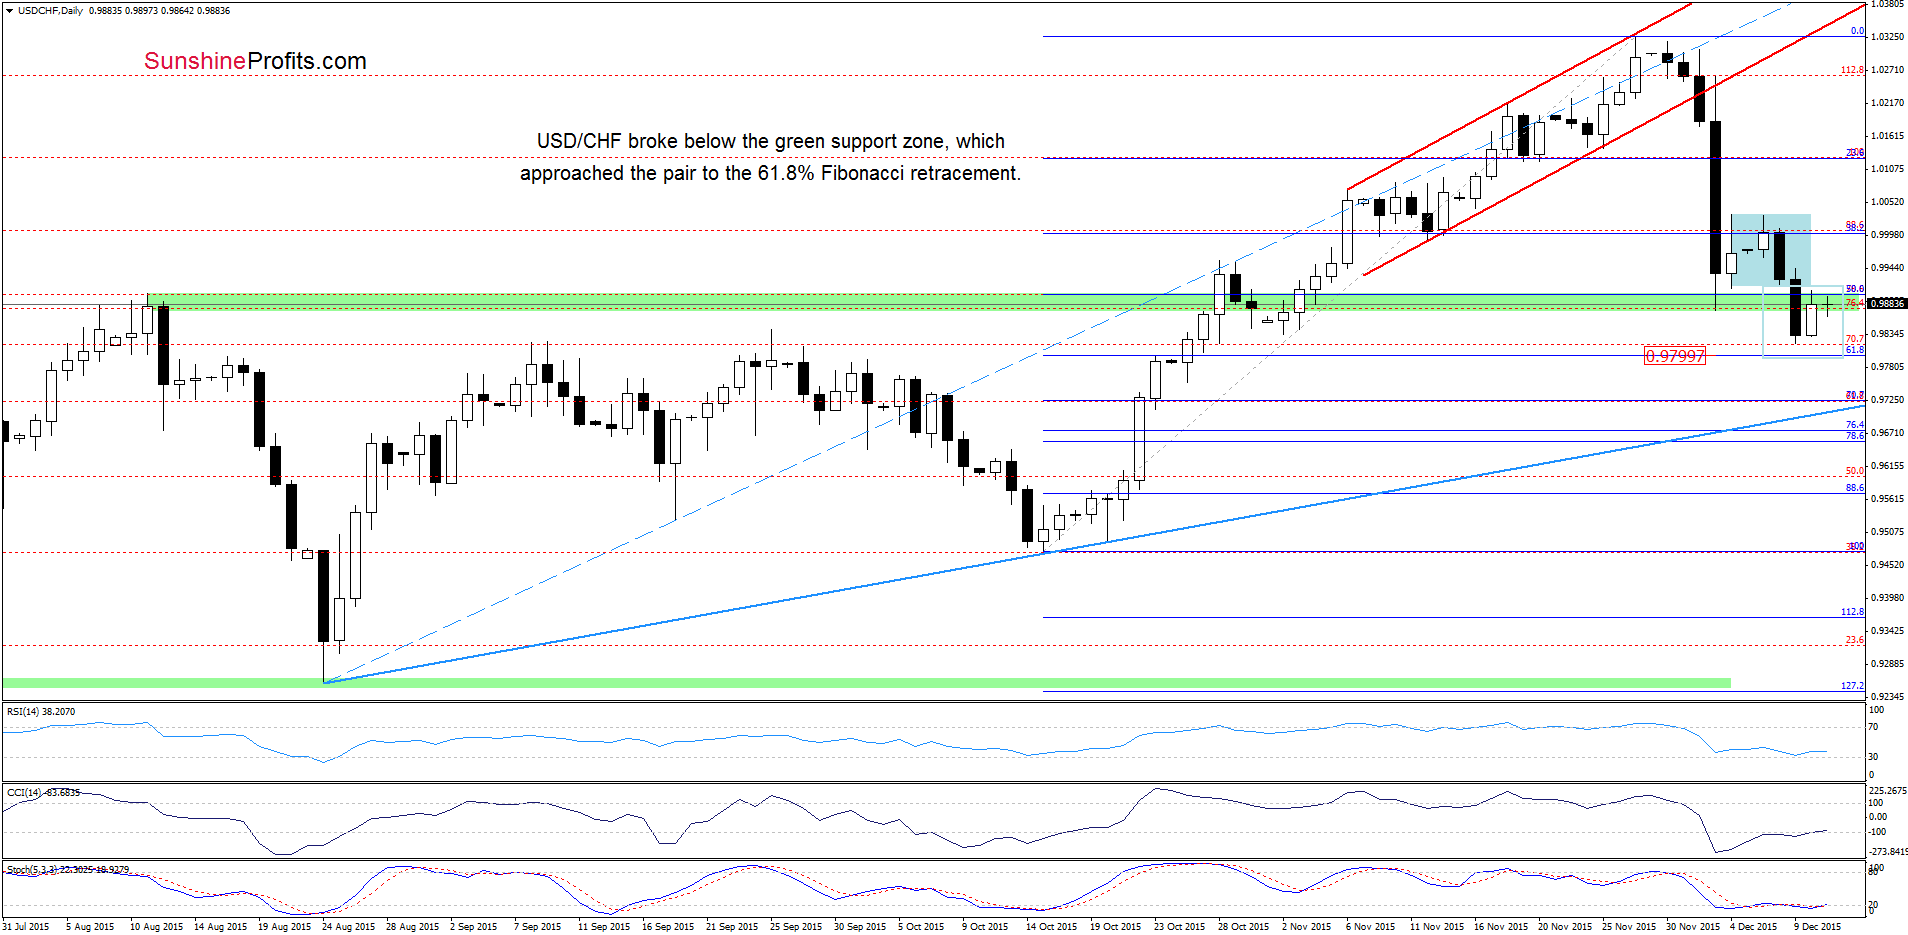
(…) the proximity to the 38.2% Fibonacci retracement (based on the recent decline) encouraged currency bears to act, which resulted in another downswing and a drop to the green support zone. (…) as long as there are no buy signals, further deterioration can’t be ruled out (especially when we factor in a breakdown under the lower border of the blue consolidation marked on the above chart). Therefore, if USD/CHF extends declines, the next downside target would be around 0.9800, where the 61.8% Fibonacci retracement (based on the mid-Oct-Nov upward move) is.
Looking at the daily chart, we see that currency bears pushed the pair lower as we had expected. With Wednesday’s downswing the exchange rate broke below the green support zone, which approached USD/CHF to our initial downside target. As you see, this support level triggered a rebound yesterday, but despite this move the pair remains under the green zone, which suggests that yesterday’s upswing could be just a verification of earlier breakdown. If this is the case, and the exchange rate declines from here, we’ll see a drop to around 0.9800.
What could happen if this support is broken? Let’s examine the weekly chart and find out.
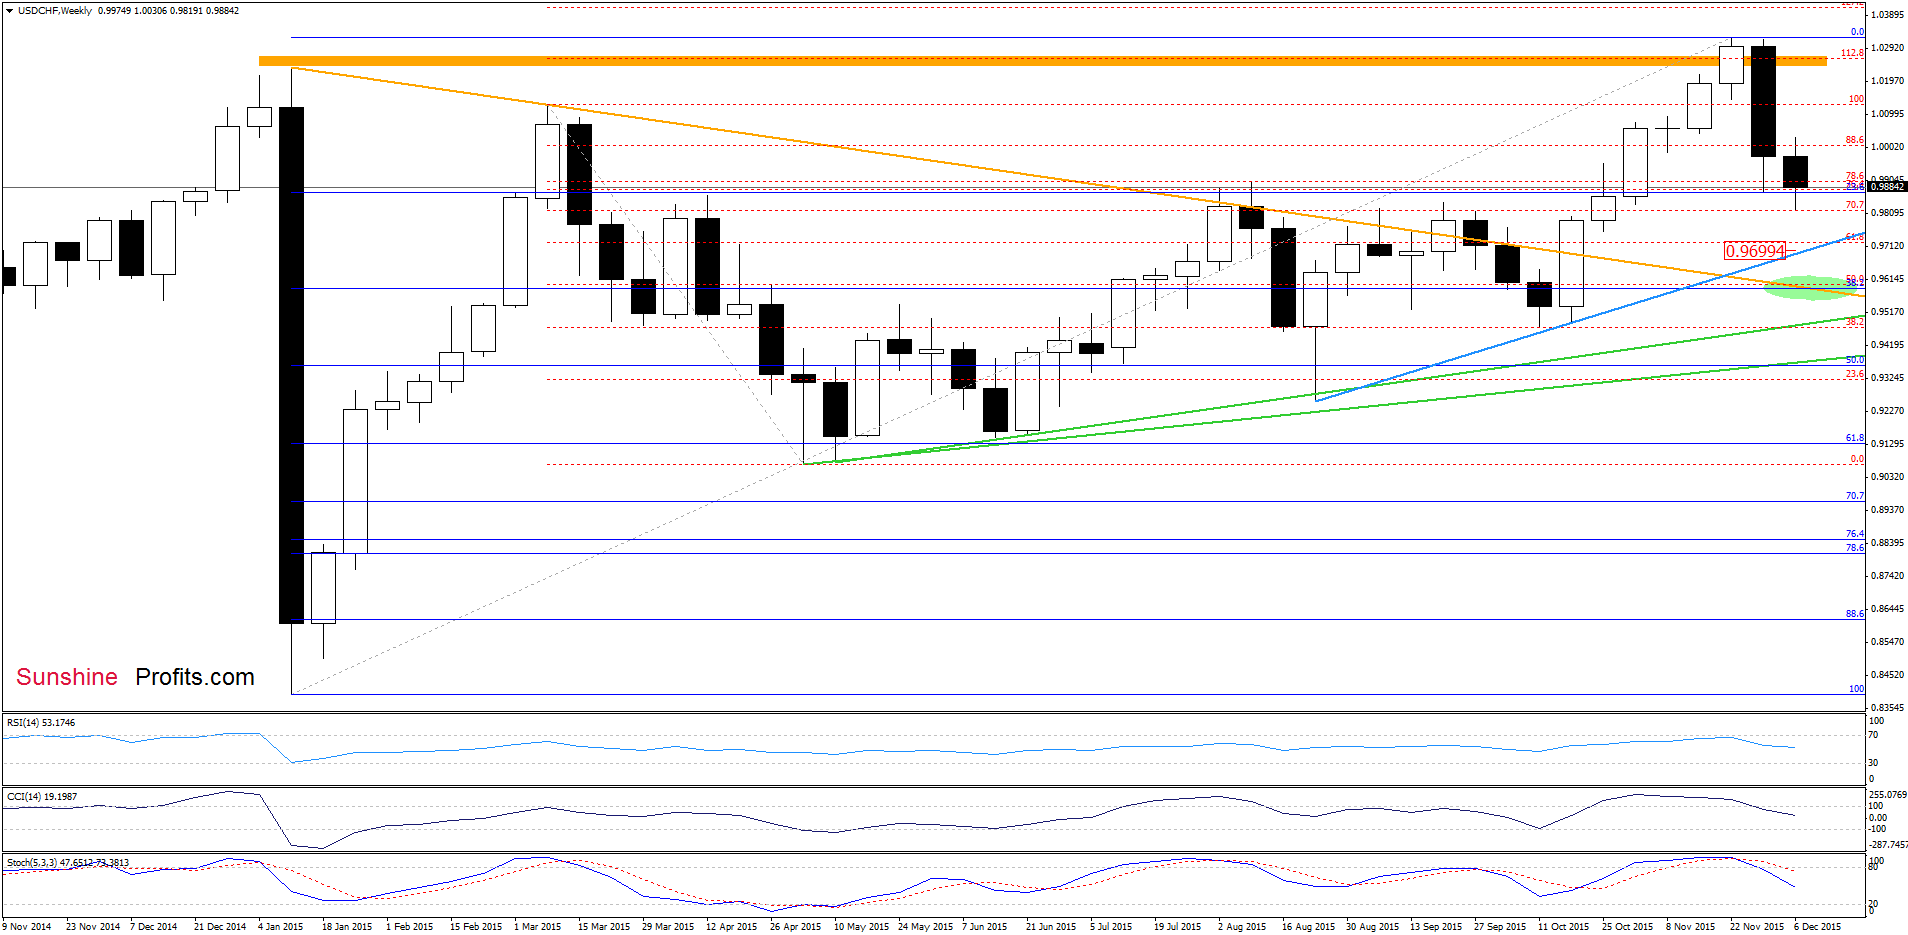
From this perspective, we see that further deterioration and a breakdown under the 23.6% retracement could result in a decline to the blue support line (based on the Aug and Oct lows) or even to the green support area (created by the 38.2% Fibonacci retracement based on the Jan-Nov upward move and the orange support line).
Very short-term outlook: mixed
Short-term outlook: mixed
MT outlook: mixed
LT outlook: mixed
Trading position (short-term; our opinion): No positions are justified from the risk/reward perspective at the moment. We will keep you informed should anything change, or should we see a confirmation/invalidation of the above.
AUD/USD
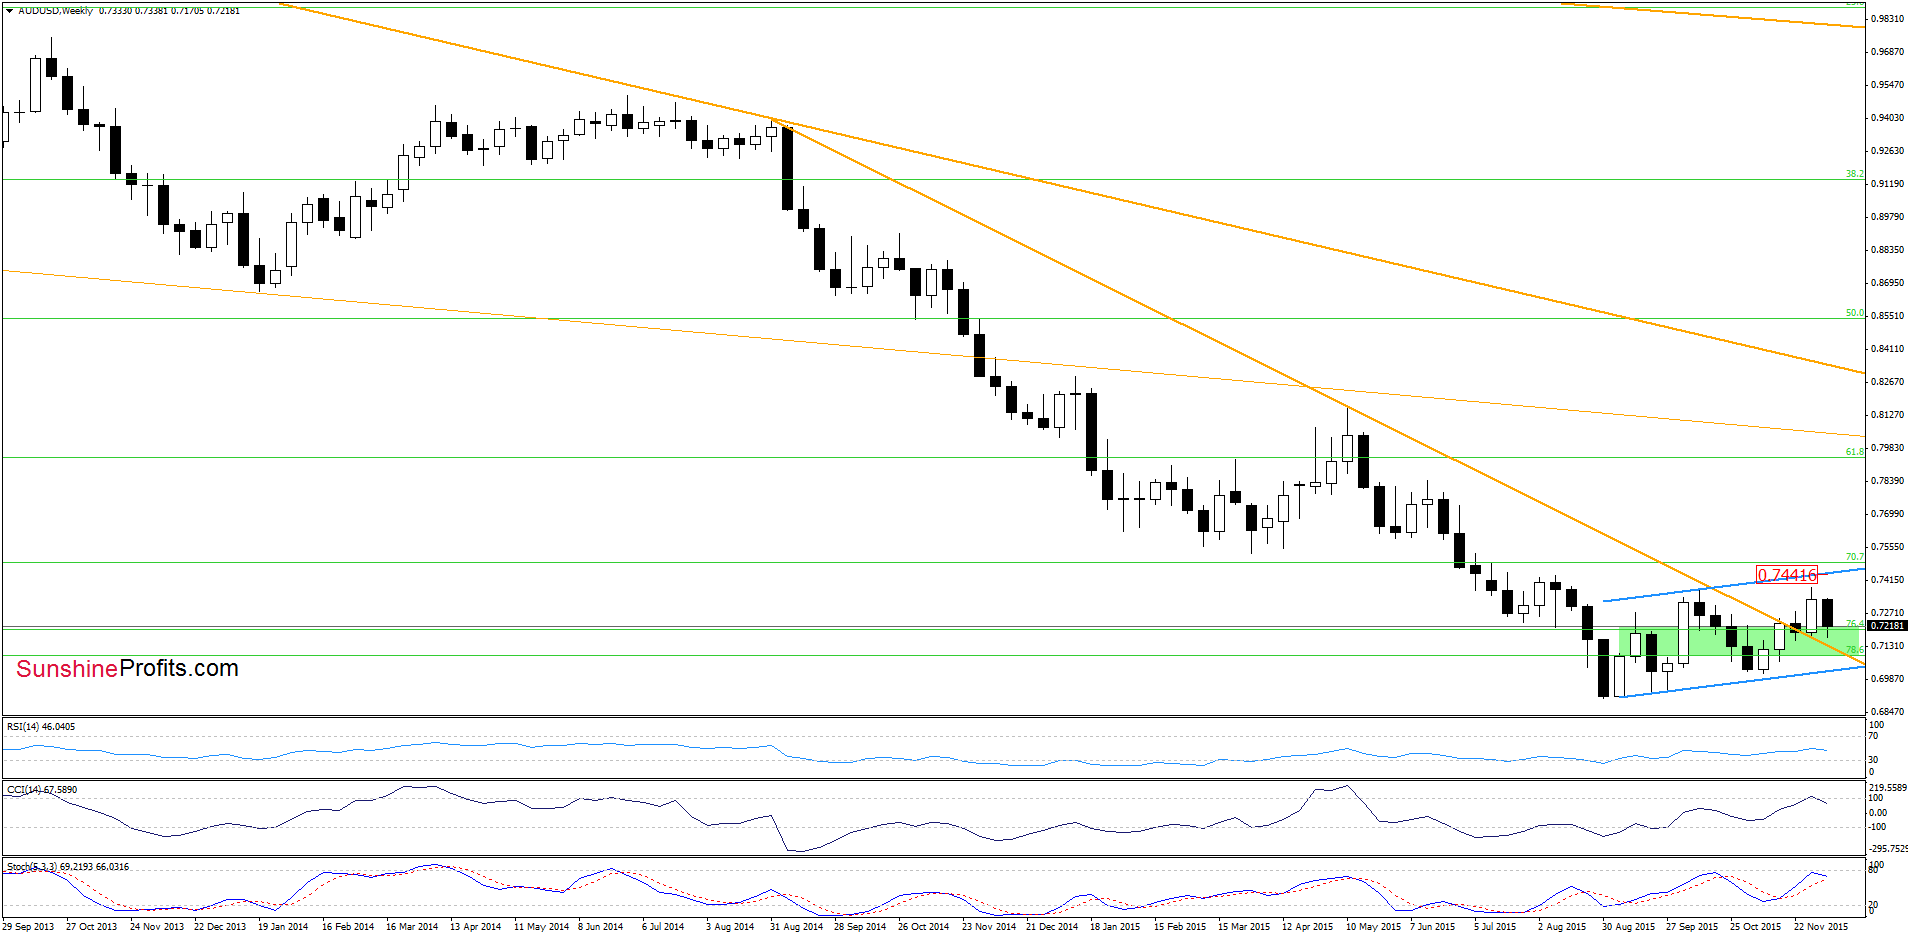
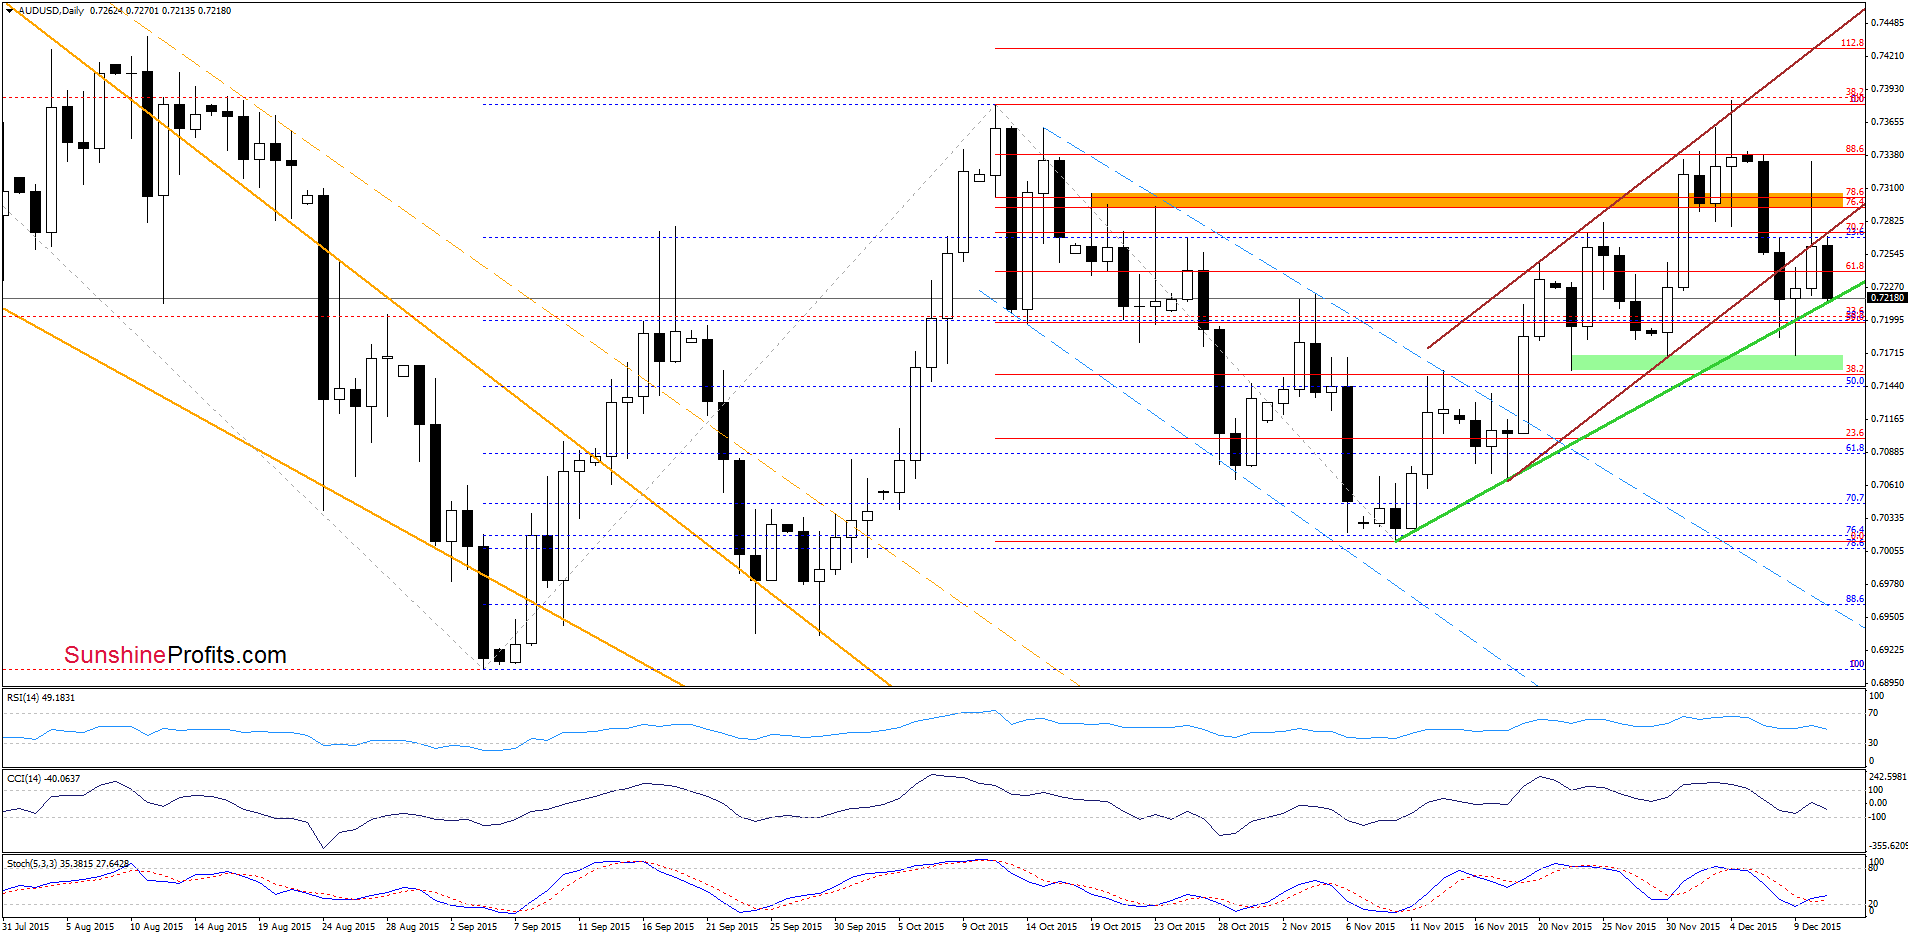
Looking at the daily chart we see that although AUD/USD came back to the brown trend channel (invalidating earlier breakdowns), the orange resistance zone stopped further improvement As a result, the exchange rate reversed and declined sharply to the green support line. If it is broken, we’ll see a re-test of the strength of the green support zone (marked on the daily chart) and the orange support line (marked on the weekly chart).
Very short-term outlook: mixed
Short-term outlook: mixed
MT outlook: mixed
LT outlook: mixed
Trading position (short-term; our opinion): No positions are justified from the risk/reward perspective at the moment. We will keep you informed should anything change, or should we see a confirmation/invalidation of the above.
Thank you.
Nadia Simmons
Forex & Oil Trading Strategist
Przemyslaw Radomski, CFA
Founder, Editor-in-chief
Gold & Silver Trading Alerts
Forex Trading Alerts
Oil Investment Updates
Oil Trading Alerts

