

Yesterday, the Commerce Department reported that U.S. gross domestic product grew at an annual rate of 1.5% in the second quarter, missing expectations for a growth of 1.6%. Earlier today, the U.S. Bureau of Economic Analysis showed that personal spending increased by 0.1% in the previous month, also missing expectations for a 0.2% rise and fuelling concerns over the strength of the economy. Thanks to these disappointing numbers, the USD Index gave up some gains and slipped to the level of 97. How did this drop affect the technical picture of our six currency pairs?
In our opinion the following forex trading positions are justified - summary:
- EUR/USD: short (half positions with a stop-loss order at 1.1476; initial downside target around 1.0462). It seems that getting back with half of the regular size of the position (only if EUR/USD will be below 1.1080 15 minutes before the session closure) is justified from the risk/reward point of view.
- GBP/USD: none
- USD/JPY: none
- USD/CAD: none
- USD/CHF: none
- AUD/USD: none
EUR/USD
Quoting our previous commentary:
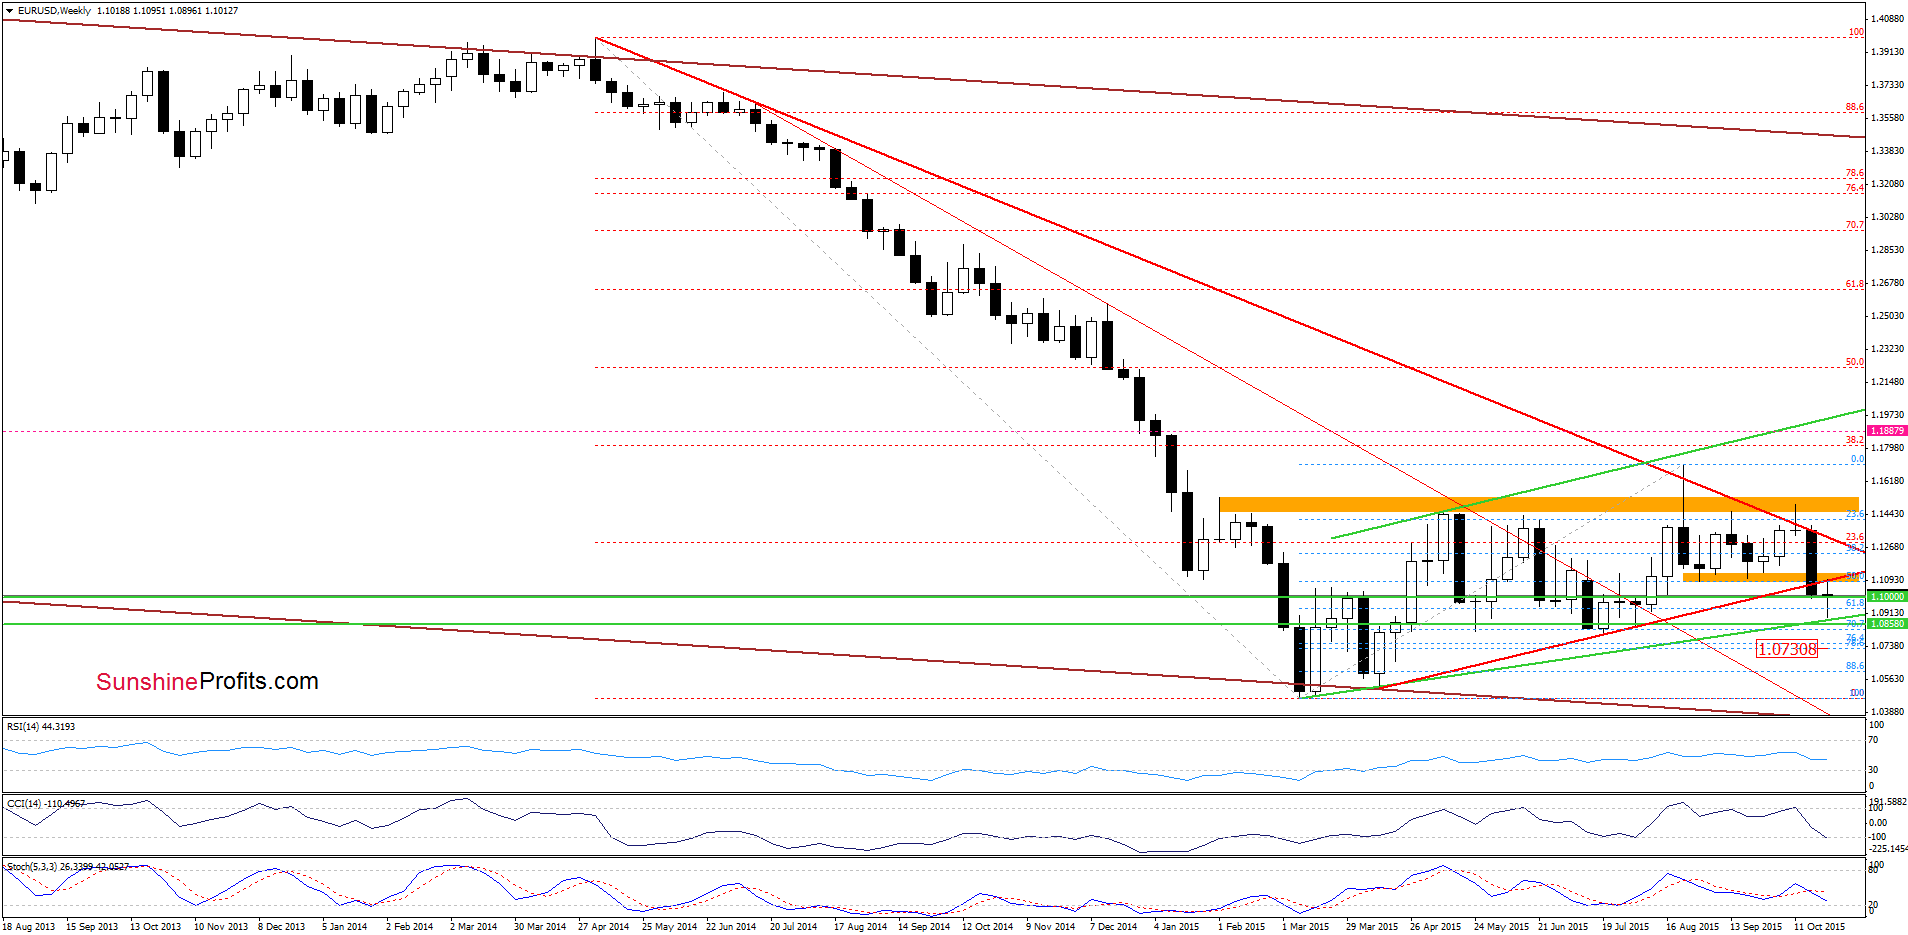
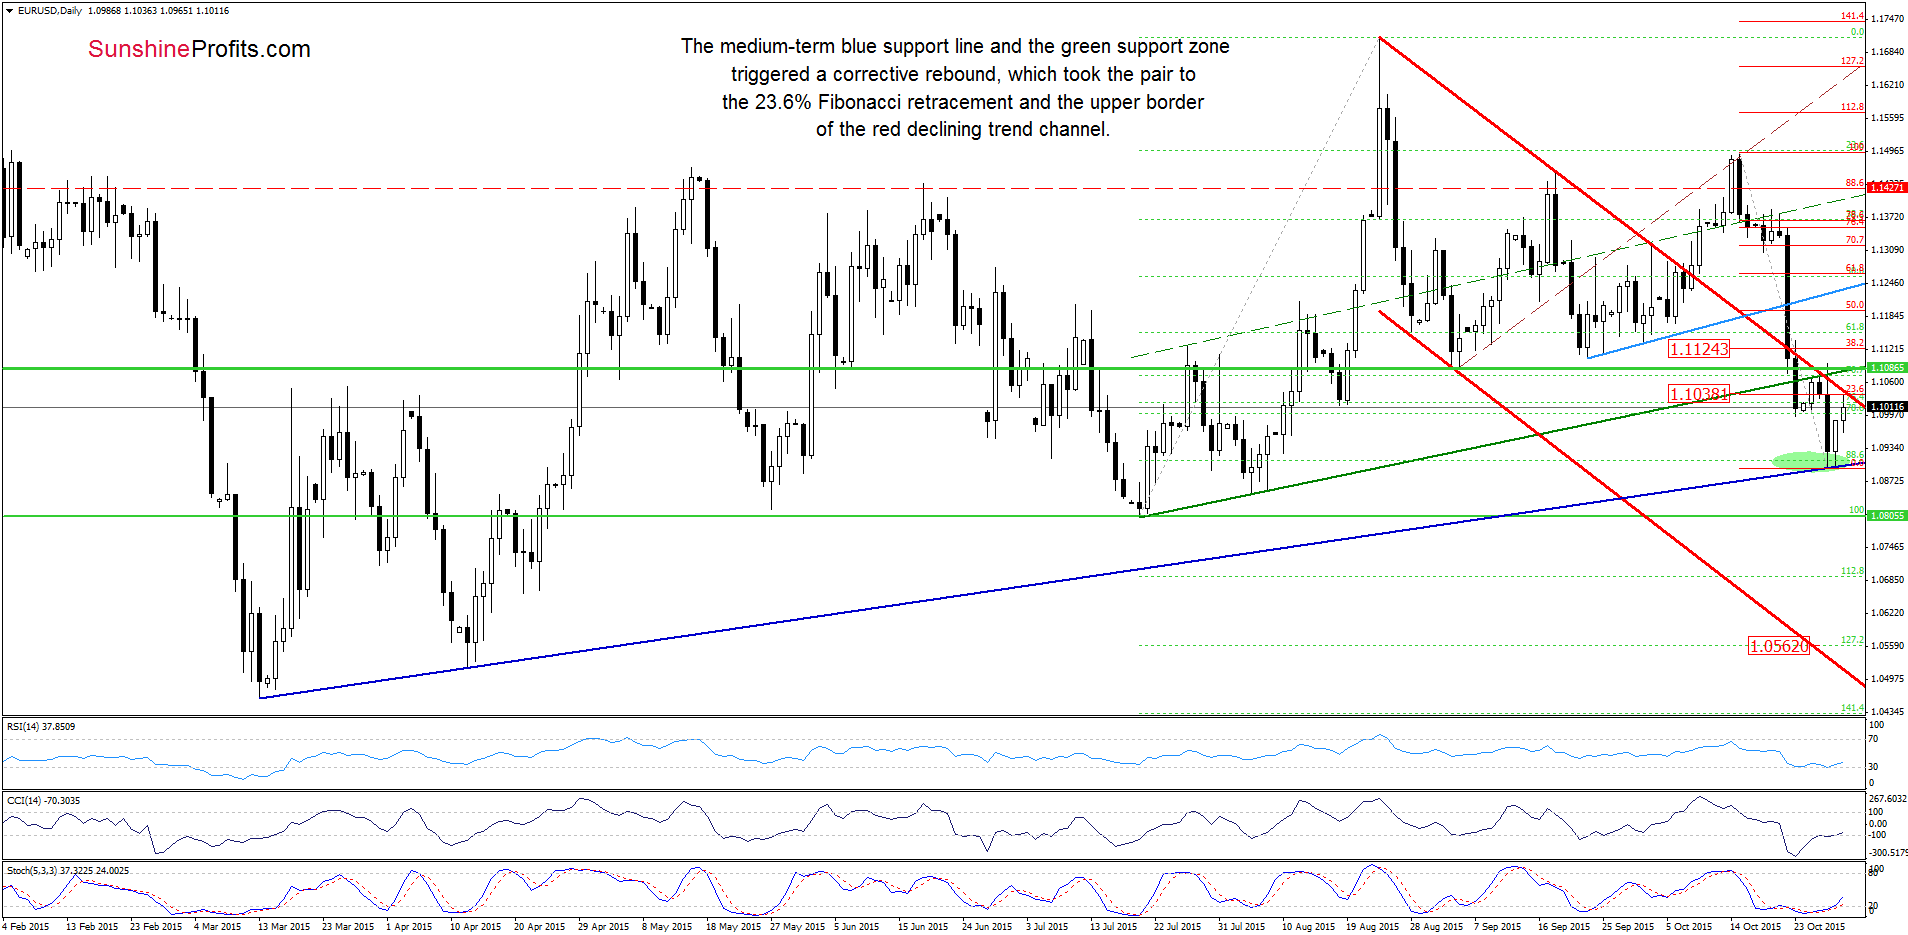
(…) important support area triggered a rebound, which in combination with the current position of the indicators suggests that we may see a corrective upward move in the coming day(s). If this is the case, and the pair moves higher from here, the initial upside target for currency bulls would be around 1.1038, where the 23.6% Fibonacci retracement (based on the entire recent decline) and the previously-broken upper border of the red declining trend channel are.
Looking at the chars, we see that the situation developed in line with the above scenario and EUR/USD reached our initial upside target. Despite this improvement, currency bulls didn’t manage to push the pair above the red support/resistance line (based on the Apr. and Jul lows and marked on the weekly chart), which simply means that as long as there is no invalidation of the breakdown below this key resistance line, another downswing is quite likely. At this point it is worth noting that if the exchange rate closes the day (and the week) under this important resistance, we’ll see a reversal from here and the recent upswing would be just a verification of earlier breakdown.
Very short-term outlook: bearish
Short-term outlook: bearish
MT outlook: mixed with bearish bias
LT outlook: mixed
Trading position (short-term; our opinion): Short (half) positions (which are profitable as we entered them when EUR/USD was at about 1.1427) with a stop-loss order at 1.1476 are justified from the risk/reward perspective. On Oct. 28 we wrote that exiting the half of short positions was justified. At this time it seems that getting back with half of the regular size of the position (only if EUR/USD will be below 1.1080 15 minutes before the session closure) is justified from the risk/reward point of view.
Please note that a full position doesn’t mean using all of the capital for a given trade. You will find details on our thoughts on gold portfolio structuring in the Key Insights section on our website.
GBP/USD
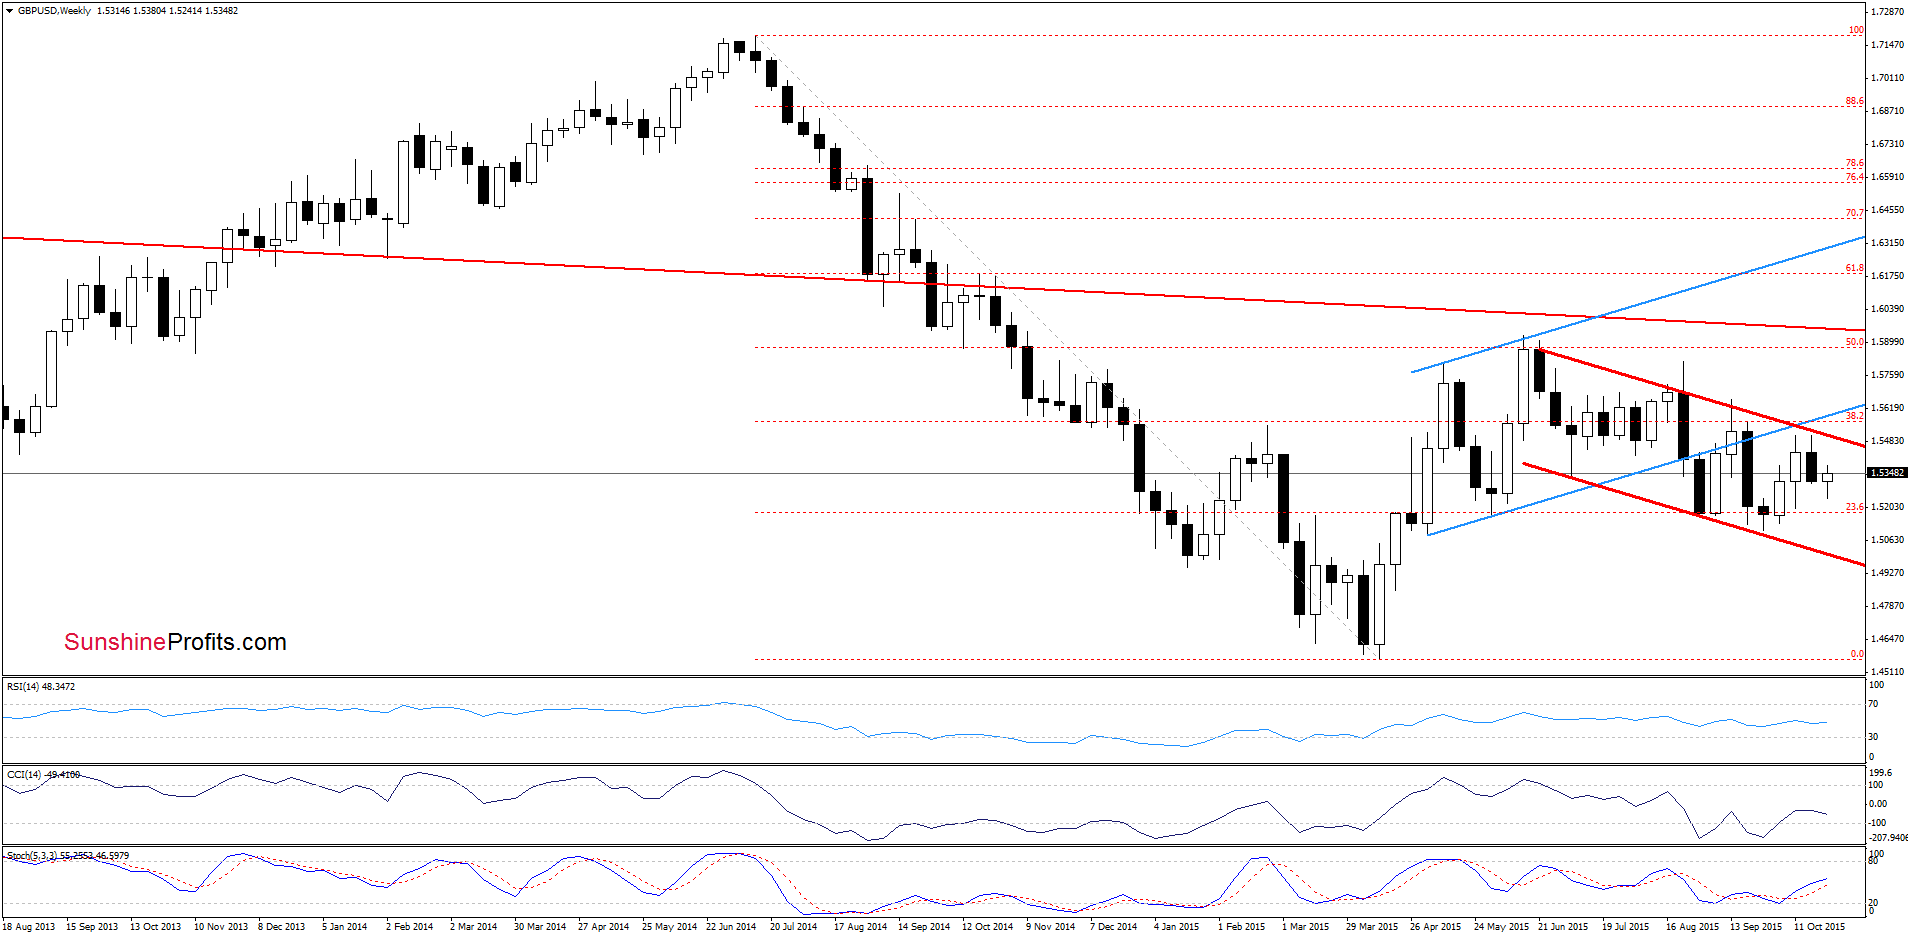
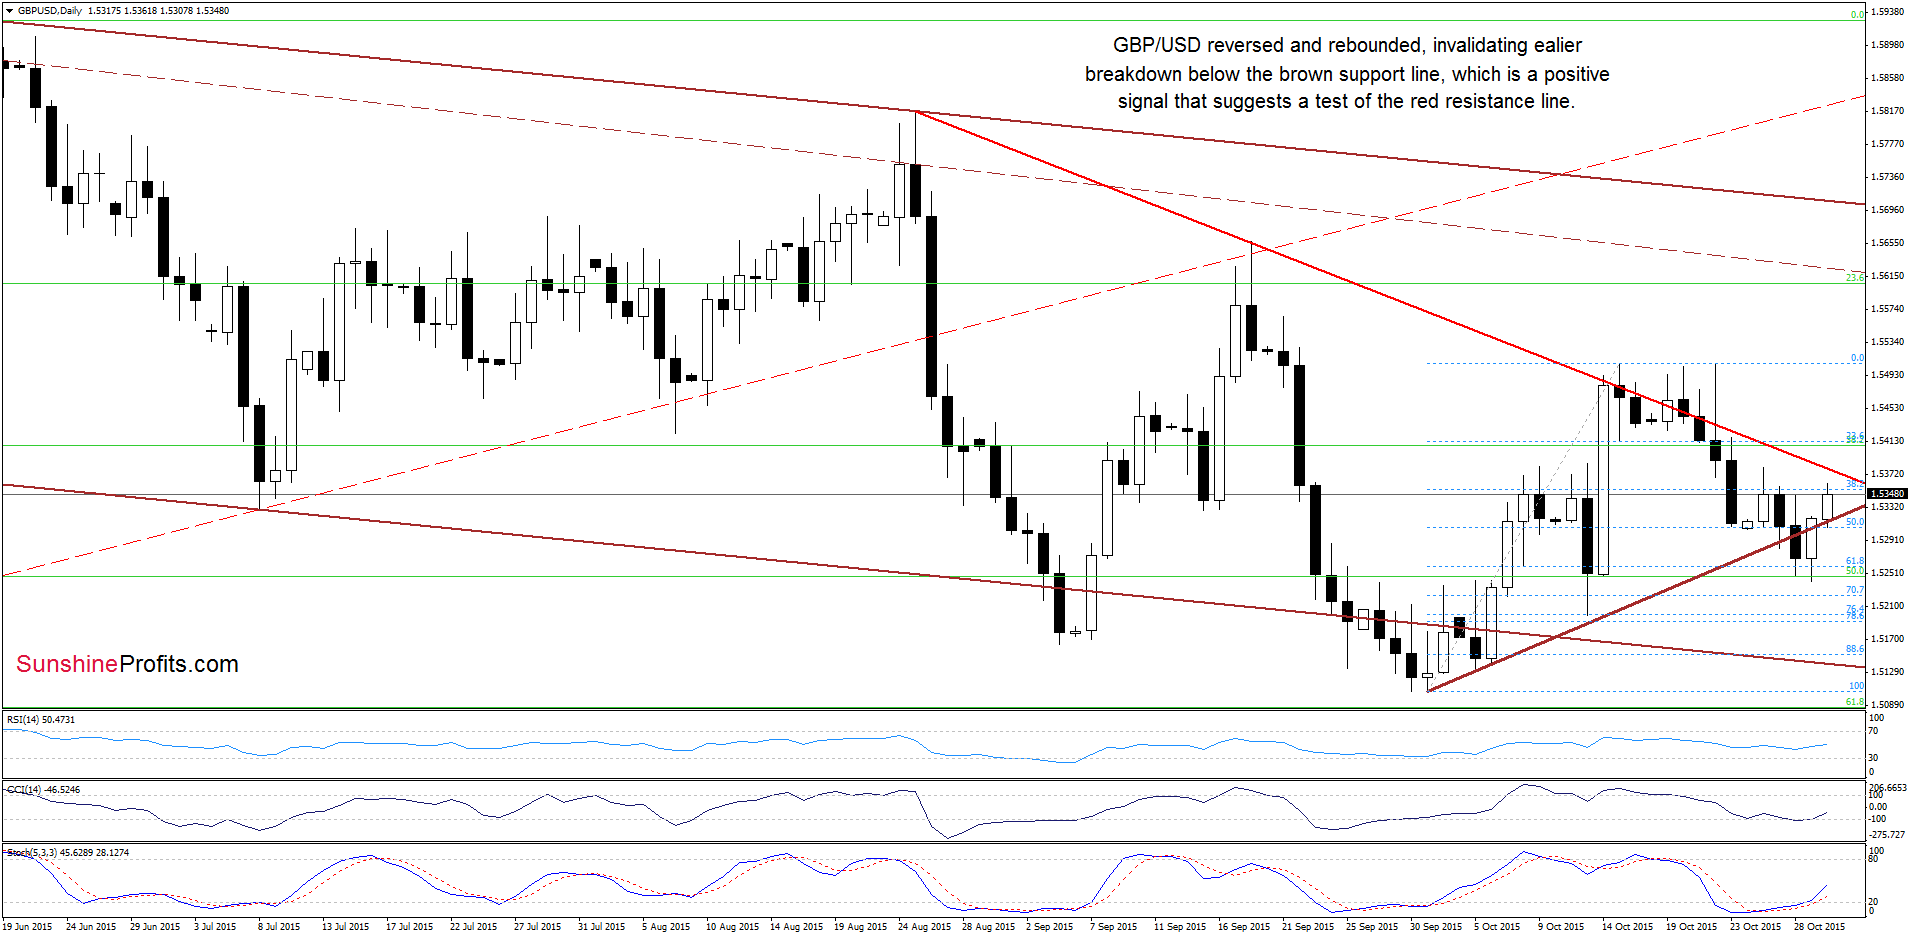
From today’s point of view, we see that the 61.8% Fibonacci retracement (based on the Oct rally) encouraged currency bulls to act, which resulted in a rebound. As a result, GBP/USD invalidated the breakdown under the brown support/resistance line, which suggests (at least) a test of the red declining resistance line in the coming day(s). If it is broken, the next upside target would be around 1.5490, where the upper border of the declining red trend channel and the recent highs are.
Very short-term outlook: mixed with bullish bias
Short-term outlook: mixed
MT outlook: mixed
LT outlook: mixed
Trading position (short-term; our opinion): No positions are justified from the risk/reward perspective at the moment. We will keep you informed should anything change, or should we see a confirmation/invalidation of the above.
USD/JPY
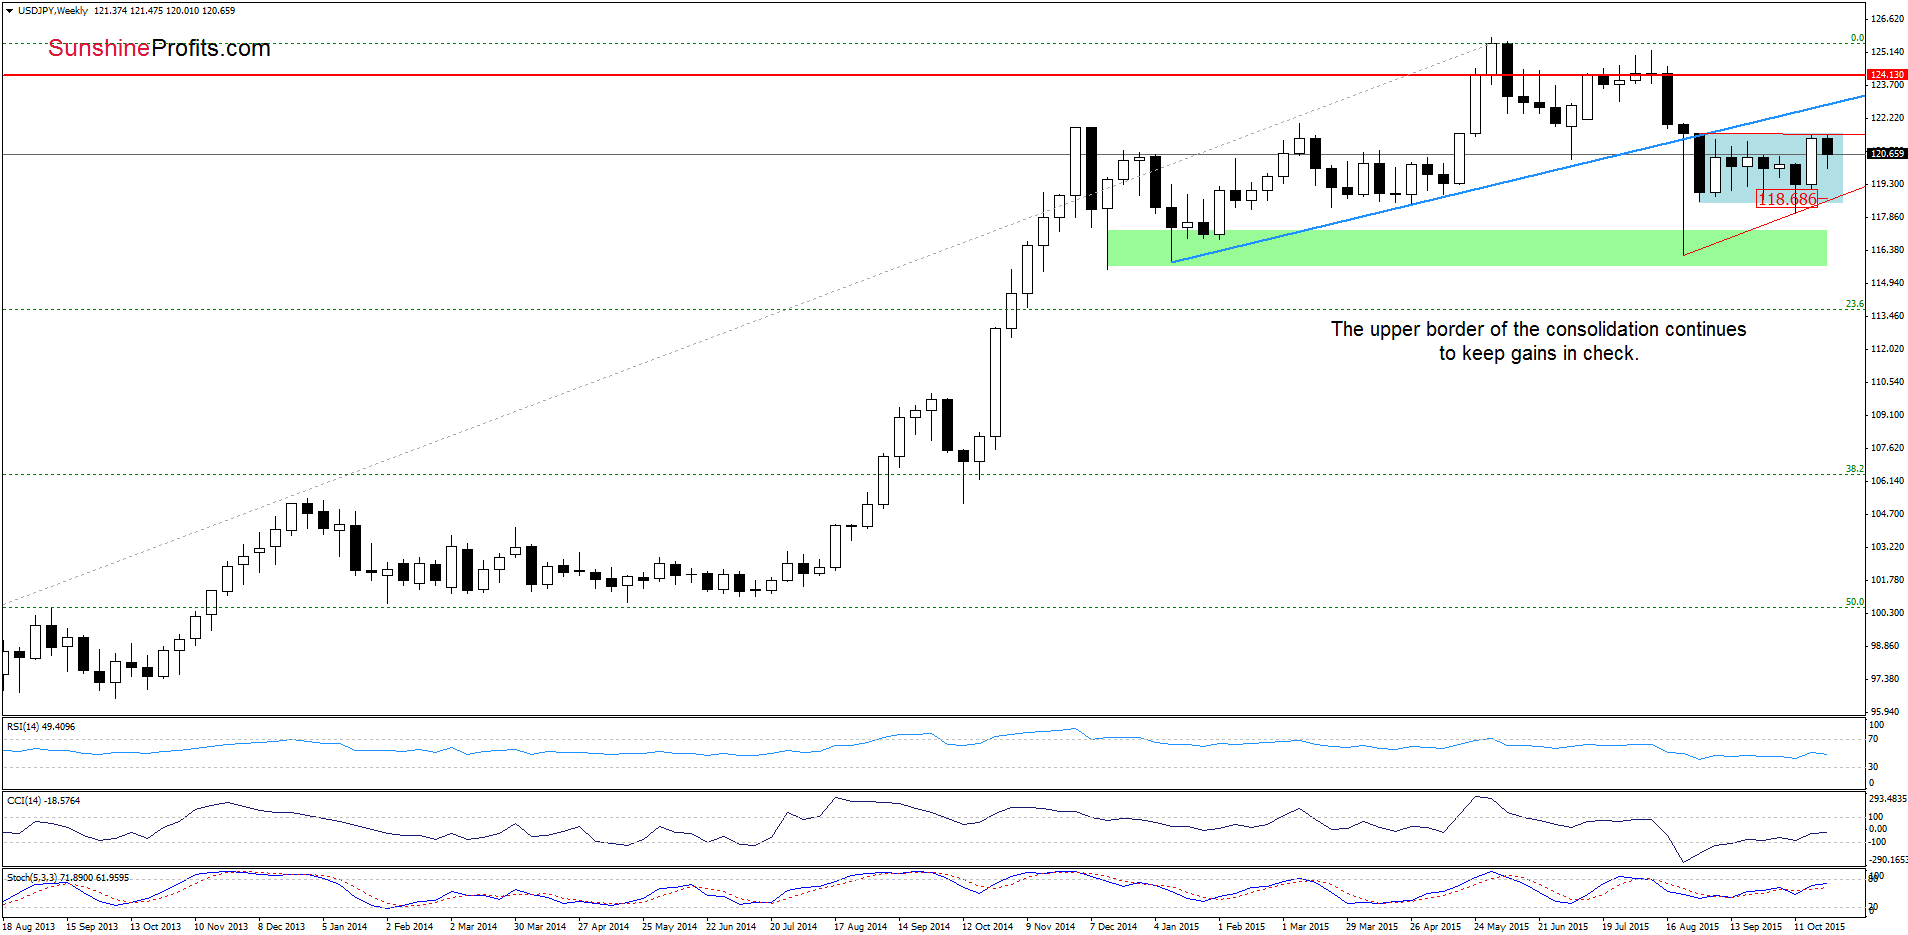
Looking at the weekly chart we see that the upper border of the consolidation continues to keep gains in check.
Will the very short-term chart give us more clues about future moves?
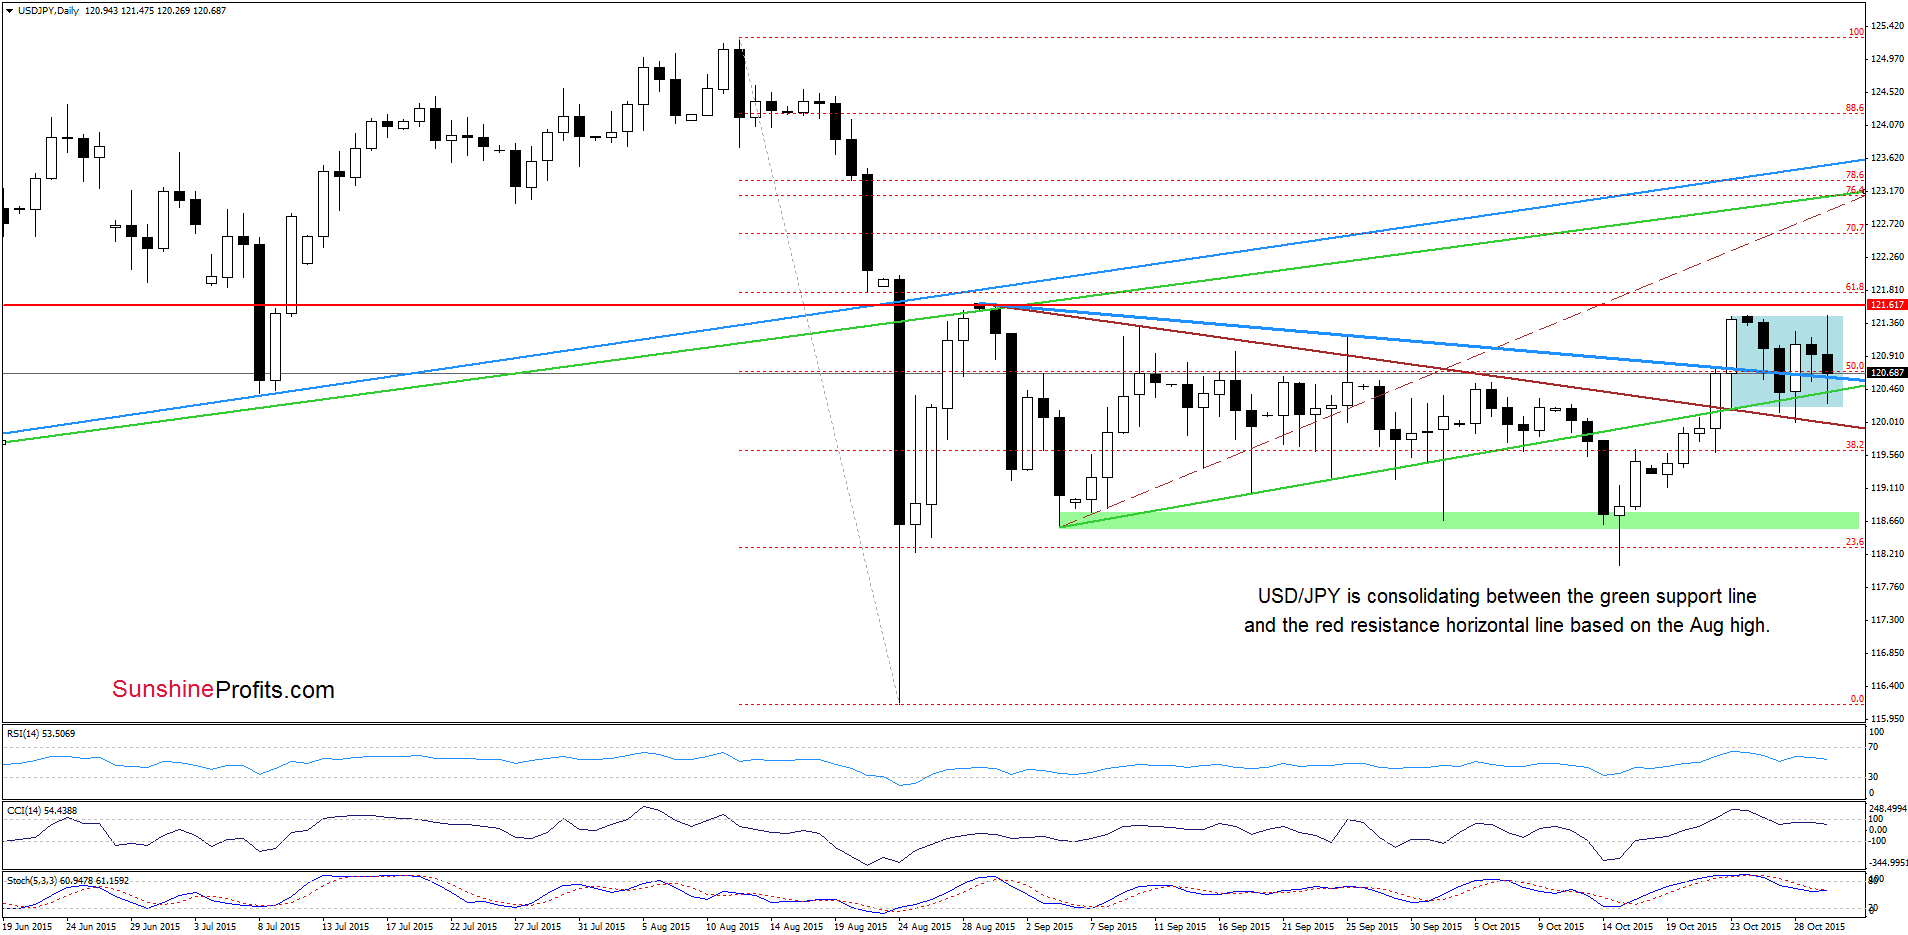
Not really, because as you see on the daily chart, the exchange rate is trading in the consolidation (marked with blue) between the green support line and the horizontal resistance line based on the Aug high. Therefore, as long as there is no daily closure above/below the upper/lower border of the formation, another sizable move is not likely to be seen. Finishing today’s commentary on this currency pair, please note that the current position of the indicators (the CCI and Stochastic Oscillator generated sell signals) suggests that lower values of the exchange rate are just around the corner.
Very short-term outlook: mixed
Short-term outlook: mixed
MT outlook: mixed
LT outlook: mixed
Trading position (short-term; our opinion): No positions are justified from the risk/reward perspective at the moment. We will keep you informed should anything change, or should we see a confirmation/invalidation of the above.
USD/CAD
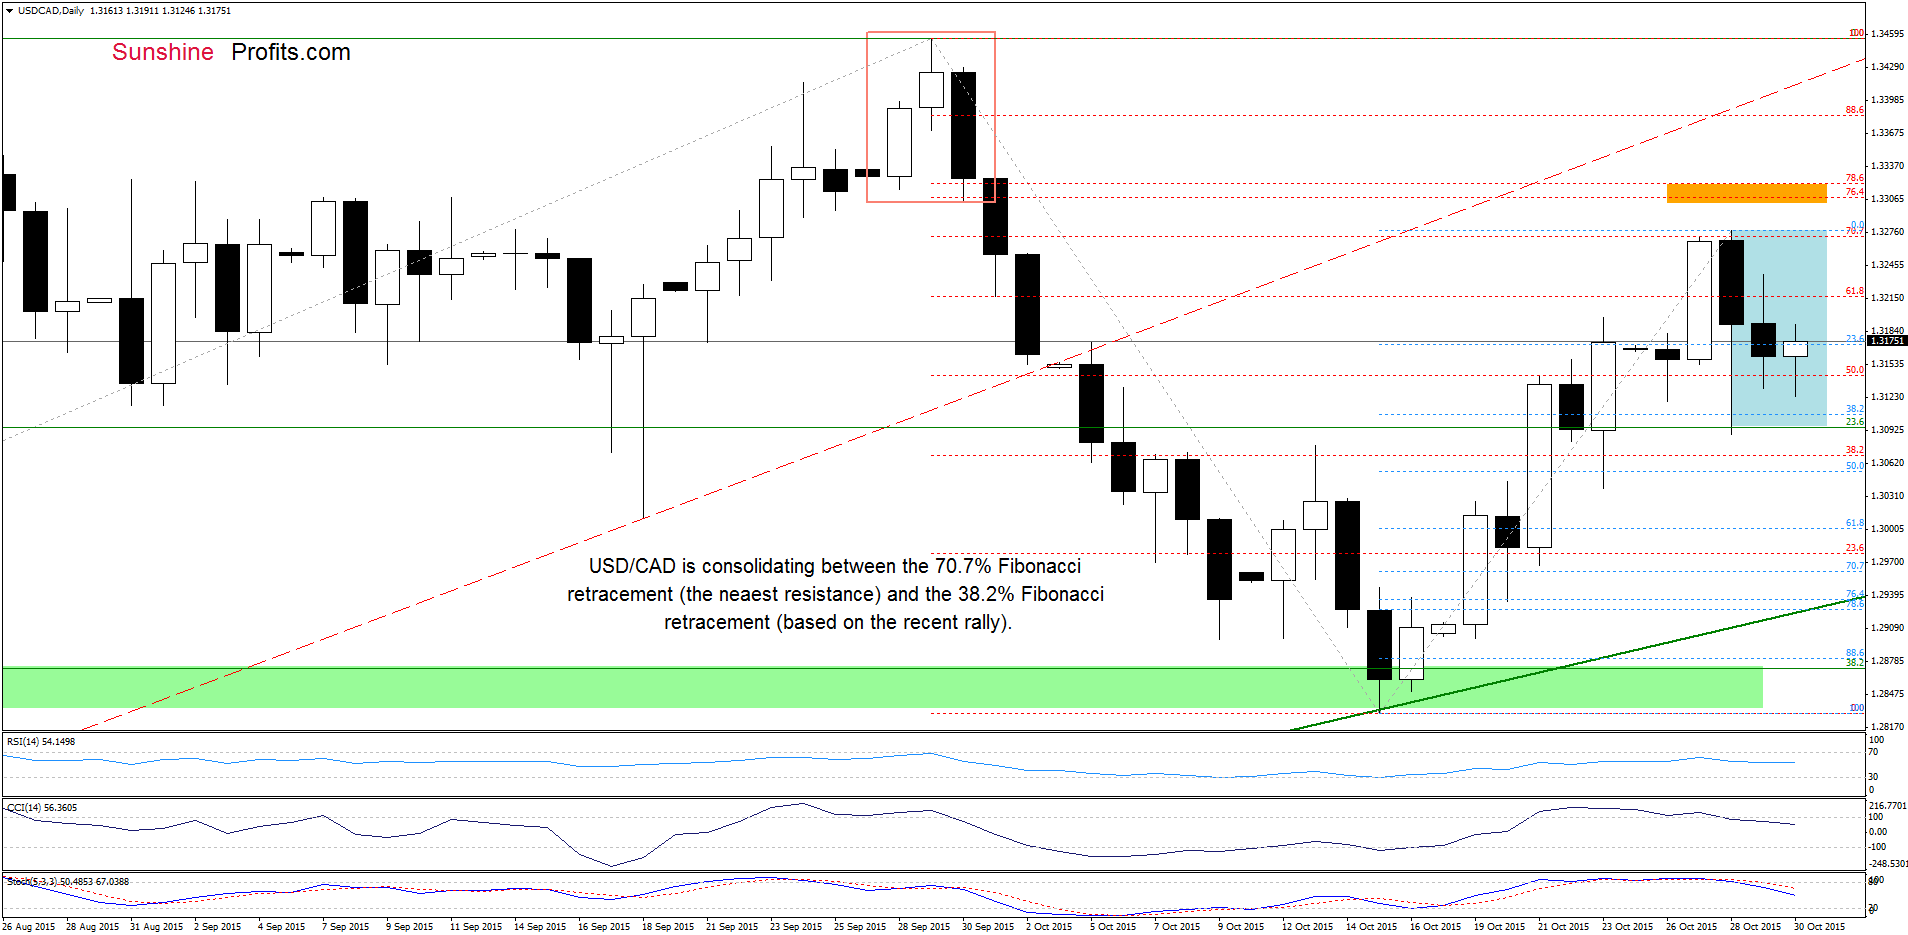
As you see on the daily chart, USD/CAD is consolidating between the support level created by the 38.2% Fibonacci retracement (based on the recent rally) and the barrier of 1.3300 (reinforced by the 70.7% retracement), which makes the very short-term picture a bit unclear. However, taking into account the fact that the recent correction was quite shallow, it seems that we may see a test of the orange resistance zone (created by the 76.4% and 78.6% Fibonacci retracement levels) in the coming days. Nevertheless, the current position of the indicators suggests that reversal is just around the corner.
Very short-term outlook: mixed
Short-term outlook: mixed
MT outlook: mixed
LT outlook: mixed
Trading position (short-term; our opinion): No positions are justified from the risk/reward perspective at the moment. We will keep you informed should anything change, or should we see a confirmation/invalidation of the above.
USD/CHF
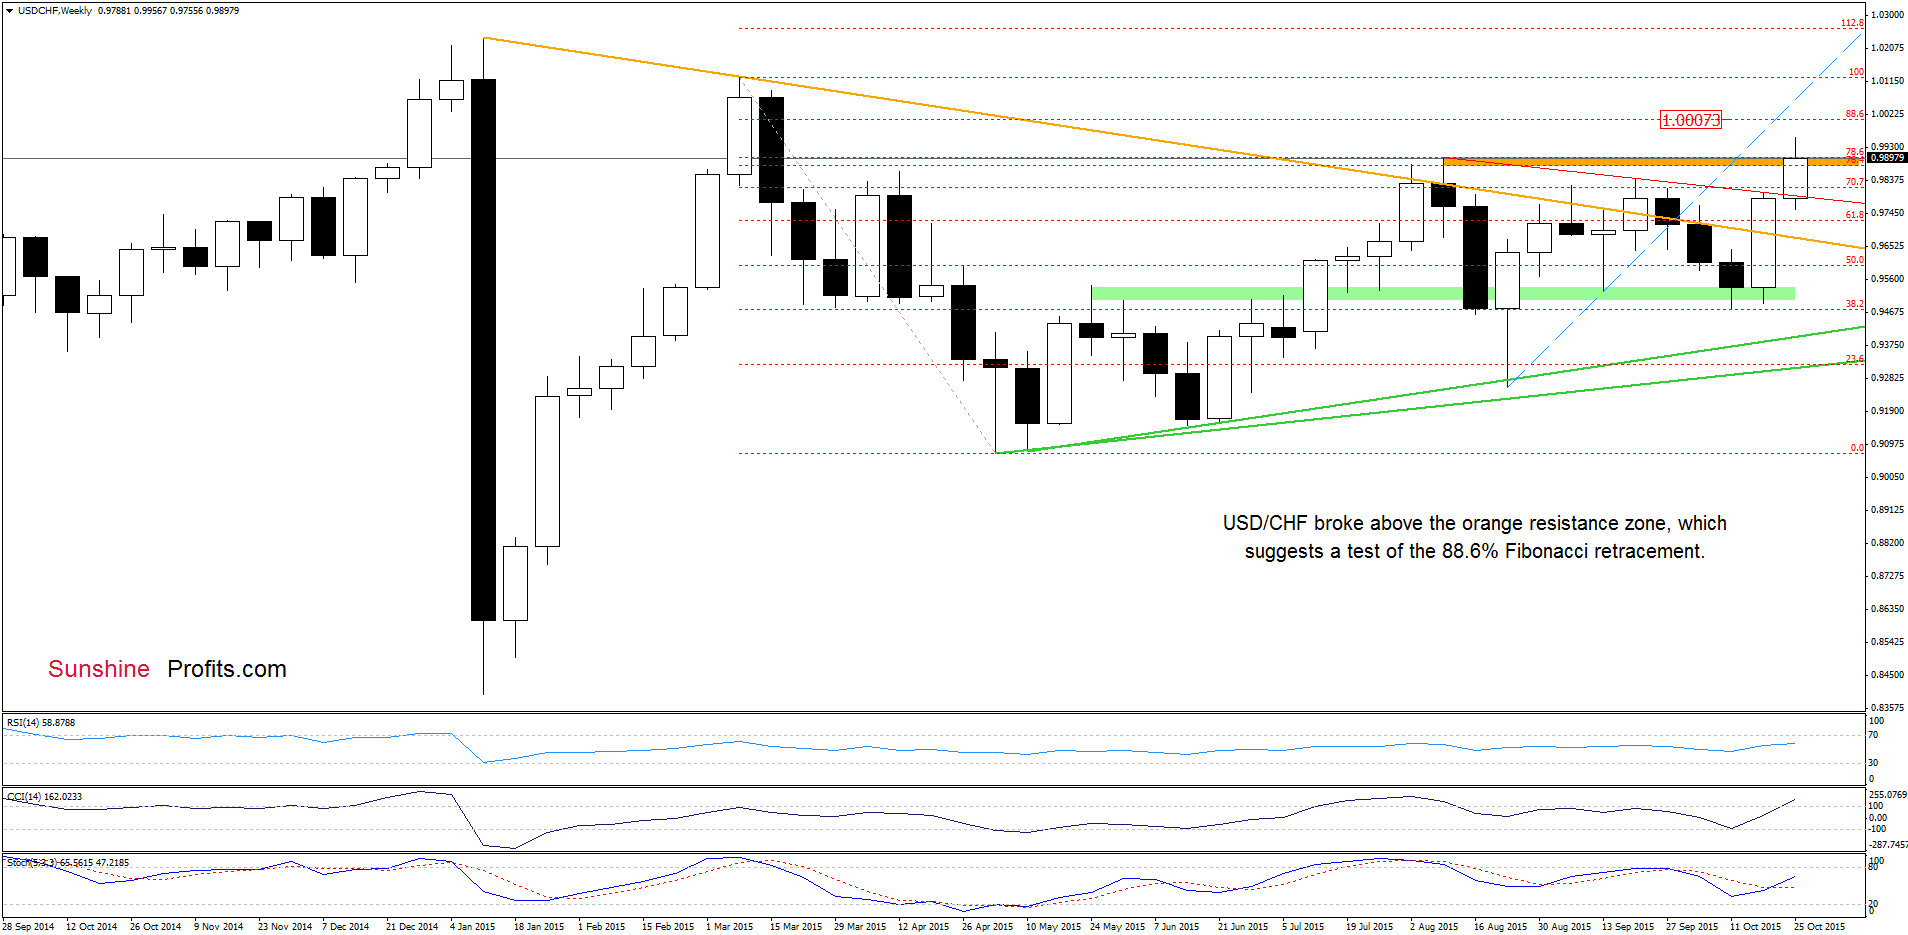
Looking at the weekly chart we see that USD/CHF broke above the orange resistance zone, which is a positive signal, which suggests further rally. However, in our opinion, it would be more reliable (and bullish) is we see a weekly close above it.
Will we see such price action? Let’s examine the daily chart and look for more clues about future moves.
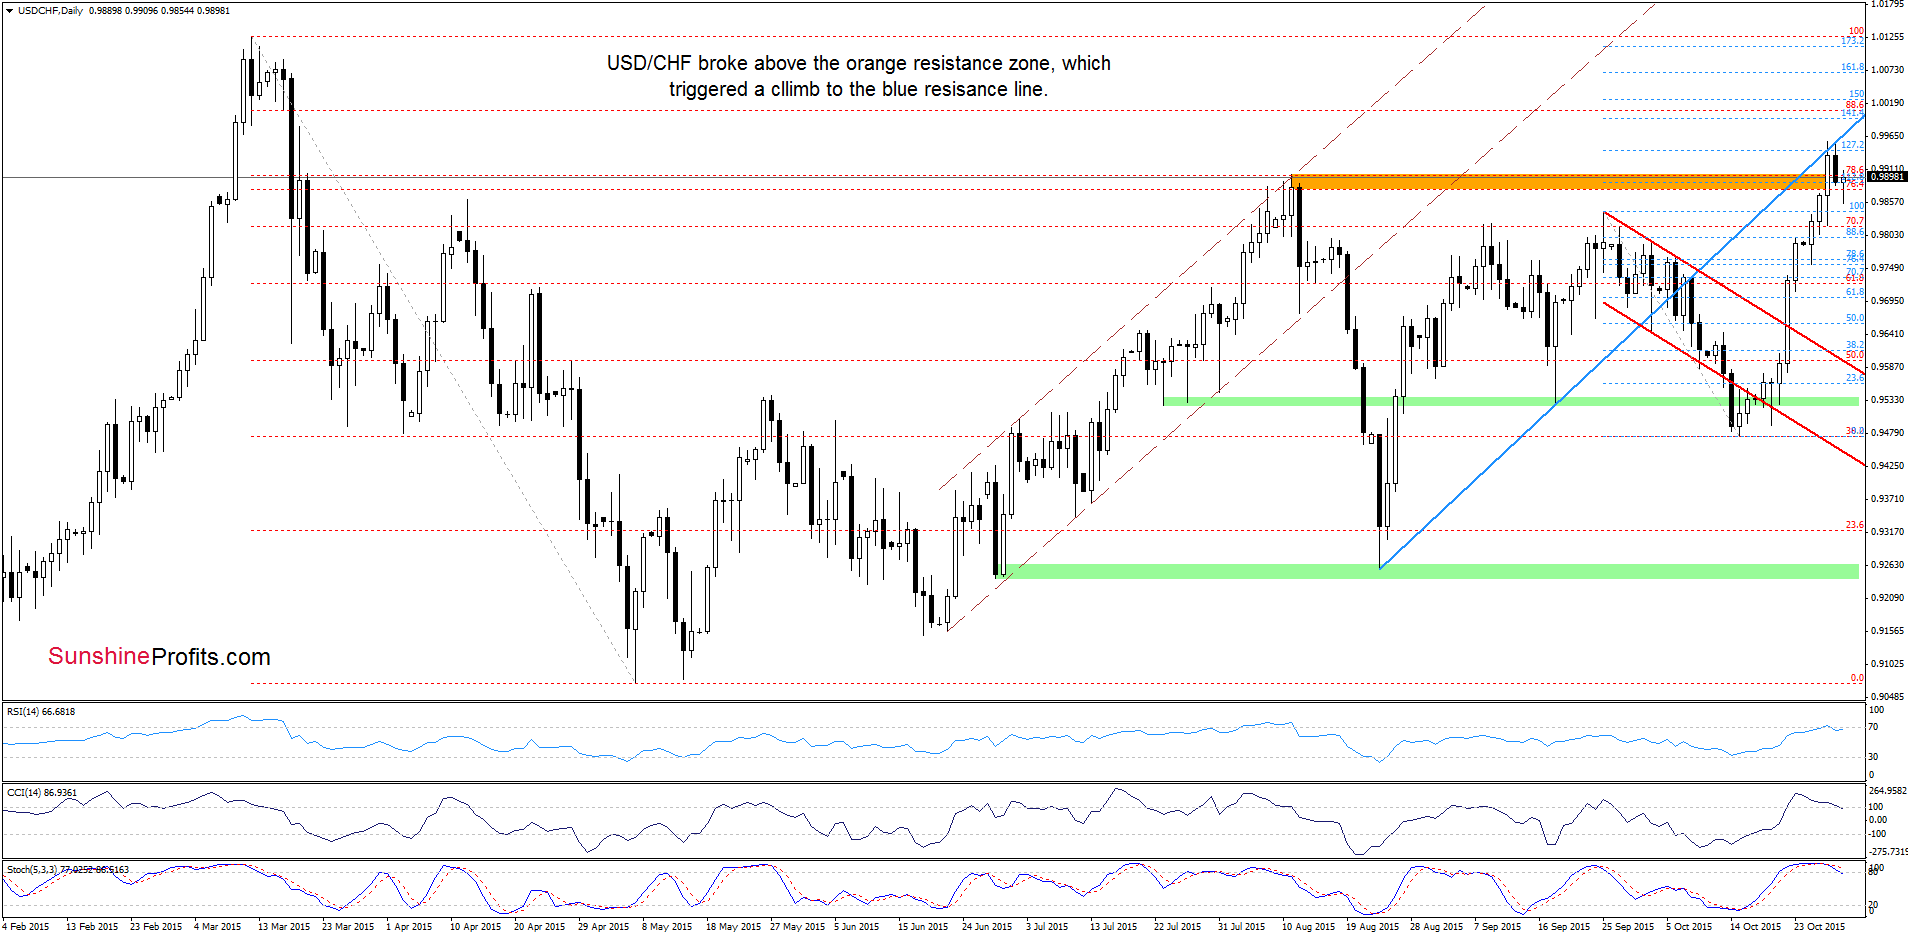
From today’s point of view we see that USD/CHF extended gains and broke above the orange resistance area, which triggered a climb to the blue resistance line and the 127.2% Fibonacci extension. As we mentioned earlier if we see a daily/weekly closure above this zone, it would be a bullish signal, which will likely translate to a breakout above the blue line and a test of the 88.6% Fibonacci retracement level. Nevertheless, we should keep in mind that the current position of the indicators suggests that reversal in the coming days is very likely.
Very short-term outlook: mixed
Short-term outlook: mixed
MT outlook: mixed
LT outlook: mixed
Trading position (short-term; our opinion): No positions are justified from the risk/reward perspective at the moment. We will keep you informed should anything change, or should we see a confirmation/invalidation of the above.
AUD/USD
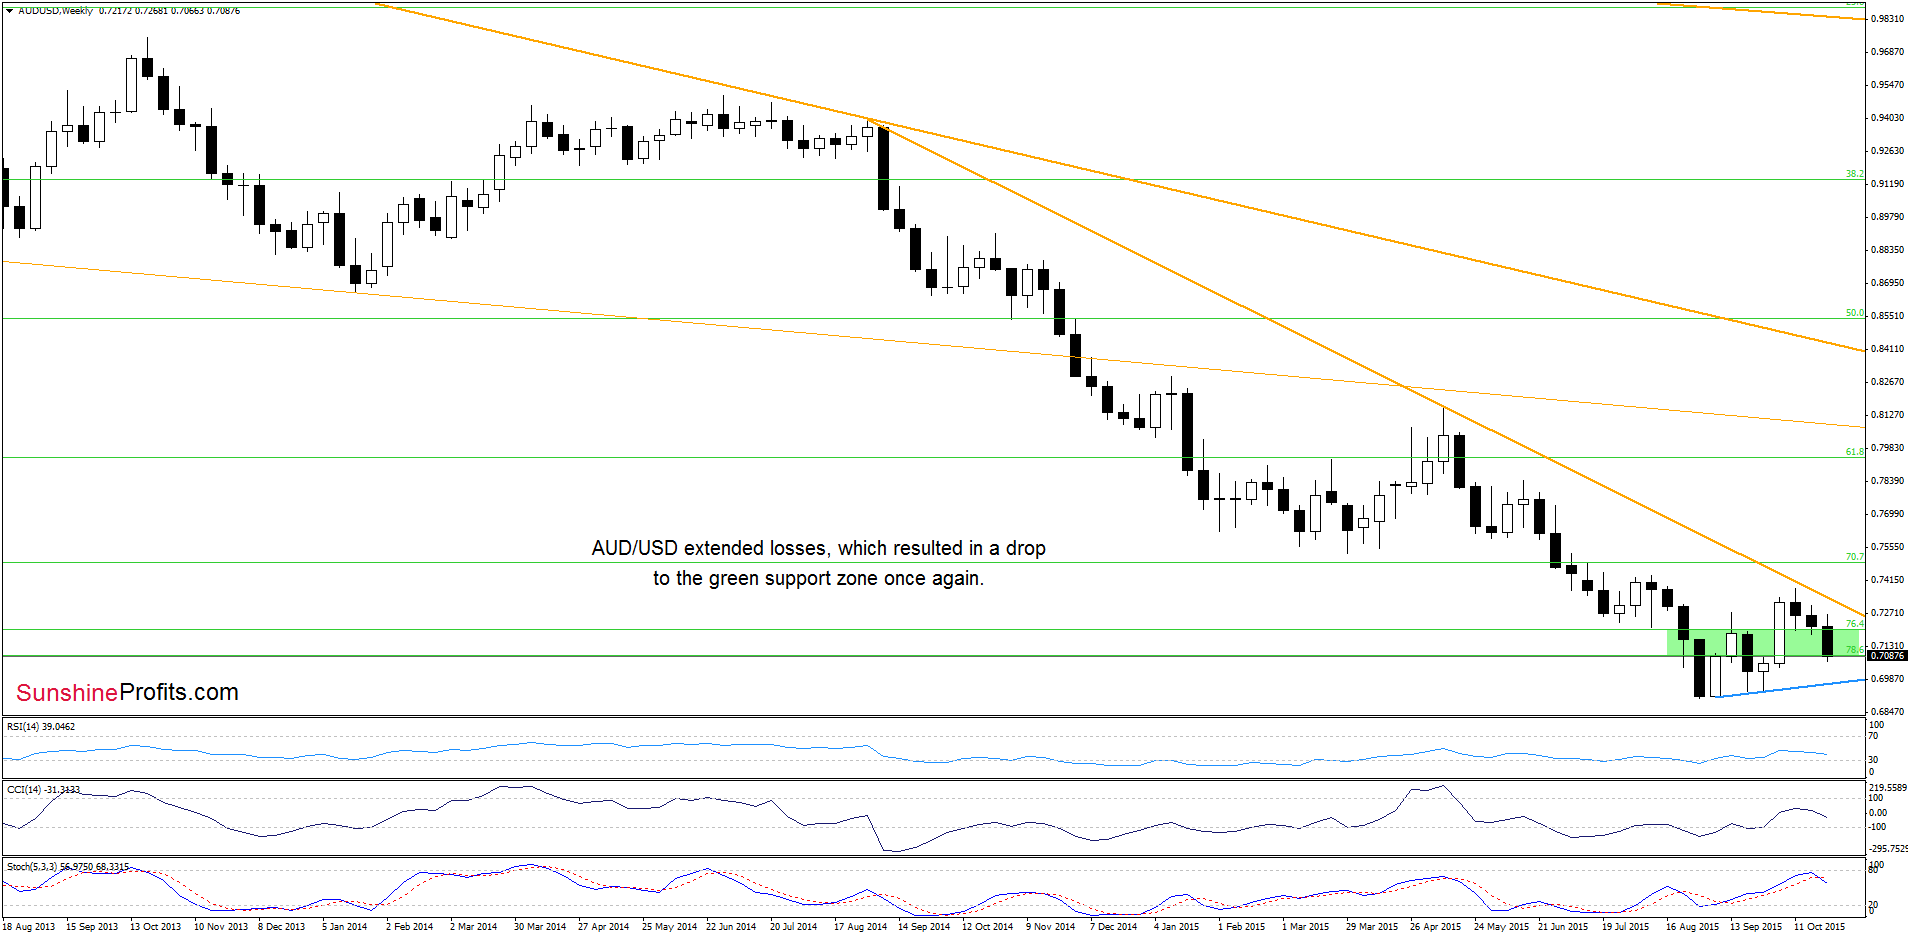
Looking at the weekly chart we see that AUD/USD extended losses, which resulted in a drop to the green support zone.
Will we see further deterioration? Let’s examine the very short-term picture and find out.
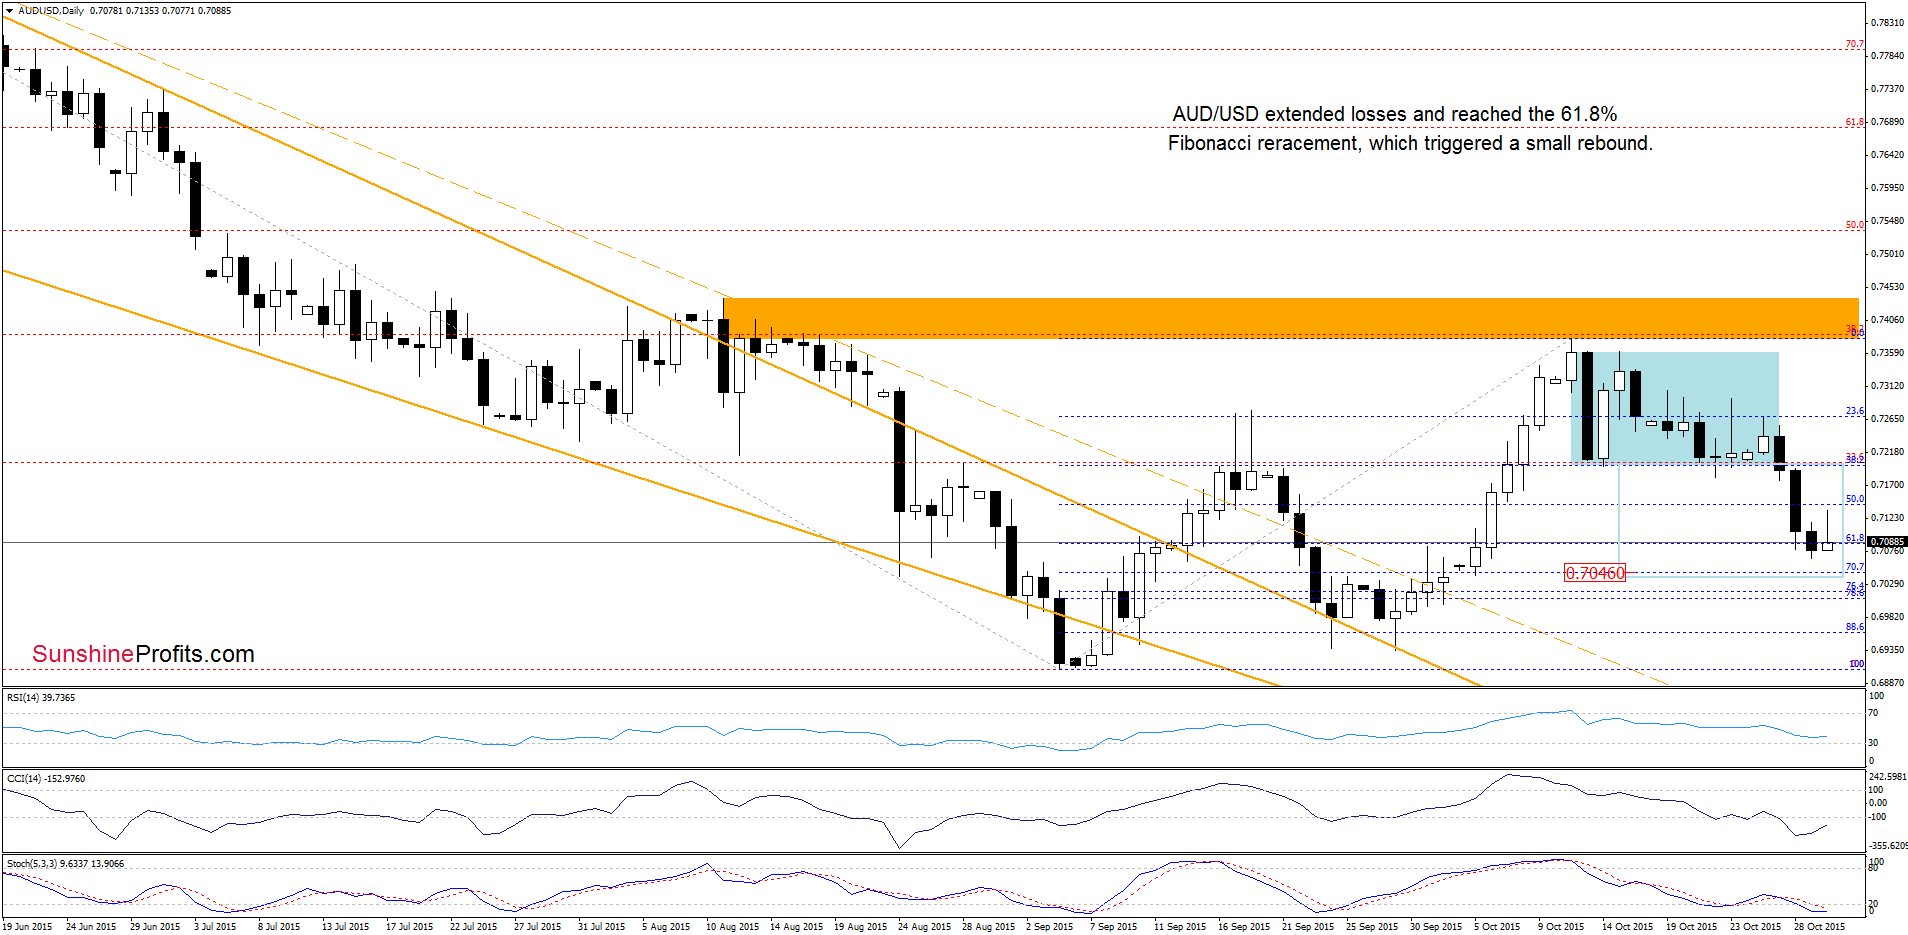
On the daily chart we see that currency bears pushed the pair lower, which means that our previous commentary on this currency pair is up-to-date:
(…)the pair broke below the 50% Fibonacci retracement, which suggests that AUD/USD will decline to the next Fibonacci retracement. Nevertheless, taking into account the breakdown below the lower line of the formation, we think that the exchange rate could decline even to around 0.7046, where the size of the downswing will correspond to the height of the consolidation.
Very short-term outlook: mixed with bearish bias
Short-term outlook: mixed
MT outlook: mixed
LT outlook: mixed
Trading position (short-term; our opinion): No positions are justified from the risk/reward perspective at the moment. We will keep you informed should anything change, or should we see a confirmation/invalidation of the above.
Thank you.
Nadia Simmons
Forex & Oil Trading Strategist
Przemyslaw Radomski, CFA
Founder, Editor-in-chief
Gold & Silver Trading Alerts
Forex Trading Alerts
Oil Investment Updates
Oil Trading Alerts

