

Earlier today, the USD Index moved lower as uncertainty around today’s Federal Reserve’s rate statement later in the day weighs on investors’ sentiment. As a result, EUR/USD climbed to the key resistance zone for the third time in a row. Will we see an invalidation of the breakdown in the coming days?
In our opinion the following forex trading positions are justified - summary:
- EUR/USD: short (half positions with a stop-loss order at 1.1887; the downside target around 1.0938)
- GBP/USD: none
- USD/JPY: none
- USD/CAD: none
- USD/CHF: none
- AUD/USD: none
EUR/USD
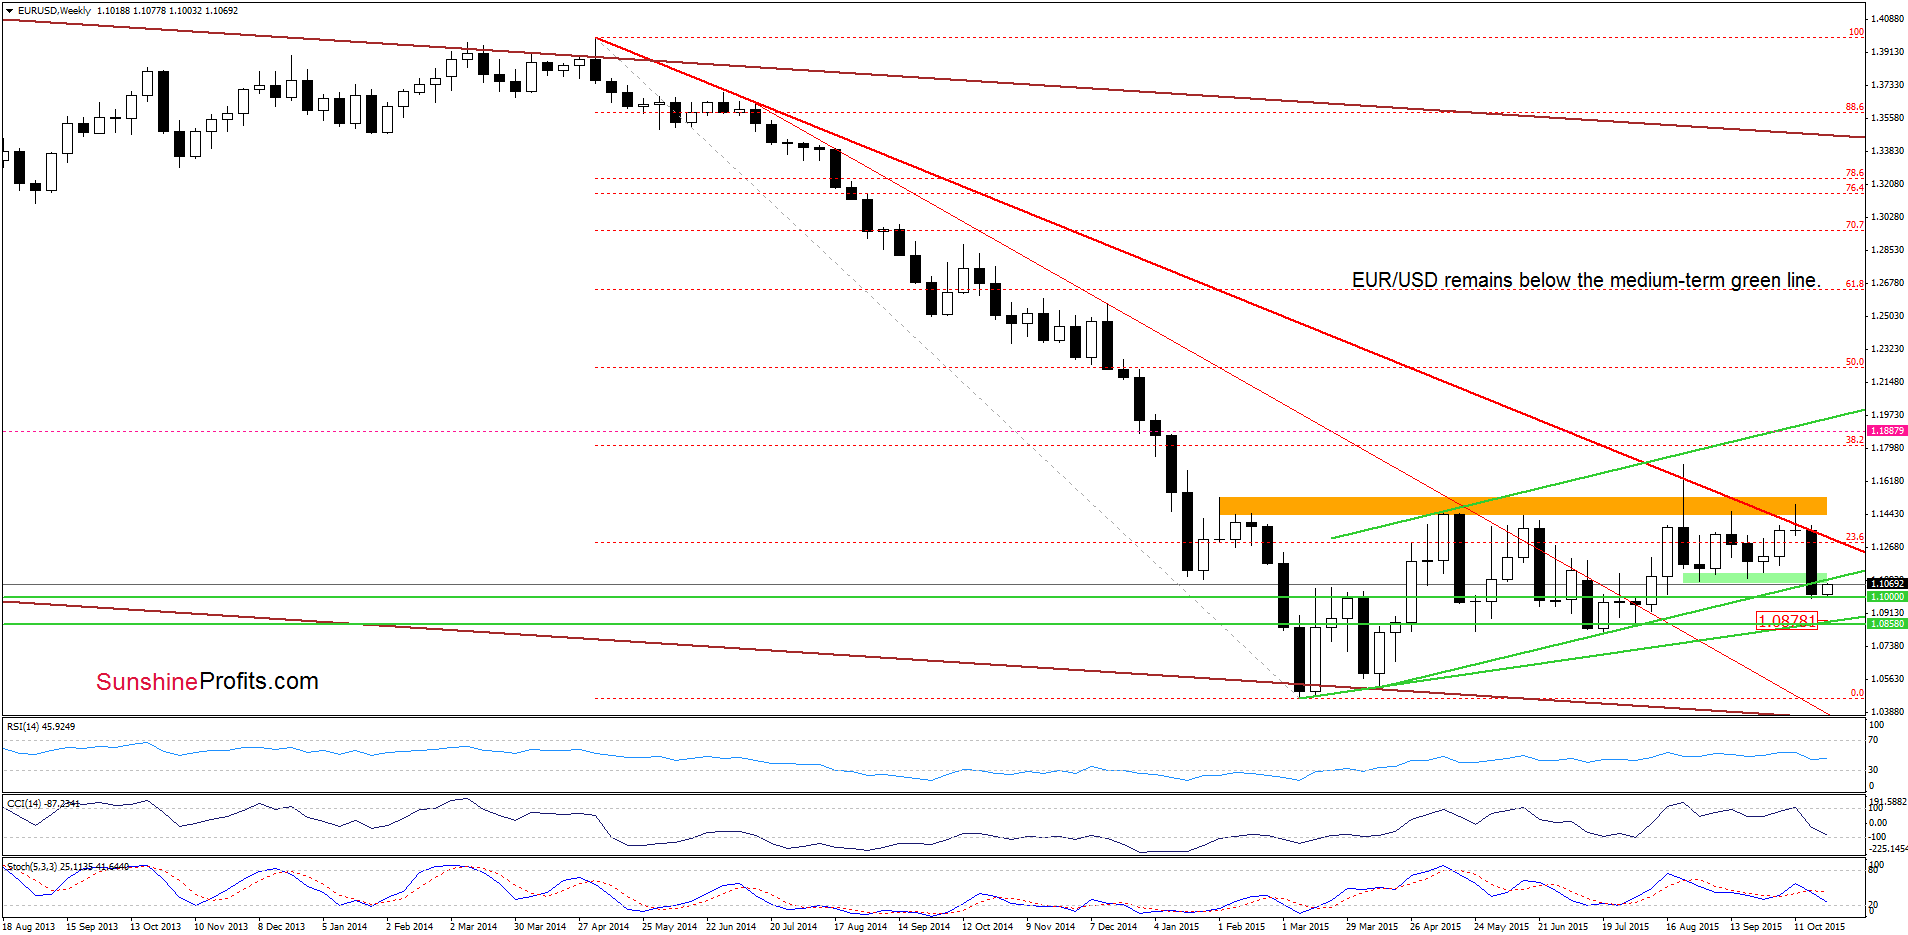
Looking at the weekly chart we see that although EUR/USD moved little higher, the exchange rate remains under the previously-broken green zone and the long-term green line, which serves as an additional resistance.
What can we infer from the daily hart? Let’s check.
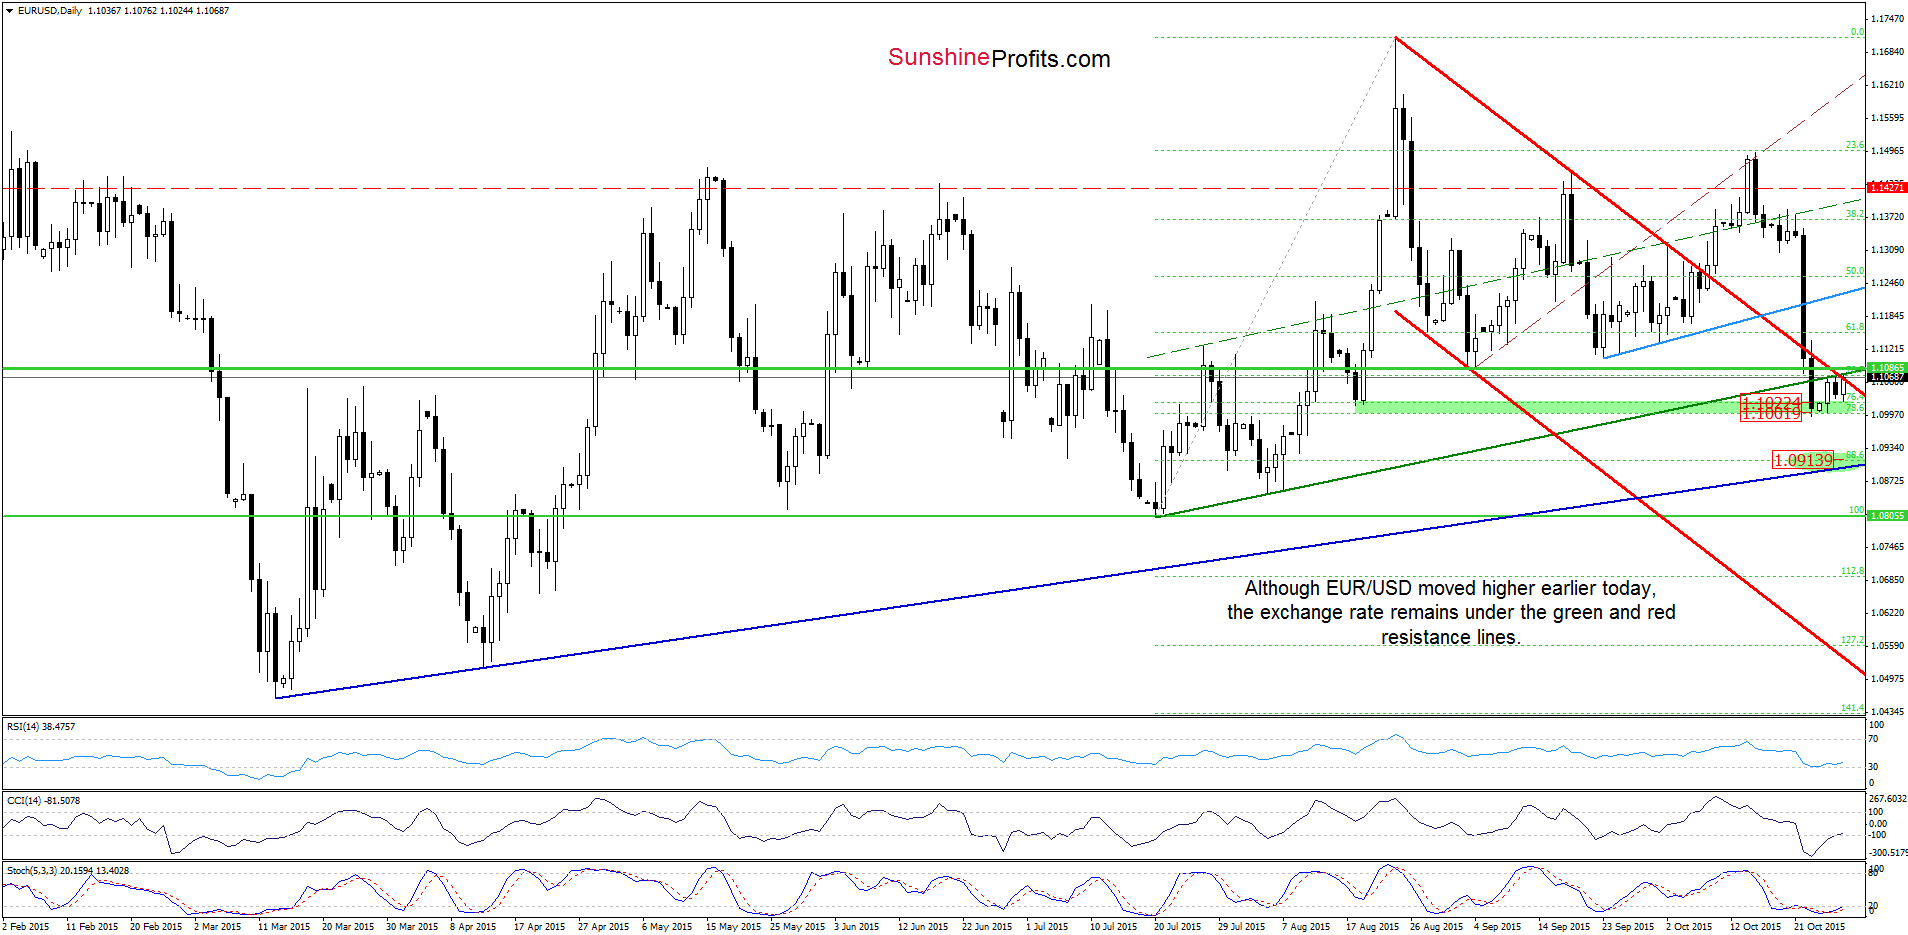
Earlier today, EUR/USD moved higher and climbed to the previously-broken medium-term green line and the upper border of the red declining trend channel for the third time in a row. Despite this increase, the exchange rate remains below this key resistance zone. Nevertheless, the current position of the indicators suggests that we may see a corrective rebound in the coming day(s). In this case, the initial upside target for currency bulls would be around 1.111, where the 23.6% Fibonacci retracement (based on the entire recent decline) is. Please keep in mind that this scenario will be more reliable only if we see a daily closure above the key resistance lines. In other case, another unsuccessful attempt to move higher will mean that today’s move might be nothing more than a verification of earlier breakdown. In this case, if the exchange rate declines from here, it would be another bearish signal, which will likely trigger a downswing and a test of the recent lows. If this support is broken, and EUR/USD extends losses, breaking below the Friday’s low of 1.0996, the next downside target for currency bears would be around 1.0912, where the 88.6% Fibonacci retracement and the long-term navy blue support line are (marked with the green ellipse on the chart).
Very short-term outlook: bearish
Short-term outlook: bearish
MT outlook: mixed with bearish bias
LT outlook: mixed
Trading position (short-term; our opinion): Short positions (which are already profitable as we entered them when EUR/USD was at about 1.1427) with a stop-loss order at 1.1887 are justified from the risk/reward perspective. Nevertheless, taking into account the uncertainty around today’s Federal Reserve’s rate statement later in the day we decided to close half of our short positions and take profits off the table. We will keep you informed should anything change, or should we see a confirmation/invalidation of the above.
USD/CHF
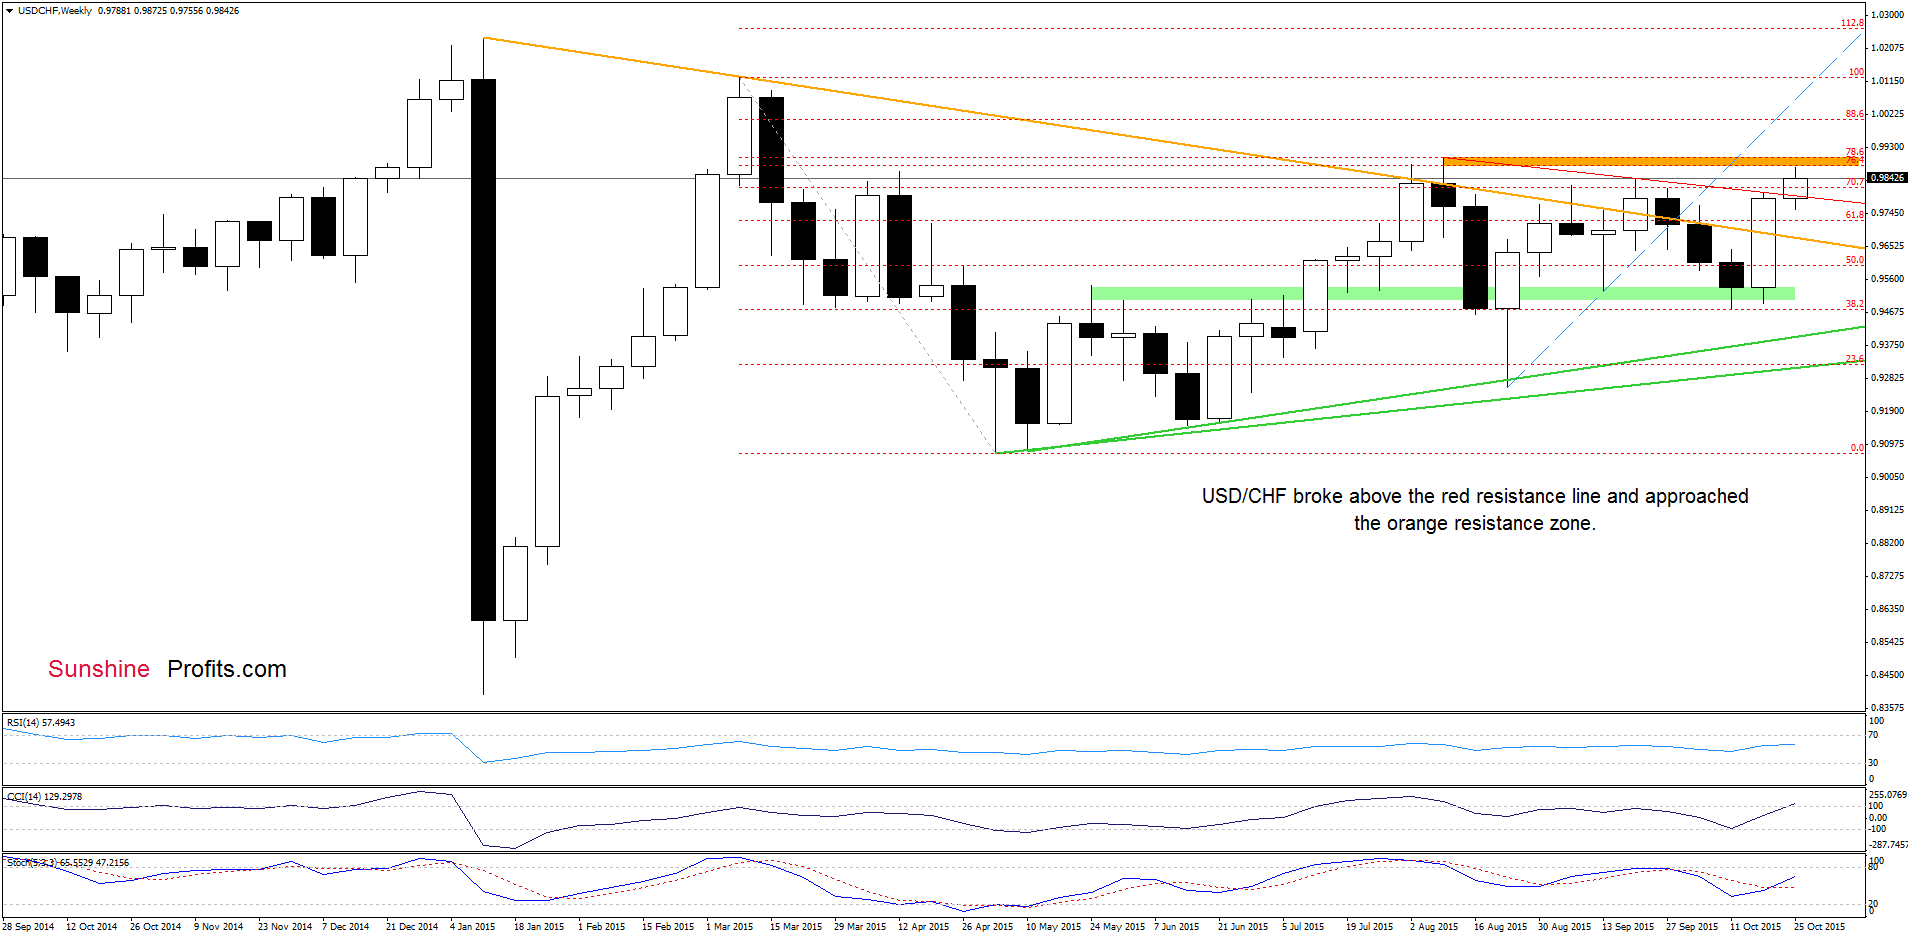
Quoting our previous commentary on this currency pair:
(…) the exchange rate extended rally and broke above the red line, which suggests further improvement in the coming days. How low could the pair go? In our opinion, the initial upside target would be the Sept high, however, if it is broken, we may see an increase even to the orange resistance zone (marked on the weekly chart) created by the 76.4% and 78.6% Fibonacci retracement levels and the Aug high.
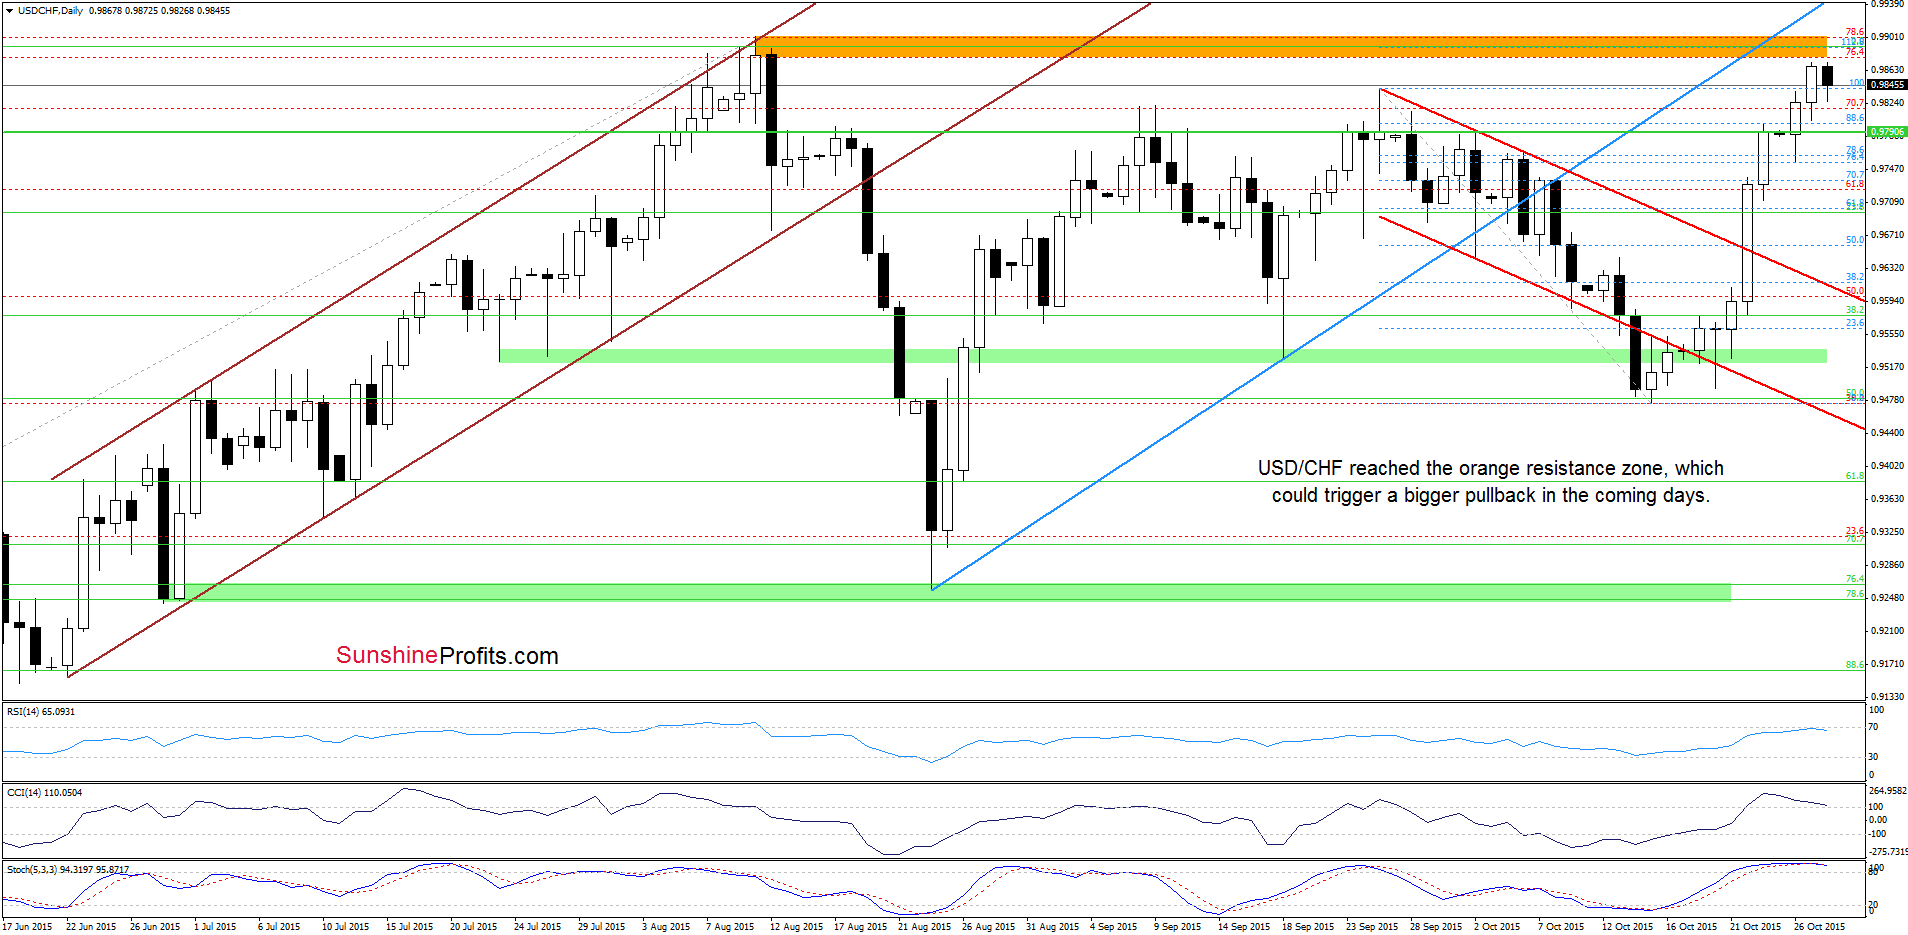
From today’s point of view we see that the situation developed in line with the above scenario and USD/CHF approached our upside target. Taking into account the proximity to this resistance zone and the current position of the indicators, we think that reversal in the coming days is very likely. If this is the case, and the pair declines from here, the initial downside target would be around 0.9718, where the 38.2% Fibonacci retracement based on the Oct rally is.
Very short-term outlook: mixed with bearish bias
Short-term outlook: mixed
MT outlook: mixed
LT outlook: mixed
Trading position (short-term; our opinion): No positions are justified from the risk/reward perspective at the moment. We will keep you informed should anything change, or should we see a confirmation/invalidation of the above.
AUD/USD
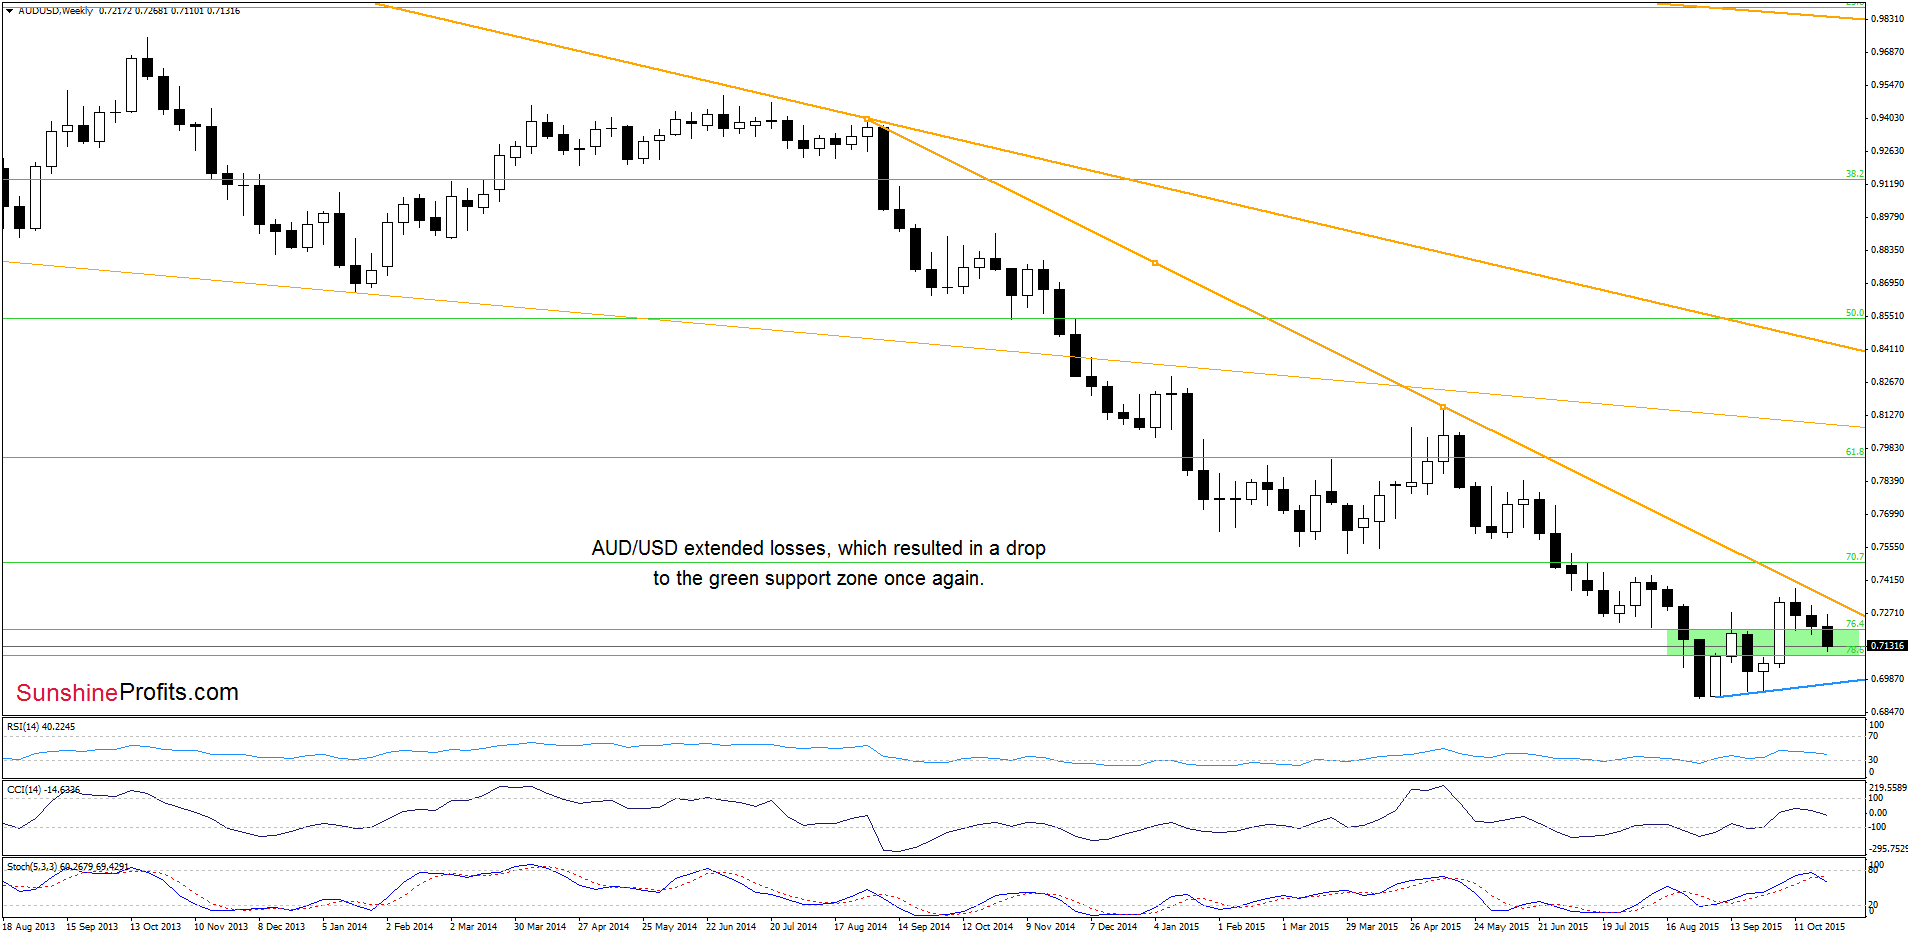
Looking at the weekly chart we see that AUD/USD extended losses, which resulted in a drop to the green support zone. Will we see further deterioration? Let’s examine the very short-term picture and find out.
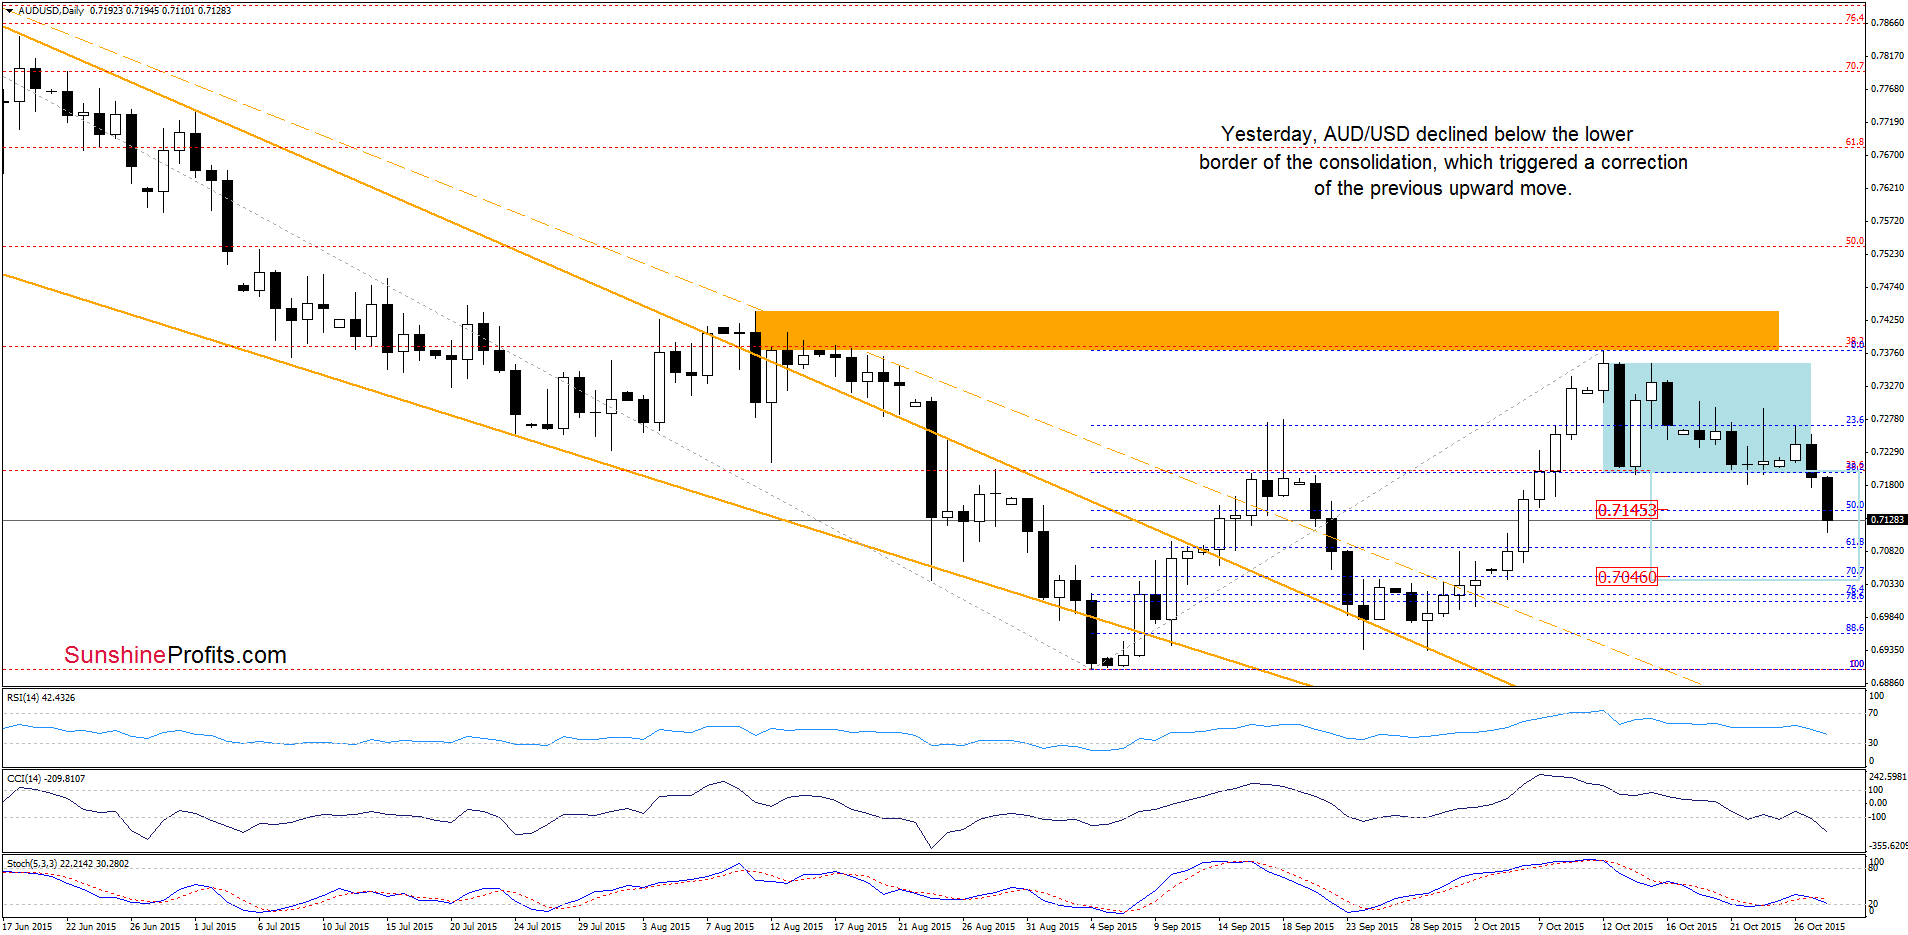
On the daily chart we see that currency bears pushed the pair below the lower border of the consolidation, which triggered a correction of the previous upward move. Earlier today, the pair broke below the 50% Fibonacci retracement, which suggests that AUD/USD will decline to the next Fibonacci retracement. Nevertheless, taking into account the breakdown below the lower line of the formation, we think that the exchange rate could decline even to around 0.7046, where the size of the downswing will correspond to the height of the consolidation.
Very short-term outlook: mixed with bearish bias
Short-term outlook: mixed
MT outlook: mixed
LT outlook: mixed
Trading position (short-term; our opinion): No positions are justified from the risk/reward perspective at the moment. We will keep you informed should anything change, or should we see a confirmation/invalidation of the above.
Thank you.
Nadia Simmons
Forex & Oil Trading Strategist
Przemyslaw Radomski, CFA
Founder, Editor-in-chief
Gold & Silver Trading Alerts
Forex Trading Alerts
Oil Investment Updates
Oil Trading Alerts

