

Earlier today, the Australian dollar moved higher against its U.S. counterpart after the People's Bank of China unexpectedly lowered rates for the sixth time since last November. As a result, AUD/USD reversed and bounced off the support area. Will we see a climb above 0.7300 in the coming week?
In our opinion the following forex trading positions are justified - summary:
- EUR/USD: short (a stop-loss order at 1.1887; the downside target around 1.0938)
- GBP/USD: none
- USD/JPY: none
- USD/CAD: none
- USD/CHF: none
- AUD/USD: none
EUR/USD
Quoting our Friday’s Forex Trading Alert:
(…) the weekly CCI generated a sell signal (similarly to what we saw in Aug), while the Stochastic Oscillator is close to doing the same, which suggests that even if we see a rebound from here, further deterioration in the coming weeks is more likely than not.Therefore, if EUR/USD drops under the above-mentioned support area the initial downside target would be around 1.1000-1.1022, where the next green support zone is.
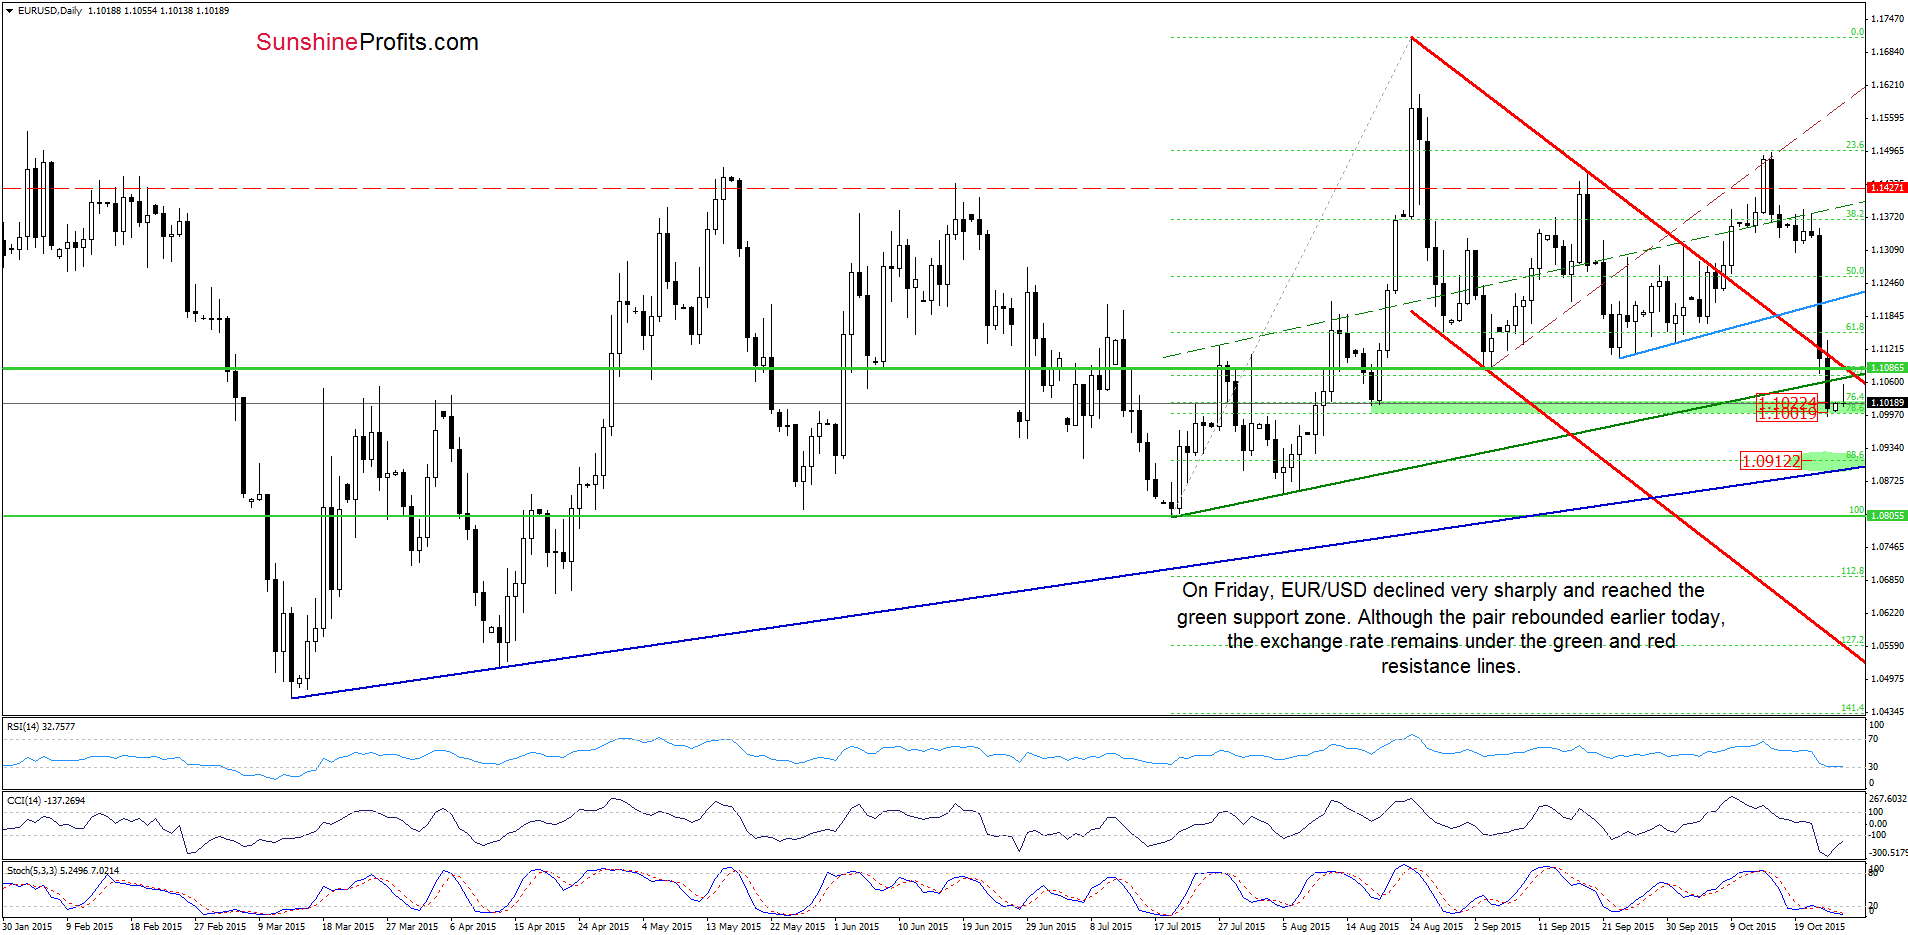
Looking at the daily chart, we see that the situation developed in line with the above scenario and EUR/USD declined to the green support zone (created by the 76.4% and 78.6% Fibonacci retracement levels and reinforced by the barrier of 1.1000) on Friday, which could trigger a rebound in the coming day(s). Nevertheless, as long as there is no invalidation of the breakdown under the medium-term green resistance line (based on the Jul and Aug lows) and the upper border of the red declining trend channel another attempt to move lower should not surprise us. If this is the case, and EUR/USD extends losses, breaking below the Friday’s low of 1.0996, the next downside target for currency bears would be around 1.0912, where the 88.6% Fibonacci retracement and the long-term navy blue support line are (marked with the green ellipse on the chart).
Having said that, let’s check what impact Friday’s decline had on the medium-term picture.
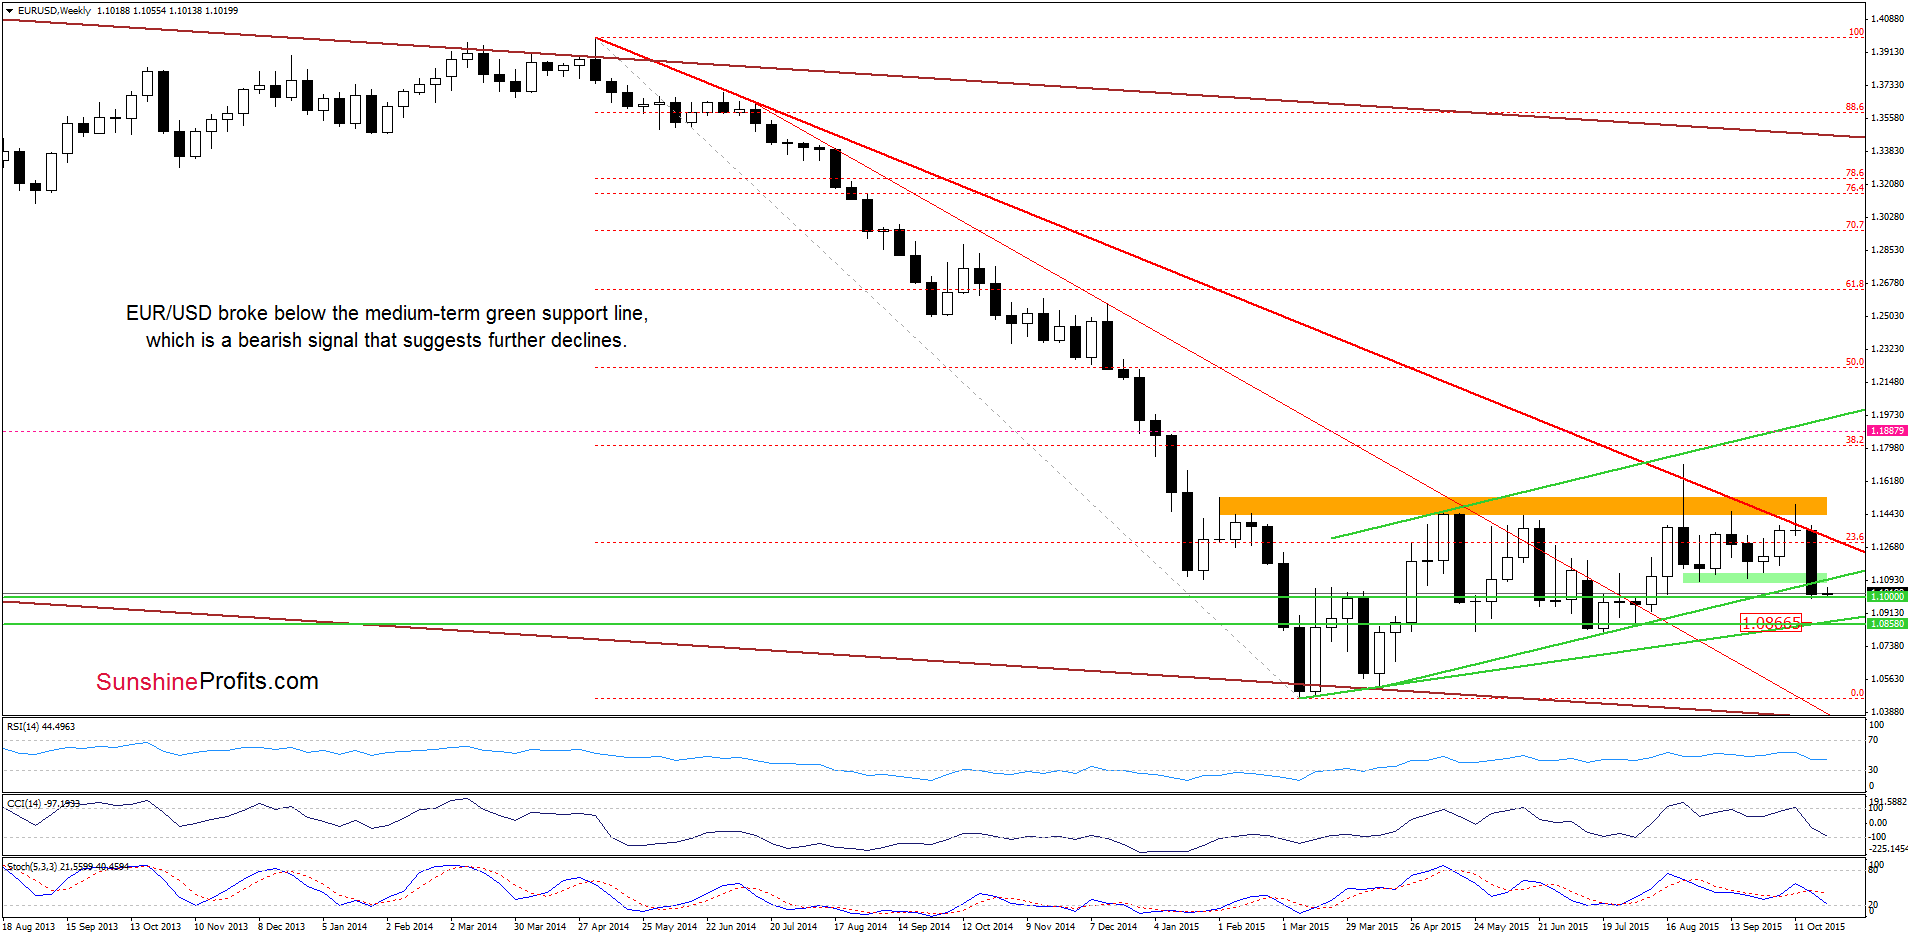
From this perspective, we see that the situation in the medium term has deteriorated significantly as the exchange rate broke under the key support zone and closed the week below it. This is a bearish signal, which suggests that we may see a decline even to around 1.0878, where the long-term green support line (based on the Apr, Jul and Aug lows) is.
Very short-term outlook: bearish
Short-term outlook: bearish
MT outlook: mixed with bearish bias
LT outlook: mixed
Trading position (short-term; our opinion): Short positions with a stop-loss order at 1.1887 are justified from the risk/reward perspective. We will keep you informed should anything change, or should we see a confirmation/invalidation of the above.
USD/CHF
On Friday, we wrote:
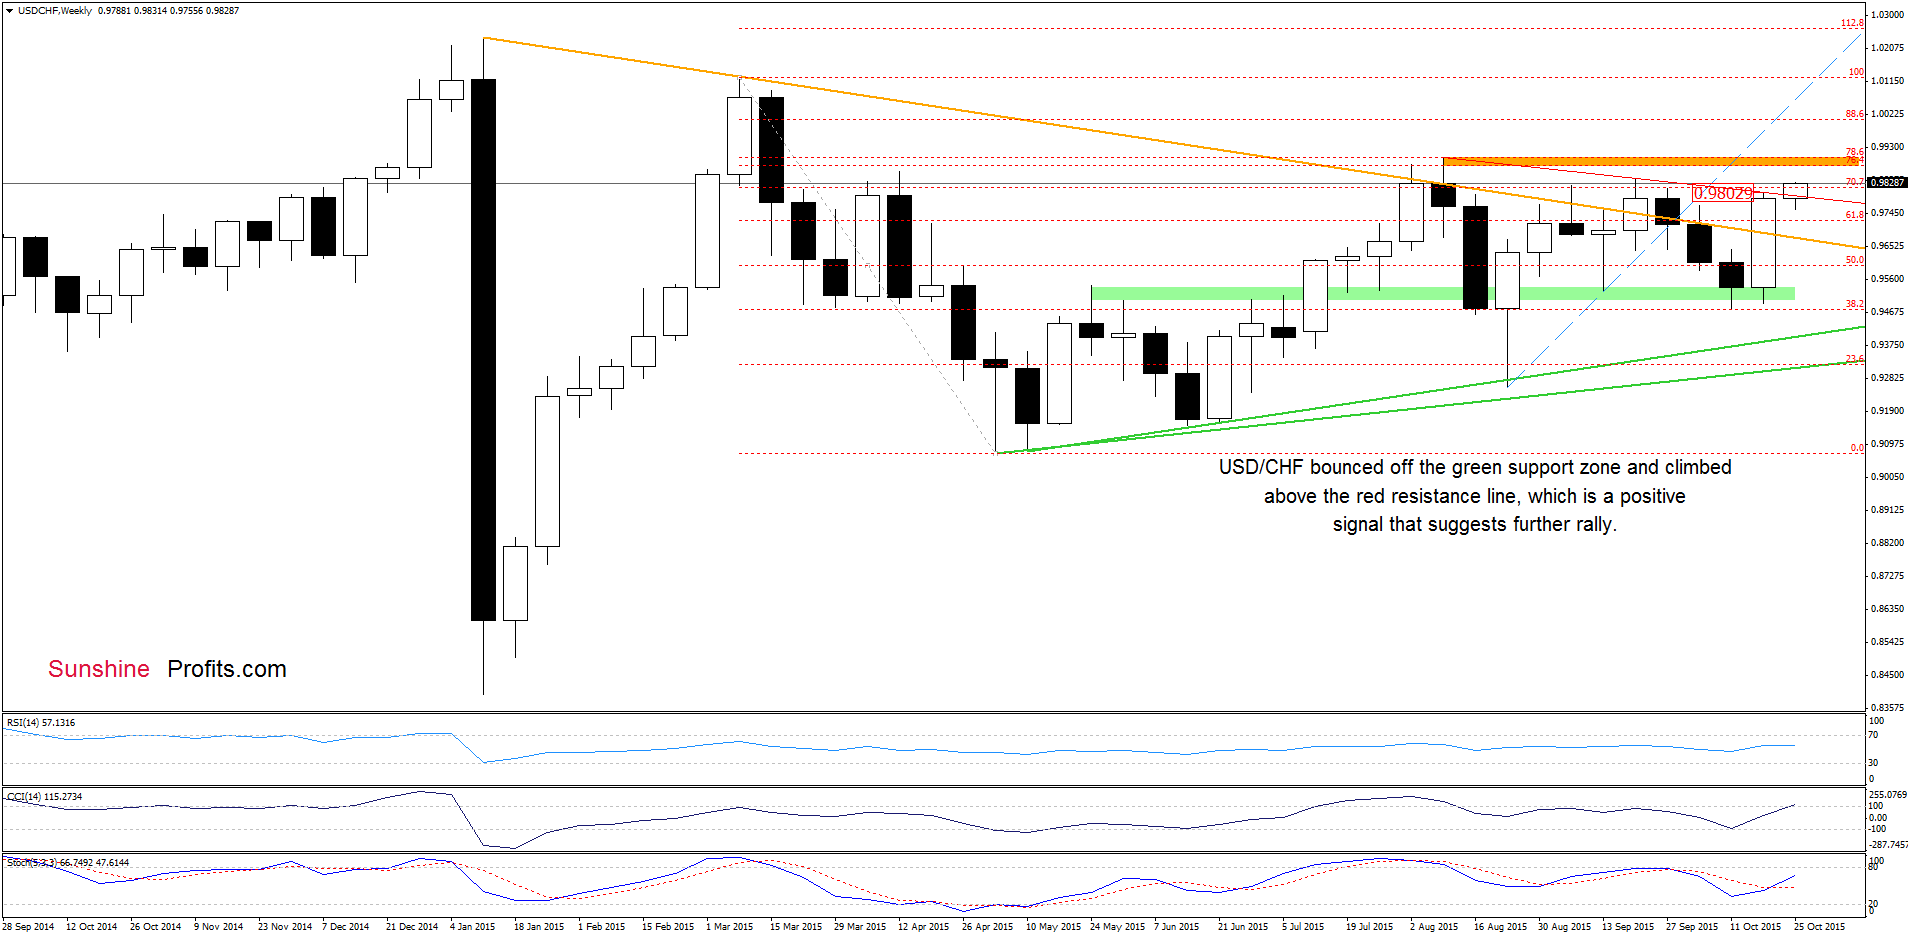
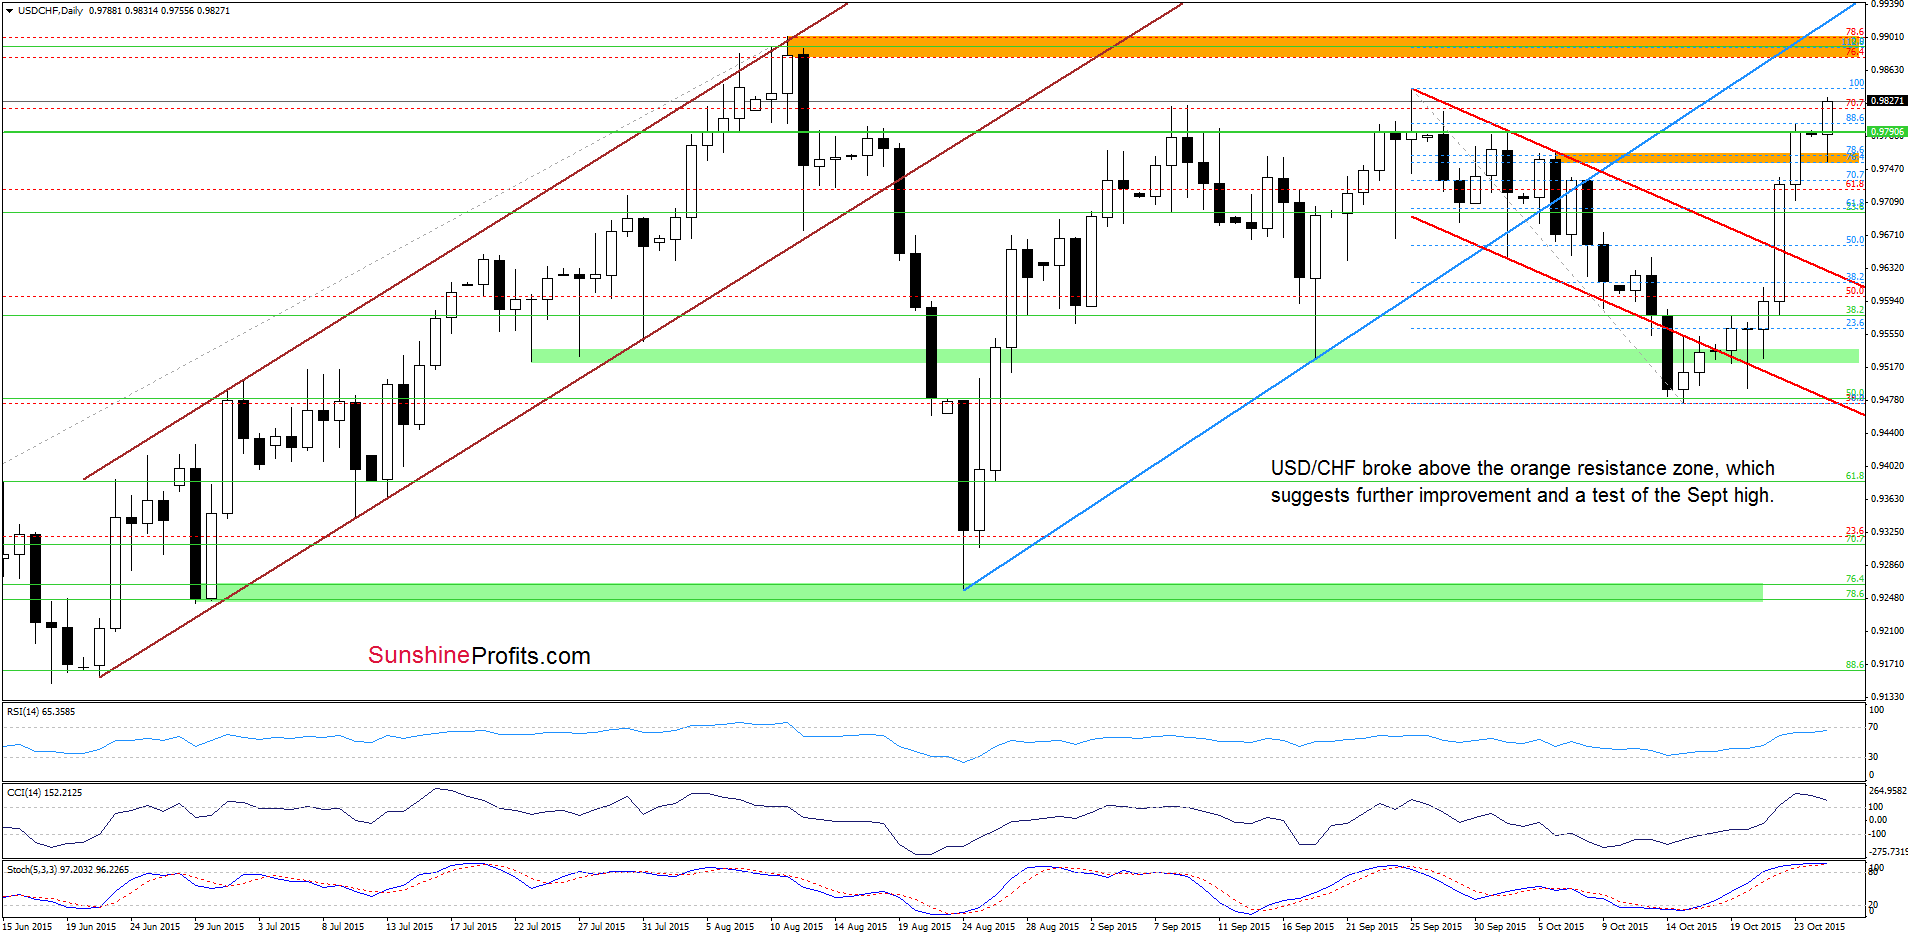
(…) the exchange rate broke above the upper border of the declining trend channel, which suggests further improvement and an increase to around 0.9755-0.9763, where the orange resistance zone (created by the 76.4% and 78.6% Fibonacci retracement levels) is. If this area is broken, the next upside target would be around 0.9800, where the red declining resistance line (based on the Aug and Sept highs and marked on the weekly chart) is.
As you see on the charts currency bulls pushed USD/CHF higher as we had expected. With Friday’s upswing, the pair broke above the orange resistance zone and climbed to the red declining resistance line. Thanks to these bullish signals, the exchange extended rally and broke above the red line, which suggests further improvement in the coming days. How low could the pair go? In our opinion, the initial upside target would be the Sept high, however, if it is broken, we may see an increase even to the orange resistance zone (marked on the weekly chart) created by the 76.4% and 78.6% Fibonacci retracement levels and the Aug high. Nevertheless, please keep in mind that the current position of the indicators suggests that reversal in the coming week is very likely.
Very short-term outlook: mixed with bullish bias
Short-term outlook: mixed
MT outlook: mixed
LT outlook: mixed
Trading position (short-term; our opinion): No positions are justified from the risk/reward perspective at the moment. We will keep you informed should anything change, or should we see a confirmation/invalidation of the above.
AUD/USD
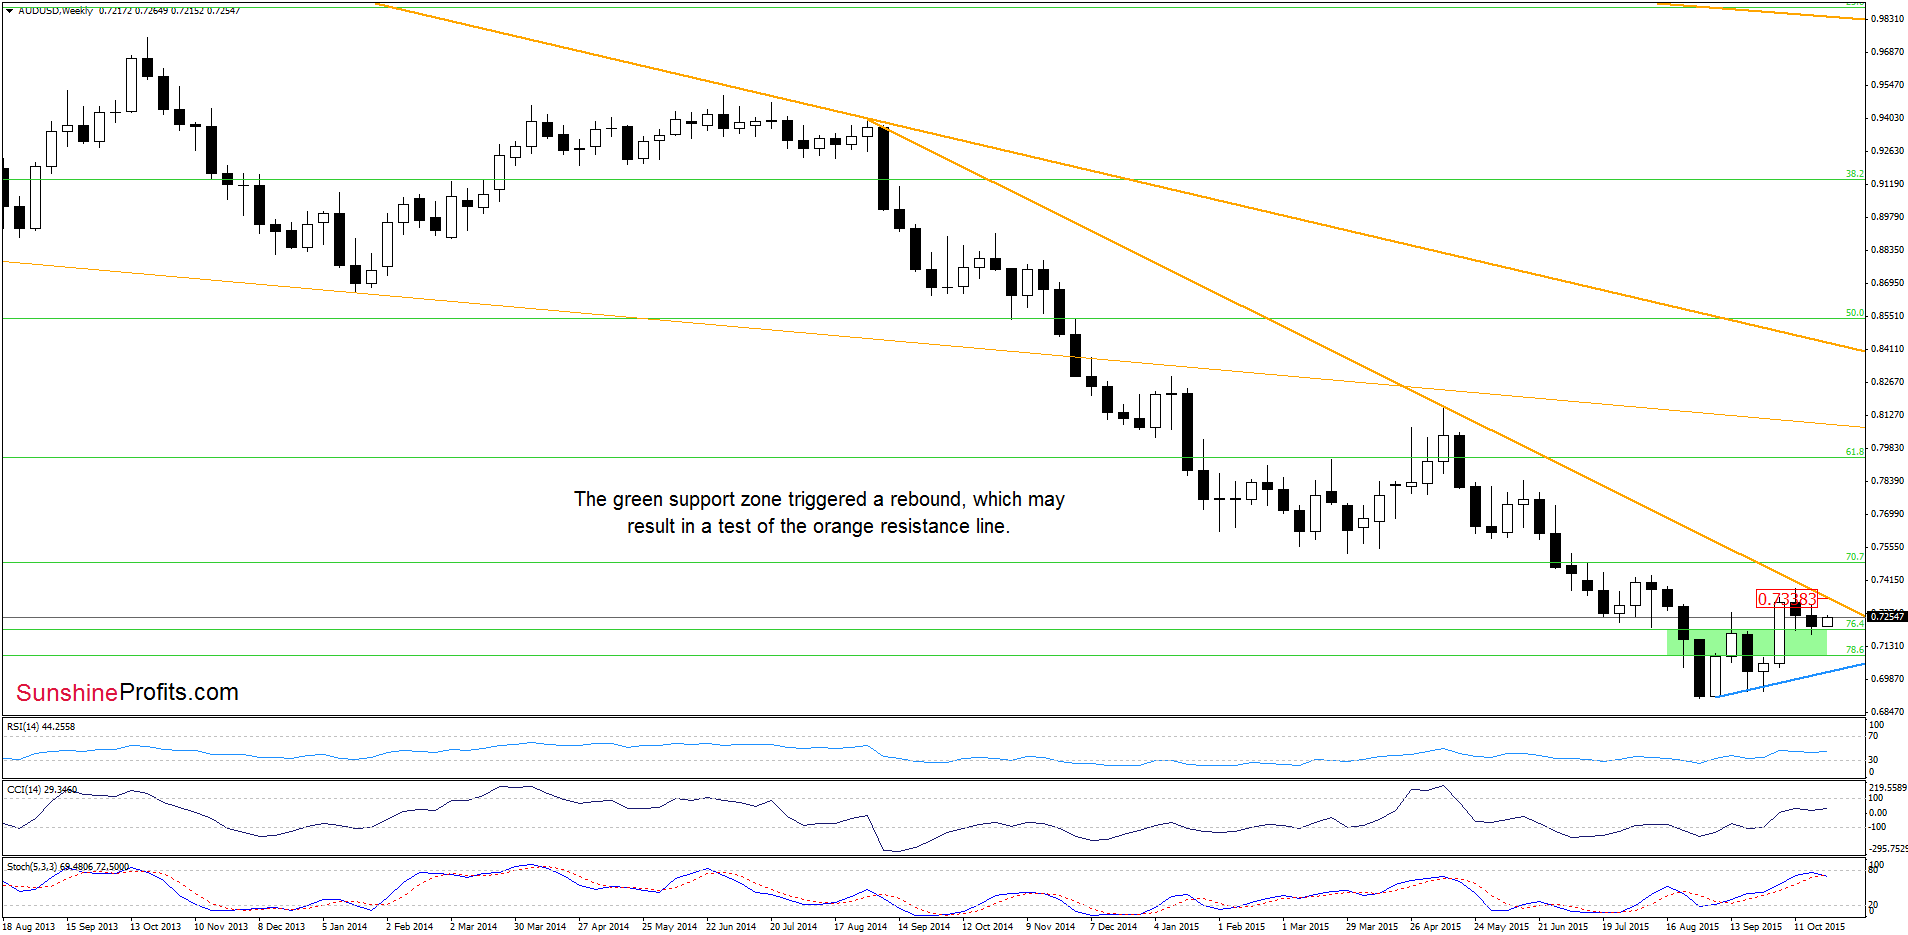
Looking at the weekly chart we see that the green support zone stopped currency bears, which triggered a rebound in the AUD/USD pair.
How did this upswing affect the very short-term picture? Let’s check.
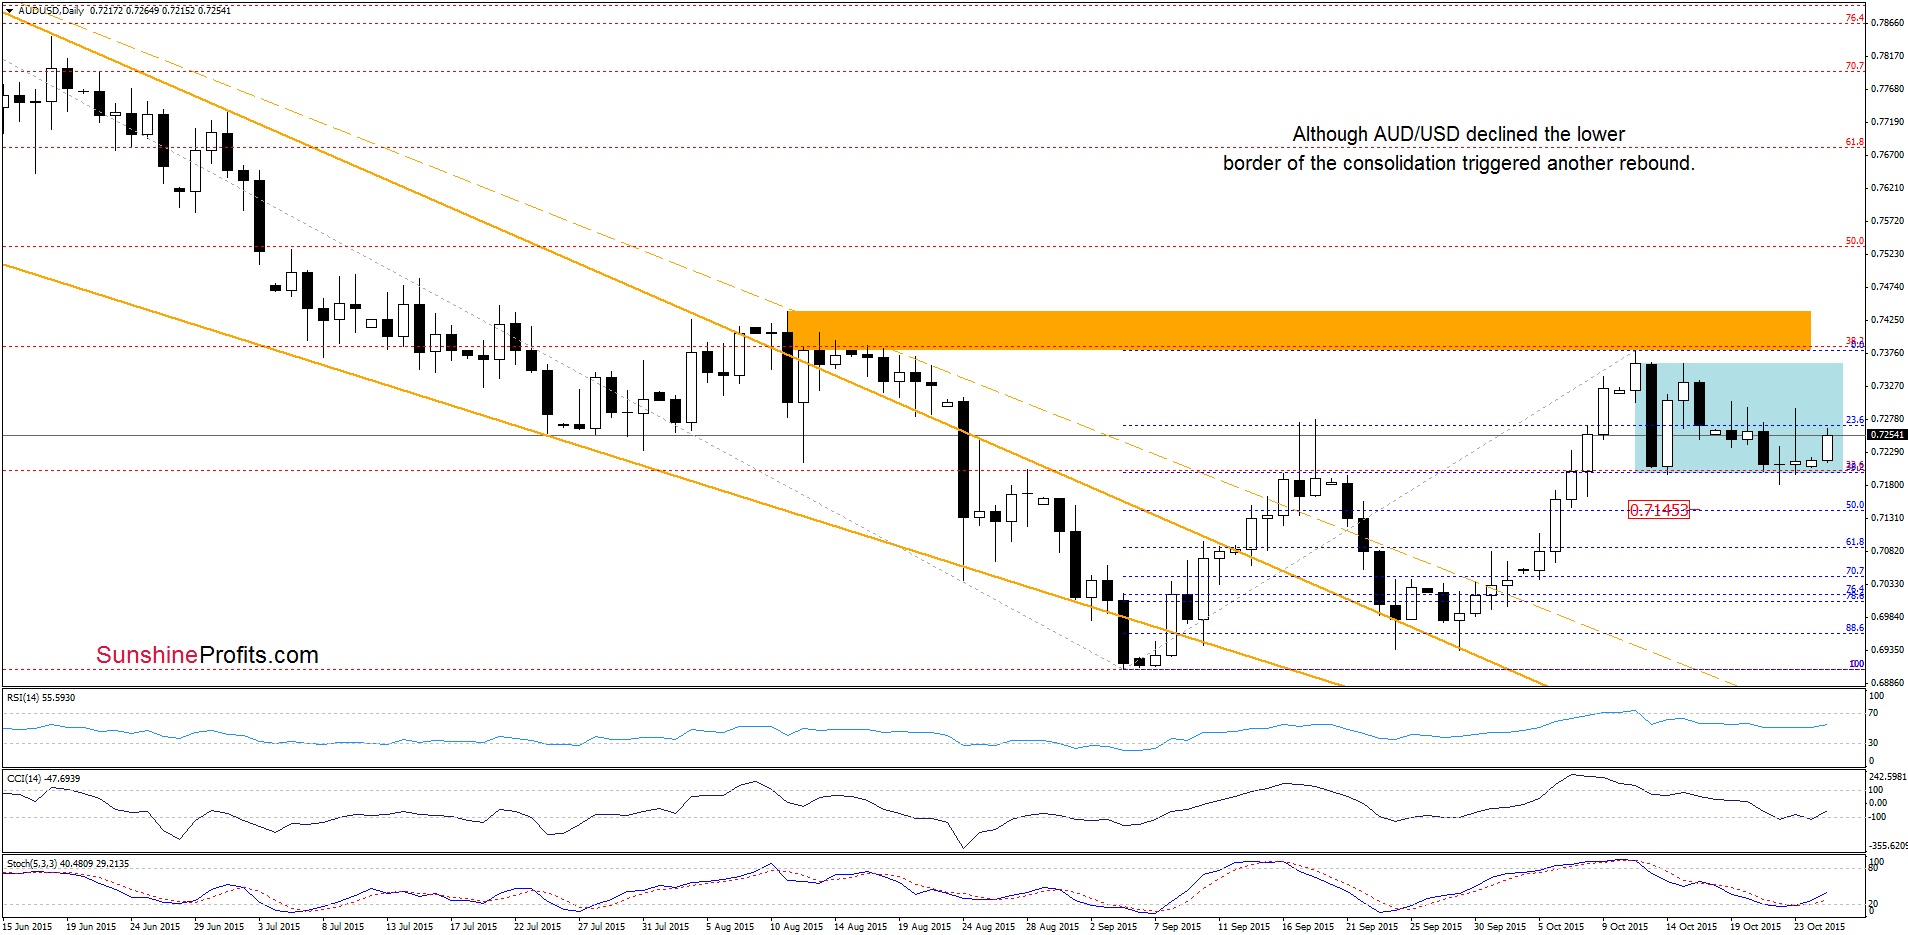
On the daily chart we see that currency bears pushed the pair lower once again, but the proximity to the green support zone (marked on the weekly chart) and the lower border of the consolidation triggered another reversal. Taking this fact into account, and combining it with buy signals generated by the indicators, we think that the exchange rate will extend gains in the coming days and we’ll see a test of the upper border of the consolidation (around 0.7362) and the orange resistance line (marked on the weekly chart) in the coming week.
Very short-term outlook: mixed with bullish bias
Short-term outlook: mixed
MT outlook: mixed
LT outlook: mixed
Trading position (short-term; our opinion): No positions are justified from the risk/reward perspective at the moment. We will keep you informed should anything change, or should we see a confirmation/invalidation of the above.
Thank you.
Nadia Simmons
Forex & Oil Trading Strategist
Przemyslaw Radomski, CFA
Founder, Editor-in-chief
Gold & Silver Trading Alerts
Forex Trading Alerts
Oil Investment Updates
Oil Trading Alerts

