

Yesterday, European Central Bank president Mario Draghi said that the bank is ready to cut interest rates in the euro zone from their current record-low of 0.5% and extend its EUR 60 billion a month bond buying program, as early as its next policy meeting in Frankfurt on Dec. 3. This news in combination with bullish job data (which showed that the number of initial jobless claims in the week ending October 17 increased by 3,000, beating analysts’ expectations for a rise of 9,000) gave the greenback a solid support, which resulted in a sharp rally. In this way, the USD Index surged to an intraday high of 96.50 and approached Sept high. What impact did this increase have on our six currency pairs?
In our opinion the following forex trading positions are justified - summary:
- EUR/USD: short (a stop-loss order at 1.1887; the downside target around 1.0938)
- GBP/USD: none
- USD/JPY: none
- USD/CAD: none
- USD/CHF: none
- AUD/USD: none
EUR/USD
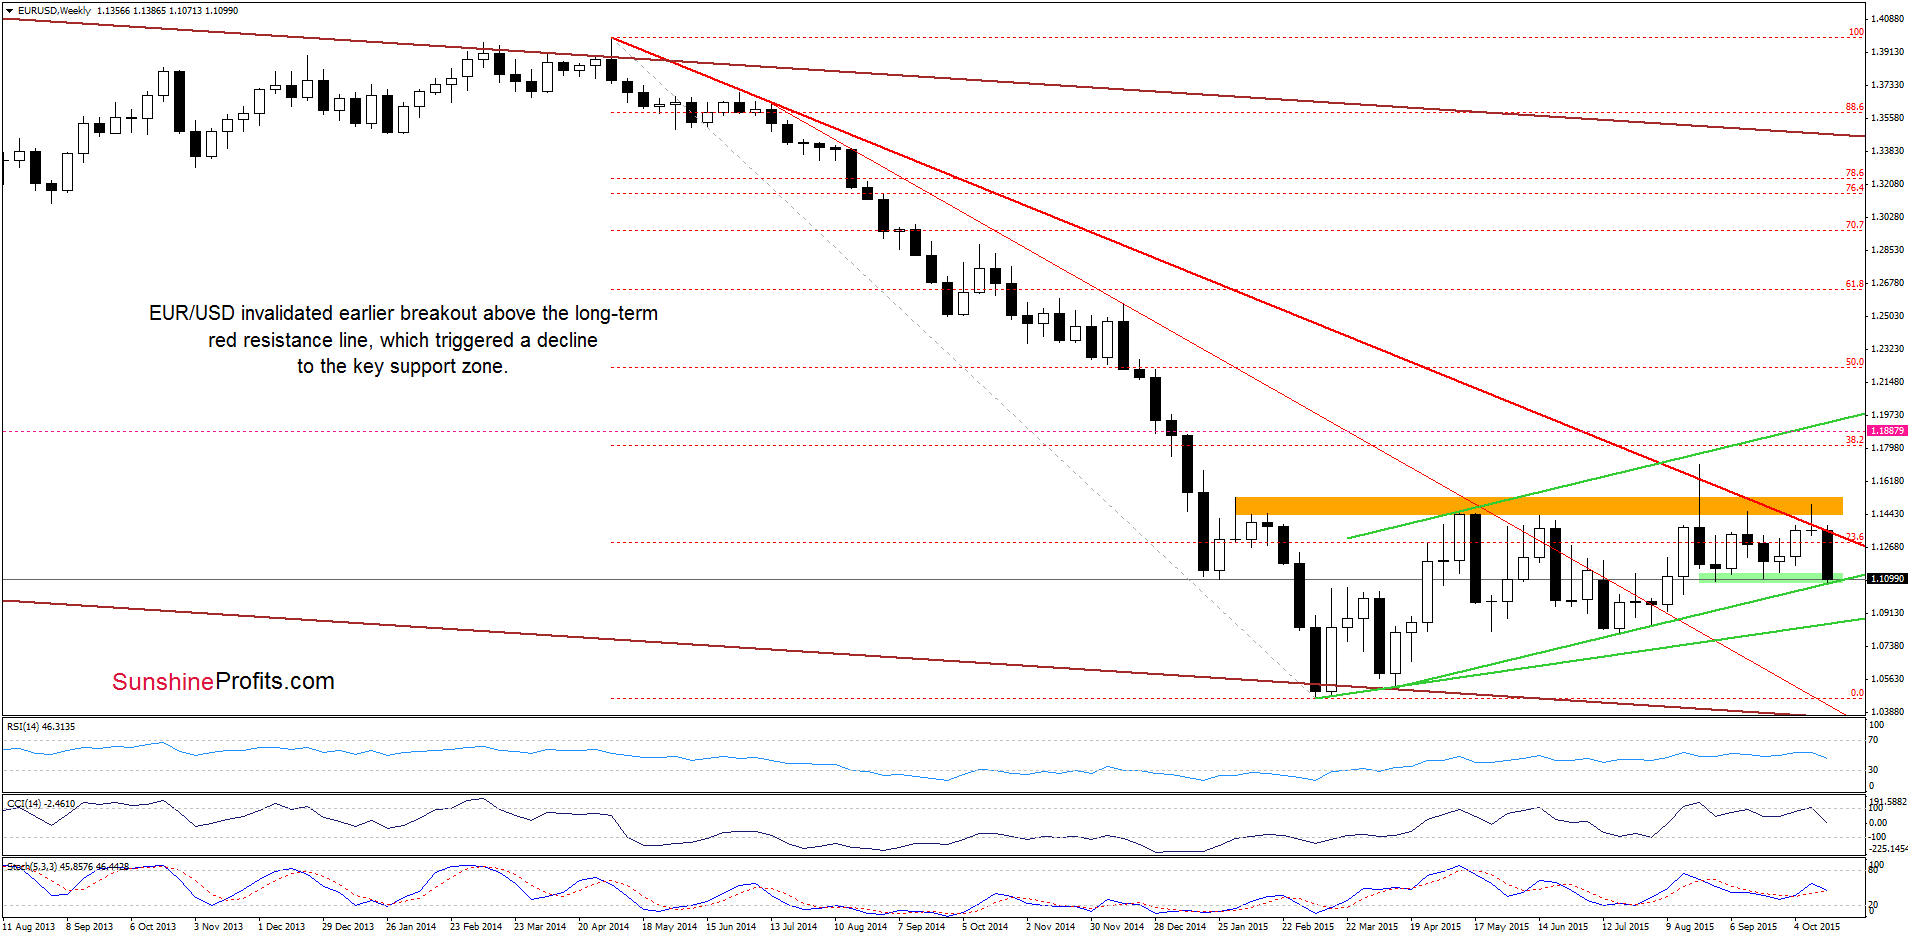
The situation in the medium term deteriorated significantly as the long-term red declining resistance line triggered a very sharp decline, which took the exchange rate to the key support zone.
What impact did this decline have on the daily chart? Let’s check.
Quoting our Monday’s Forex Trading Alert:
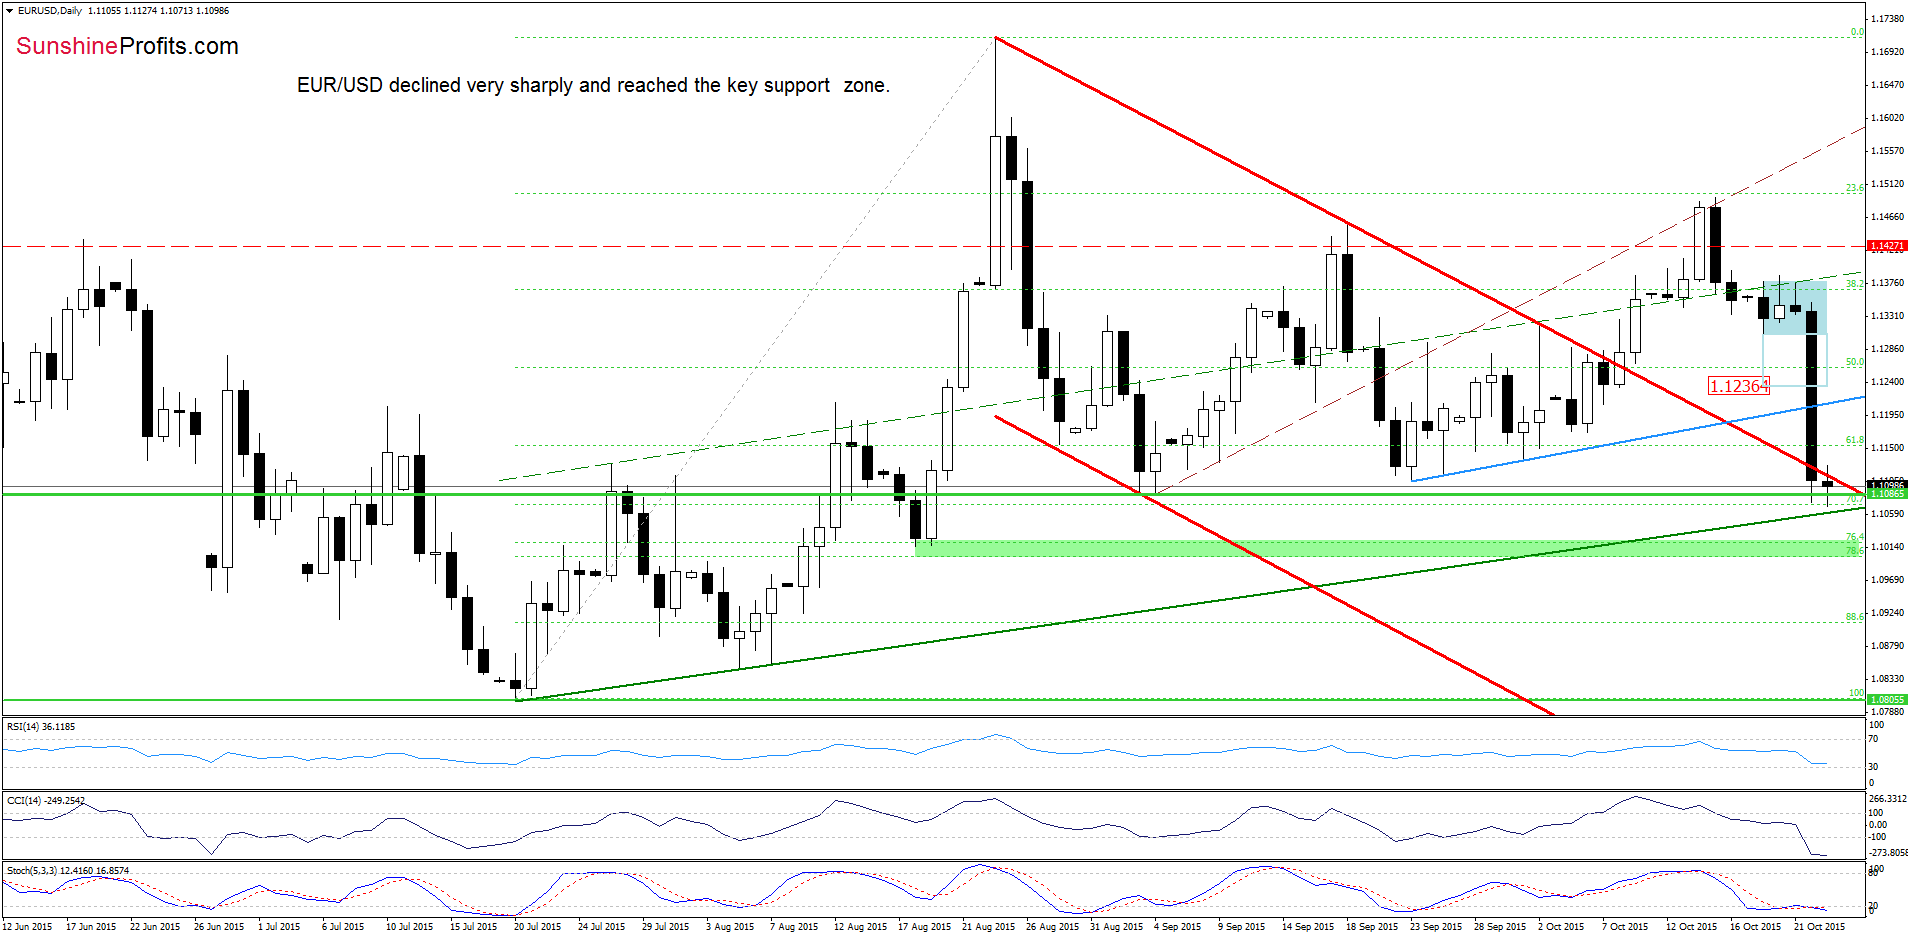
(…) EUR/USD verified the breakdown under the upper border of the rising trend channel (marked with green dashed line) earlier today. This negative event in combination with sell signals generated by the indicators encouraged currency bears to act, which resulted in further deterioration. Taking this fact into account, we believe that lower values of the exchange rate are just around the corner. If EUR/USD moves lower from here, the initial downside target would be the blue support line (around 1.1194) or even the previously-broken upper border of the red declining trend channel (currently around 1.1157).
Looking at the daily chart, we see that the situation developed in line with the above scenario and EUR/USD not only reached our downside target, but also dropped below it, slipping under the Sept low. Although this is a bearish signal, we should keep in mind that yesterday’s decline approached the pair to the medium-term green support line, which could encourage currency bulls to act. If this is the case and the exchange rate rebound from here, we may see an increase to around 1.1171, where the 23.6% Fibonacci retracement (based on the recent decline) is.
Nevertheless, please note that the weekly CCI generated a sell signal (similarly to what we saw in Aug), while the Stochastic Oscillator is close to doing the same, which suggests that even if we see a rebound from here, further deterioration in the coming weeks is more likely than not.Therefore, if EUR/USD drops under the above-mentioned support area the initial downside target would be around 1.1000-1.1022, where the next green support zone is.
Very short-term outlook: bearish
Short-term outlook: bearish
MT outlook: mixed with bearish bias
LT outlook: mixed
Trading position (short-term; our opinion): Short positions with a stop-loss order at 1.1887 are justified from the risk/reward perspective. We will keep you informed should anything change, or should we see a confirmation/invalidation of the above.
GBP/USD
Yesterday, we wrote:
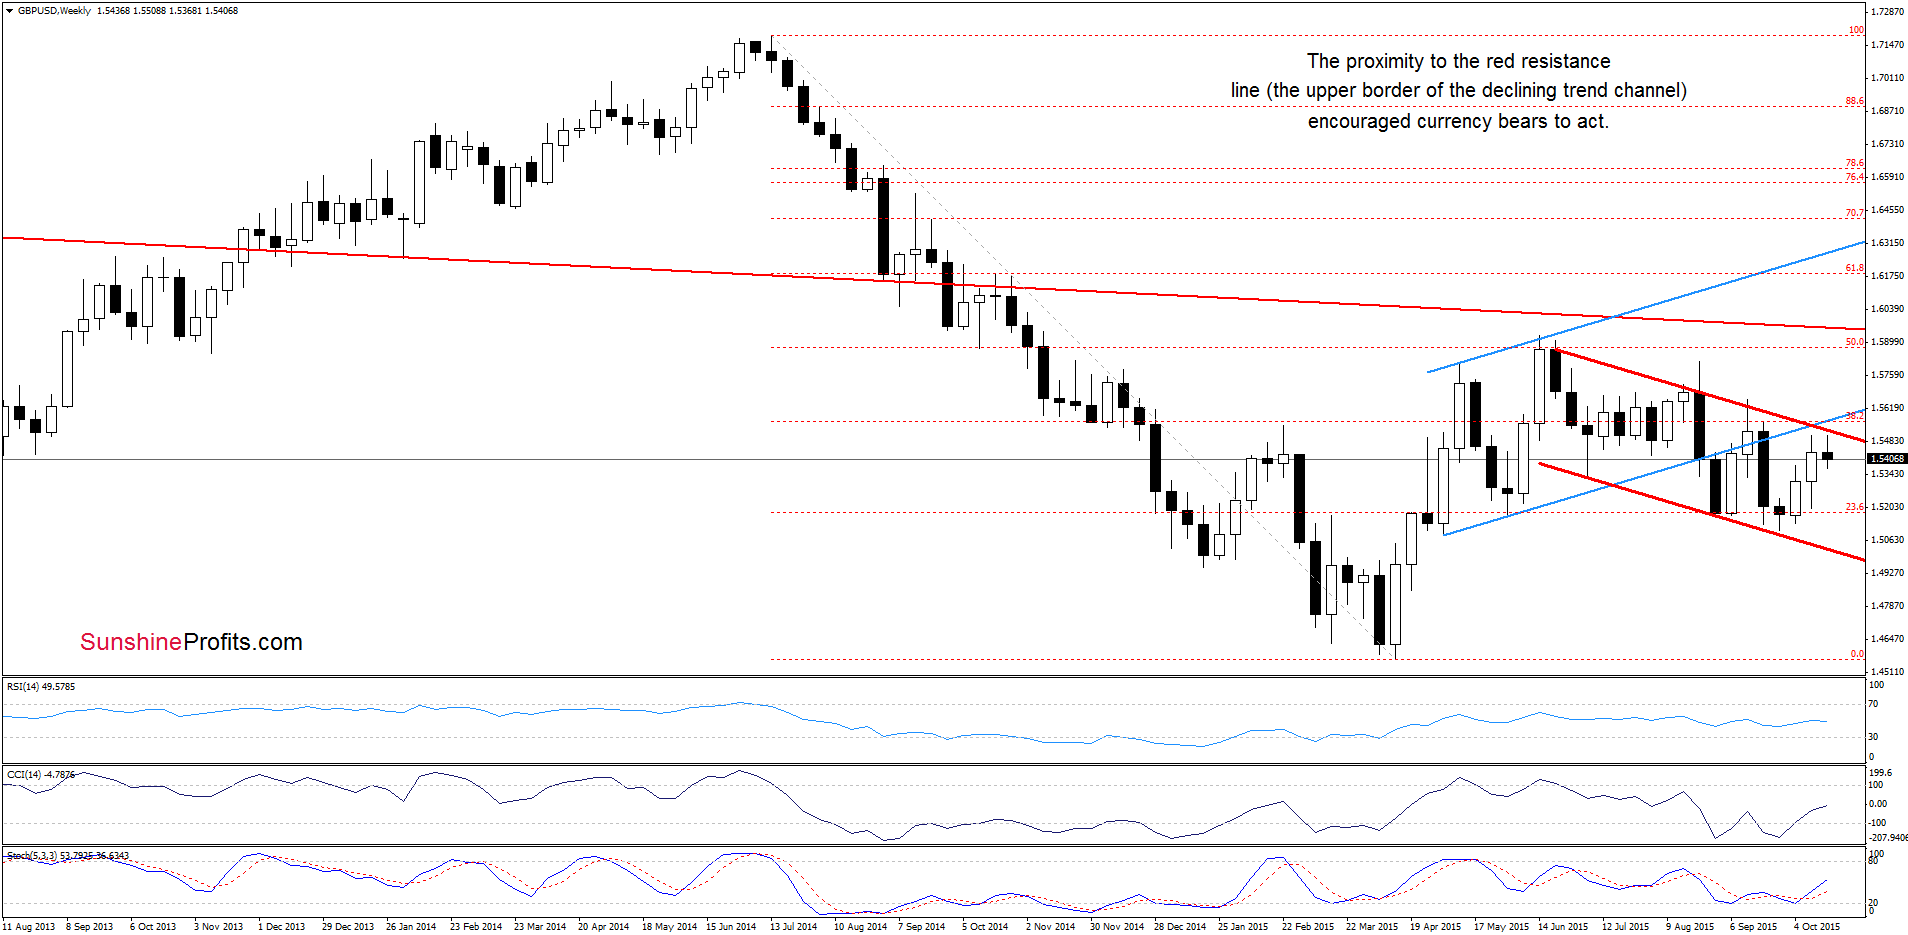
(…) GBP/USD extended gains and approached the upper border of the red declining trend channel, which suggests that the space for further rally might be limited.
As you see on the chart, the proximity to the red declining resistance line encouraged currency bears to act, which pushed the exchange rate lower (as we had expected).
How did this move affect the very short-term picture? Let’s examine the daily chart and find out.
In our previous commentary on this currency pair, we wrote:
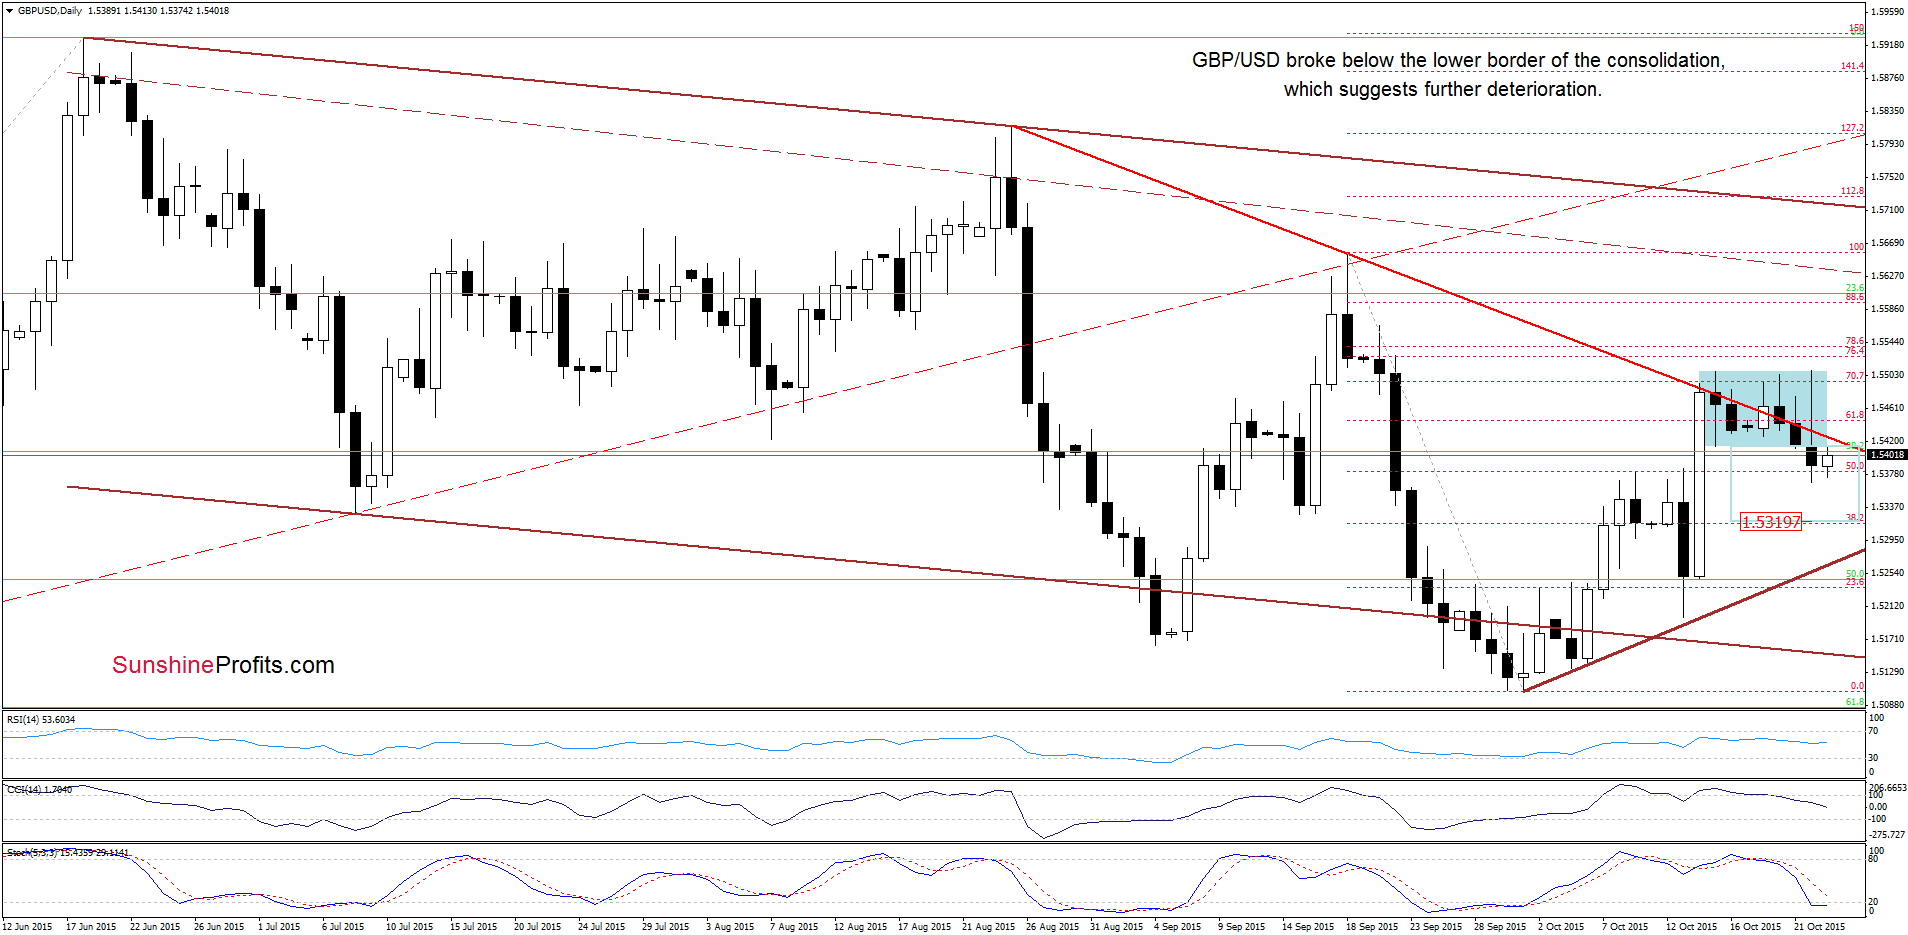
(…) the pair approached the upper border of the consolidation, but then gave up the gains, which means that as long as here is no breakout above this resistance further rally is questionable -especially when we factor in the situation in the medium term (on the chart below). (…) the daily CCI and Stochastic Oscillator generated sell signals, which could encourage currency bears to act and result in another test of the lower border of the consolidation in near future.
Yesterday, GBP/USD extended losses (as we had expected) and broke below the lower border of the consolidation, which is a negative signal. Although the pair moved little higher earlier today, we think that as long as there is no invalidation of the breakdown, all upswings would be nothing more than verification of the breakdown. Taking this fact into account, and combining it with sell signals generated by the indicators, we think that further deterioration should not surprise us. How low could the exchange rate go? I our opinion, the initial downside target would be around 1.5319, where the size of the downward move will correspond to the height of the formation. Nevertheless, this scenario will be more reliable if GBP/USD closes today’s session under the red line and the lower border of the consolidation.
Very short-term outlook: mixed with bearish bias
Short-term outlook: mixed
MT outlook: mixed
LT outlook: mixed
Trading position (short-term; our opinion): No positions are justified from the risk/reward perspective at the moment. We will keep you informed should anything change, or should we see a confirmation/invalidation of the above.
USD/JPY
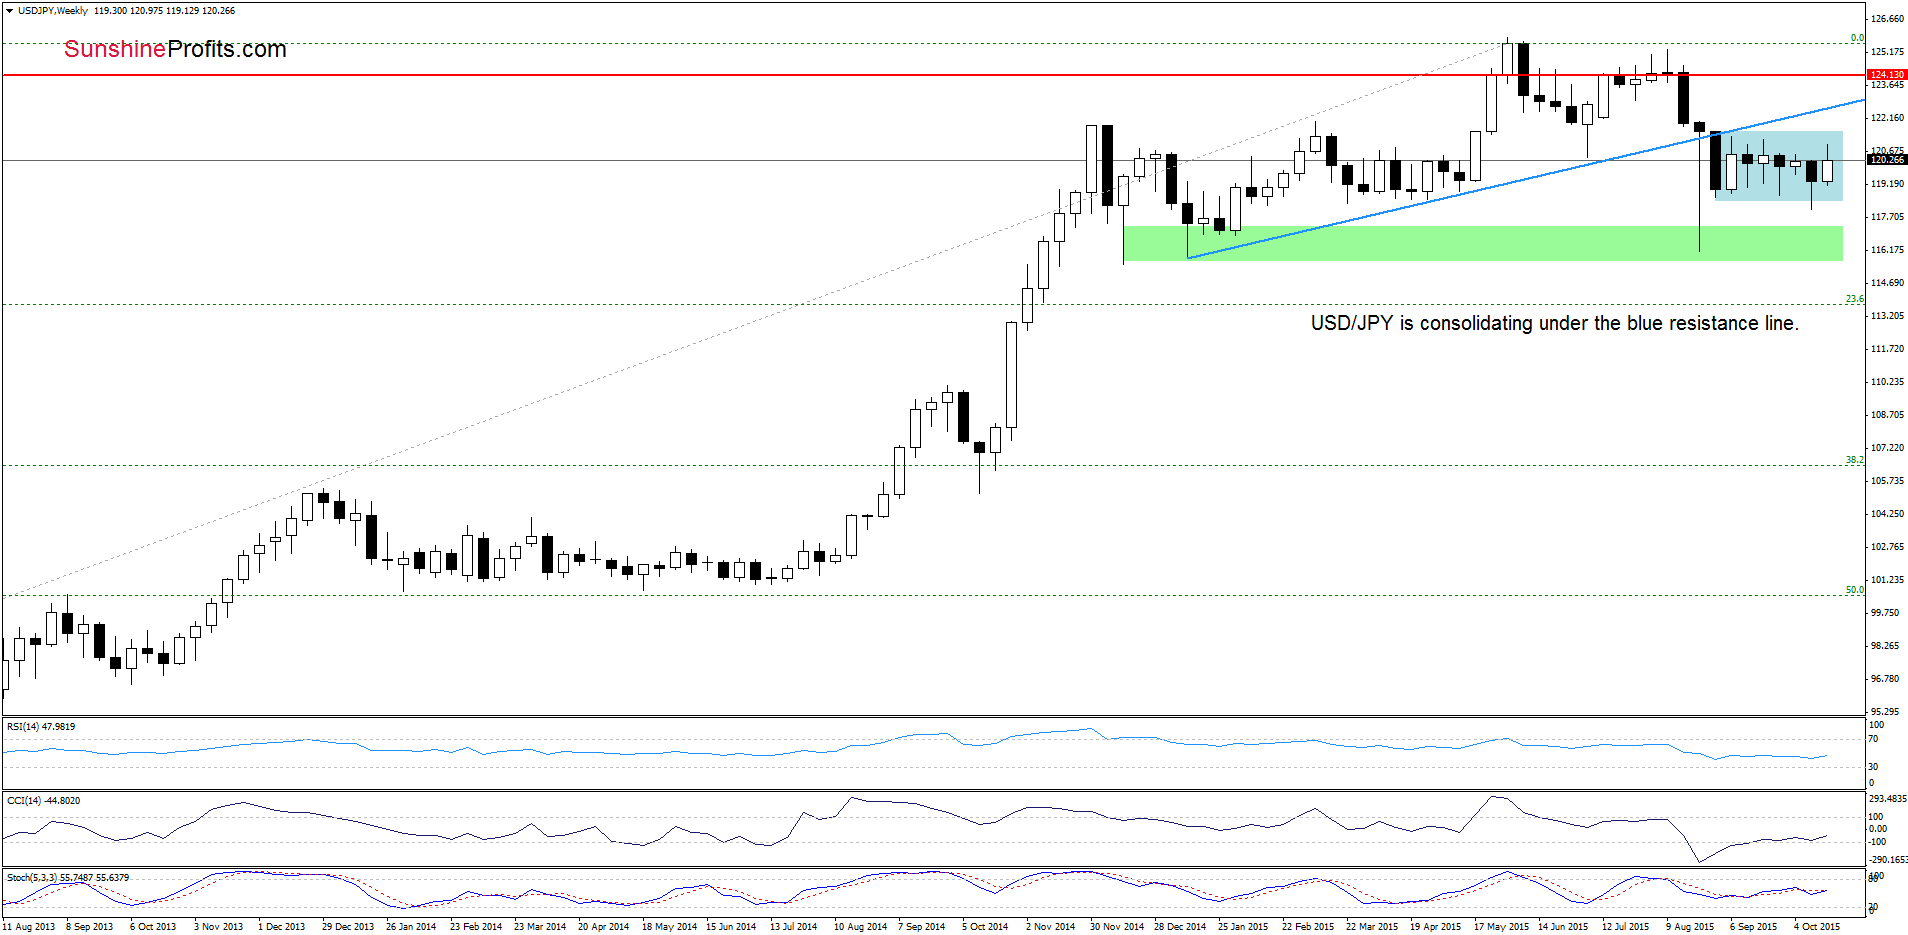
The situation in the medium-term hasn’t changed much since our last commentary was posted as the exchange rate is still trading in the consolidation under the blue resistance line.
Will the very short-term chart give us any clues about future moves? Let’s check.
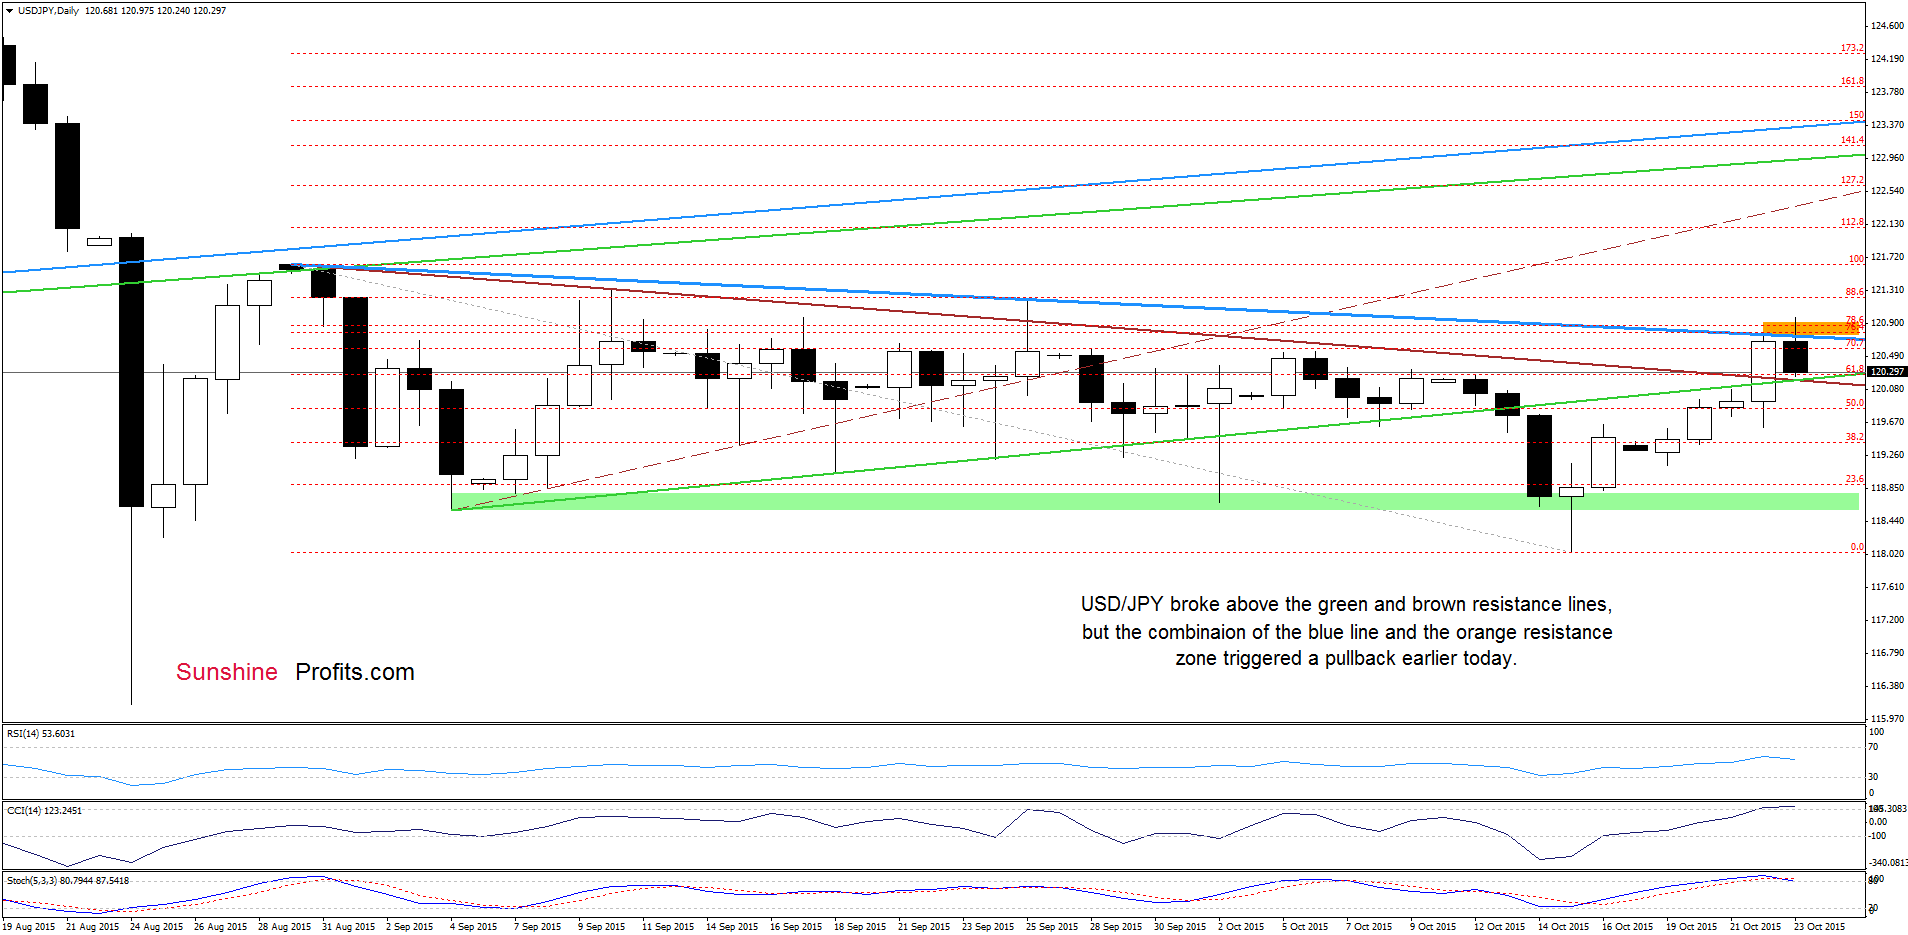
On Wednesday, we wrote:
(…) the current position of the indicators (buy signals remain in place) suggests that currency bulls will try to push the pair higher in the coming day(s). Nevertheless, even if they succeed, we think that further improvement will be more likely (and reliable) only if we see a confirmed breakout above the brown declining resistance line (currently around 120.23). Until this time, another downswing can’t be ruled out.
From today’s point of view we see that currency bulls managed to push the pair above the green and brown resistance lines, but the combination of the blue resistance line and the orange resistance zone (created by the 76.4% and 78.6% Fibonacci retracement levels) triggered a pullback earlier today. With this downswing the exchange rate slipped to the previously-broken lines, which suggests that we could see a rebound from here (and another test of the resistance area). Nevertheless, the current position of the indicators suggests that reversal and lower values of the exchange rate in the coming week should not surprise us.
Very short-term outlook: mixed
Short-term outlook: mixed
MT outlook: mixed
LT outlook: mixed
Trading position (short-term; our opinion): No positions are justified from the risk/reward perspective at the moment. We will keep you informed should anything change, or should we see a confirmation/invalidation of the above.
USD/CAD
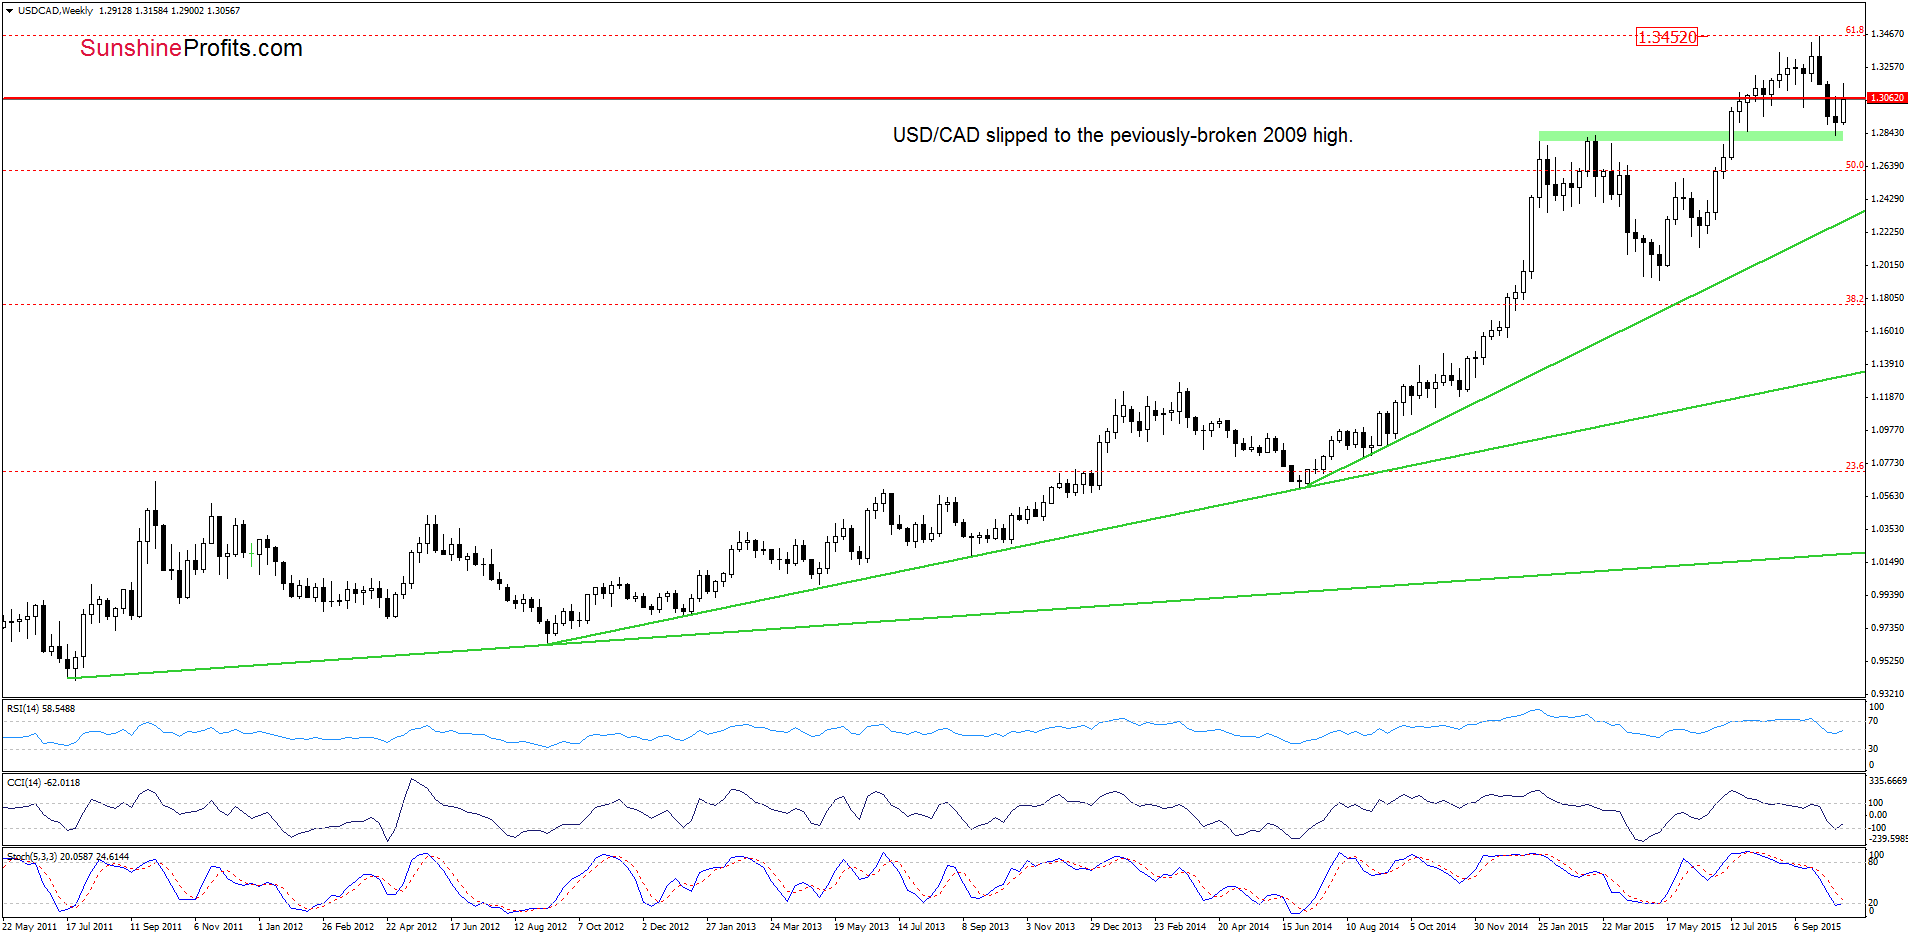
USD/CAD moved little lowed and slipped to the previously-broken 2009 high, which could encourage currency bulls to act.
What can we infer from the daily chart? Let’s check.
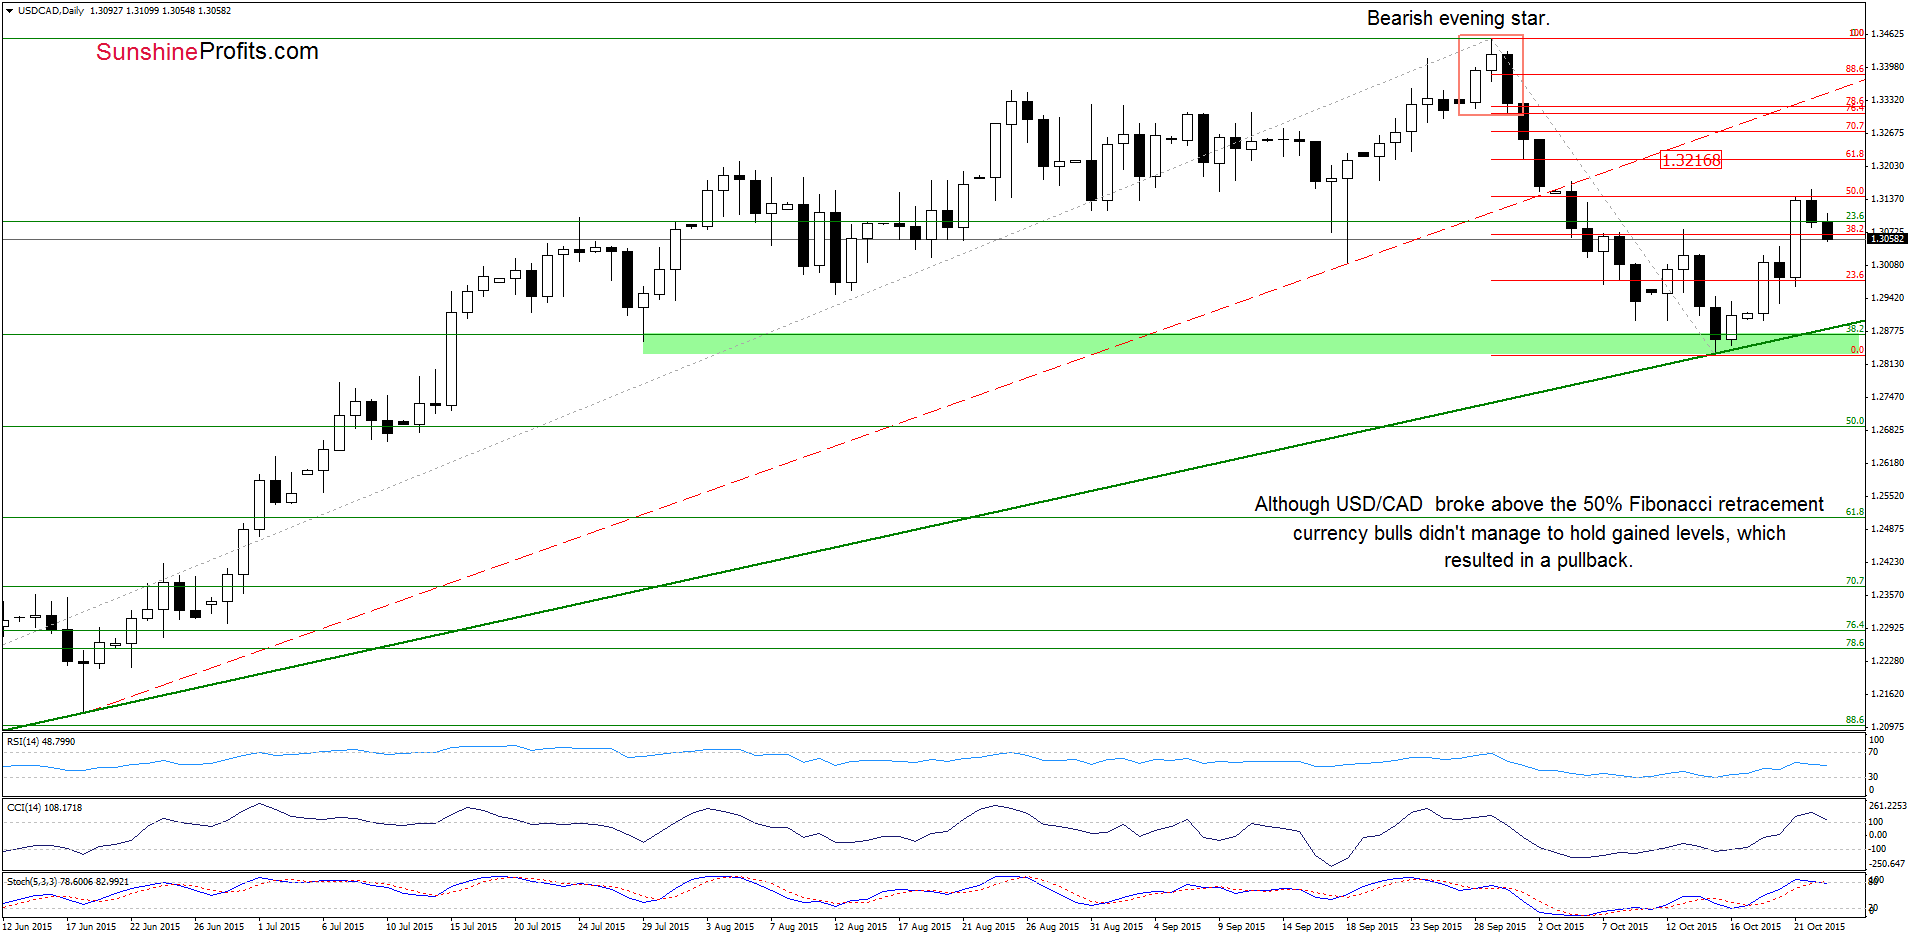
Yesterday, USD/CAD limbed above the 50% Fibonacci retracement, however, as it turned out this improvement was only temporary and the pair reversed invalidating earlier small breakout. This negative signal triggered further deterioration, which took the air to the previously-broken 38.2% Fibonacci retracement and the 2009 high. Although we could see a rebound from here, the current position of the indicators suggests that further deterioration is just around the corner. Nevertheless, another downward move will be more reliable if we see an invalidation of the breakout above the 2009 high and the CCI and Stochastic Oscillator generates sell signals. Until this time a rebound can’t be ruled out.
Very short-term outlook: mixed
Short-term outlook: mixed
MT outlook: mixed
LT outlook: mixed
Trading position (short-term; our opinion): No positions are justified from the risk/reward perspective at the moment. We will keep you informed should anything change, or should we see a confirmation/invalidation of the above.
USD/CHF
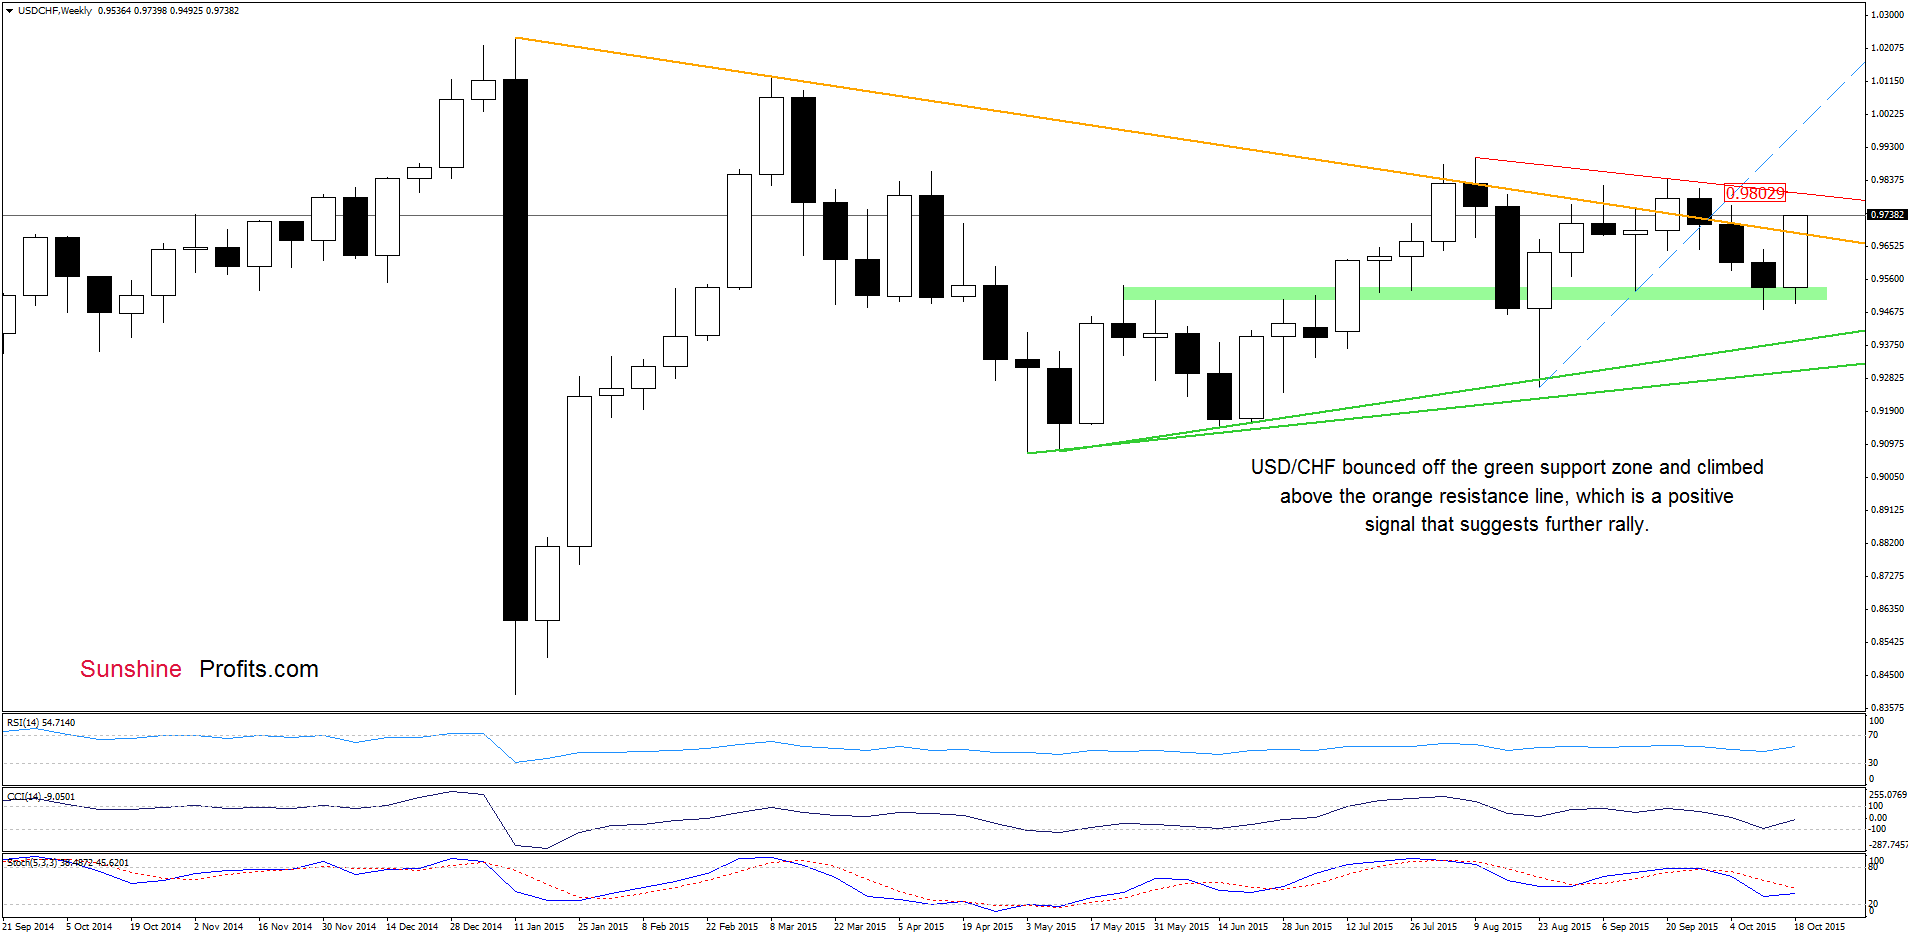
Looking at the medium-term chart, we see that USD/CHF bounced off the key support area (created by the green support zone) and climbed above the orange resistance line, invalidating earlier breakdown. This is a positive signal, which suggests further improvement.
How high could the pair go? Let’s examine the daily chart and find out.
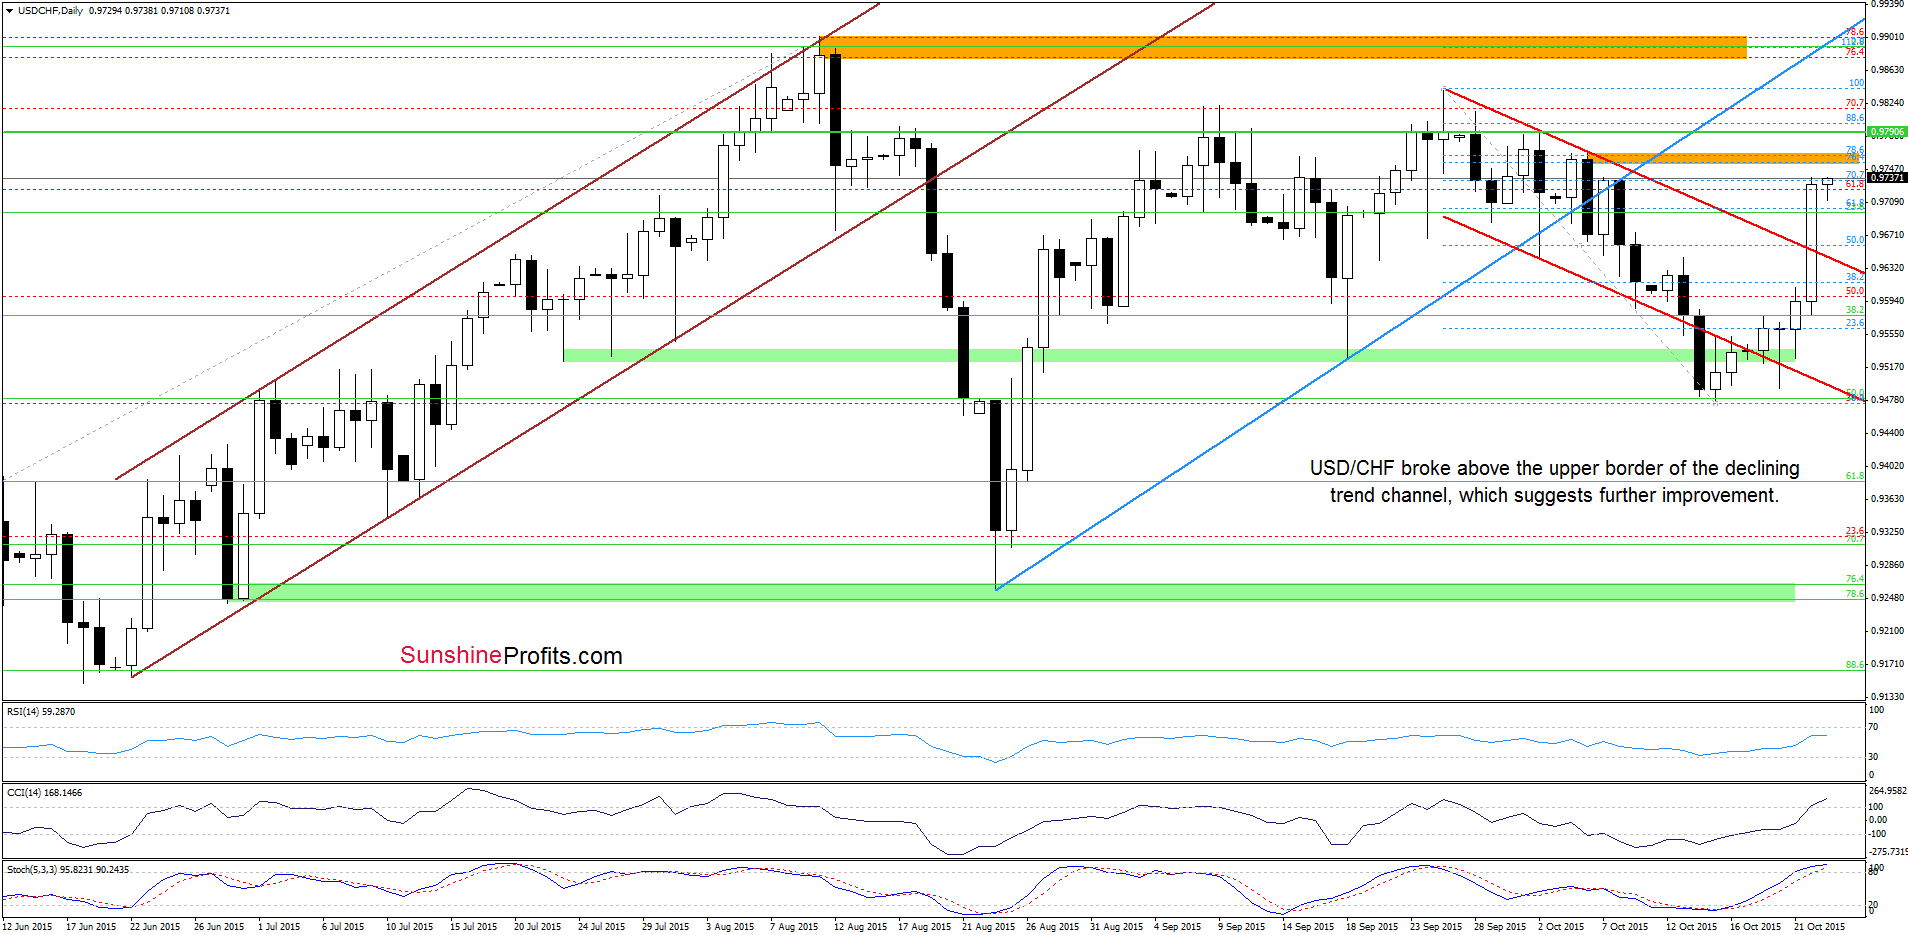
On Monday, we wrote the following:
(…) USD/CHF moved higher and invalidated the breakdown under the green support zone and the lower border of the red declining trend channel. This is a positive signal, which suggests further improvement – especially when we factor in buy signals generated by the indicators. How high could the pair go? In our opinion, the initial upside target would be around 0.9644, where the Oct 13 high is. If this resistance is broken, we may see an increase to the upper border of the declining trend channel in the coming days.
From today’s point of view we see that currency bulls took USD/CHF not only to our upside target, but also managed to push the pair above it. With this rally the exchange rate broke above the upper border of the declining trend channel, which suggests further improvement and an increase to around 0.9755-0.9763, where the orange resistance zone (created by the 76.4% and 78.6% Fibonacci retracement levels) is. If this area is broken, the next upside target would be around 0.9800, where the red declining resistance line (based on the Aug and Sept highs and marked on the weekly chart) is. Nevertheless, please keep in mind that the current position of the indicators suggests that reversal in the coming week should not surprise us.
Very short-term outlook: mixed with bullish bias
Short-term outlook: mixed
MT outlook: mixed
LT outlook: mixed
Trading position (short-term; our opinion): No positions are justified from the risk/reward perspective at the moment. We will keep you informed should anything change, or should we see a confirmation/invalidation of the above.
AUD/USD
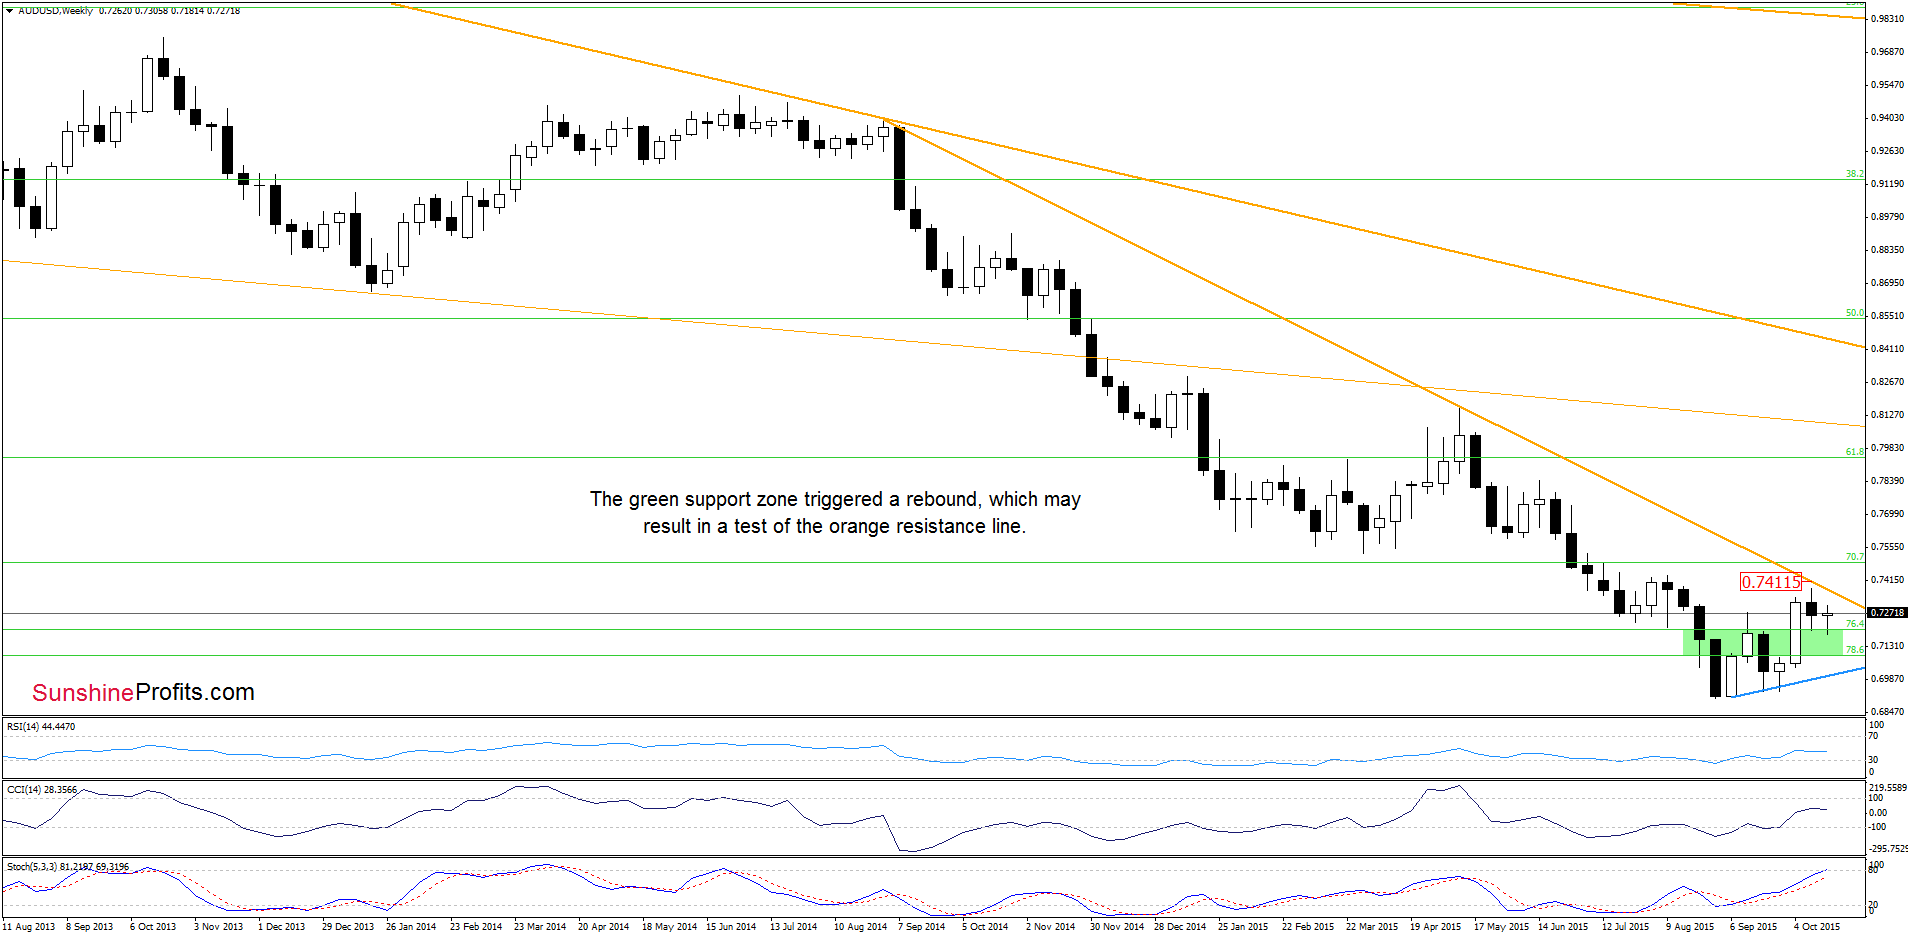
Looking at the weekly chart we see that the green support zone stopped currency bears and AUD/USD rebounded.
How did this upswing affect the very short-term picture? Let’s heck.
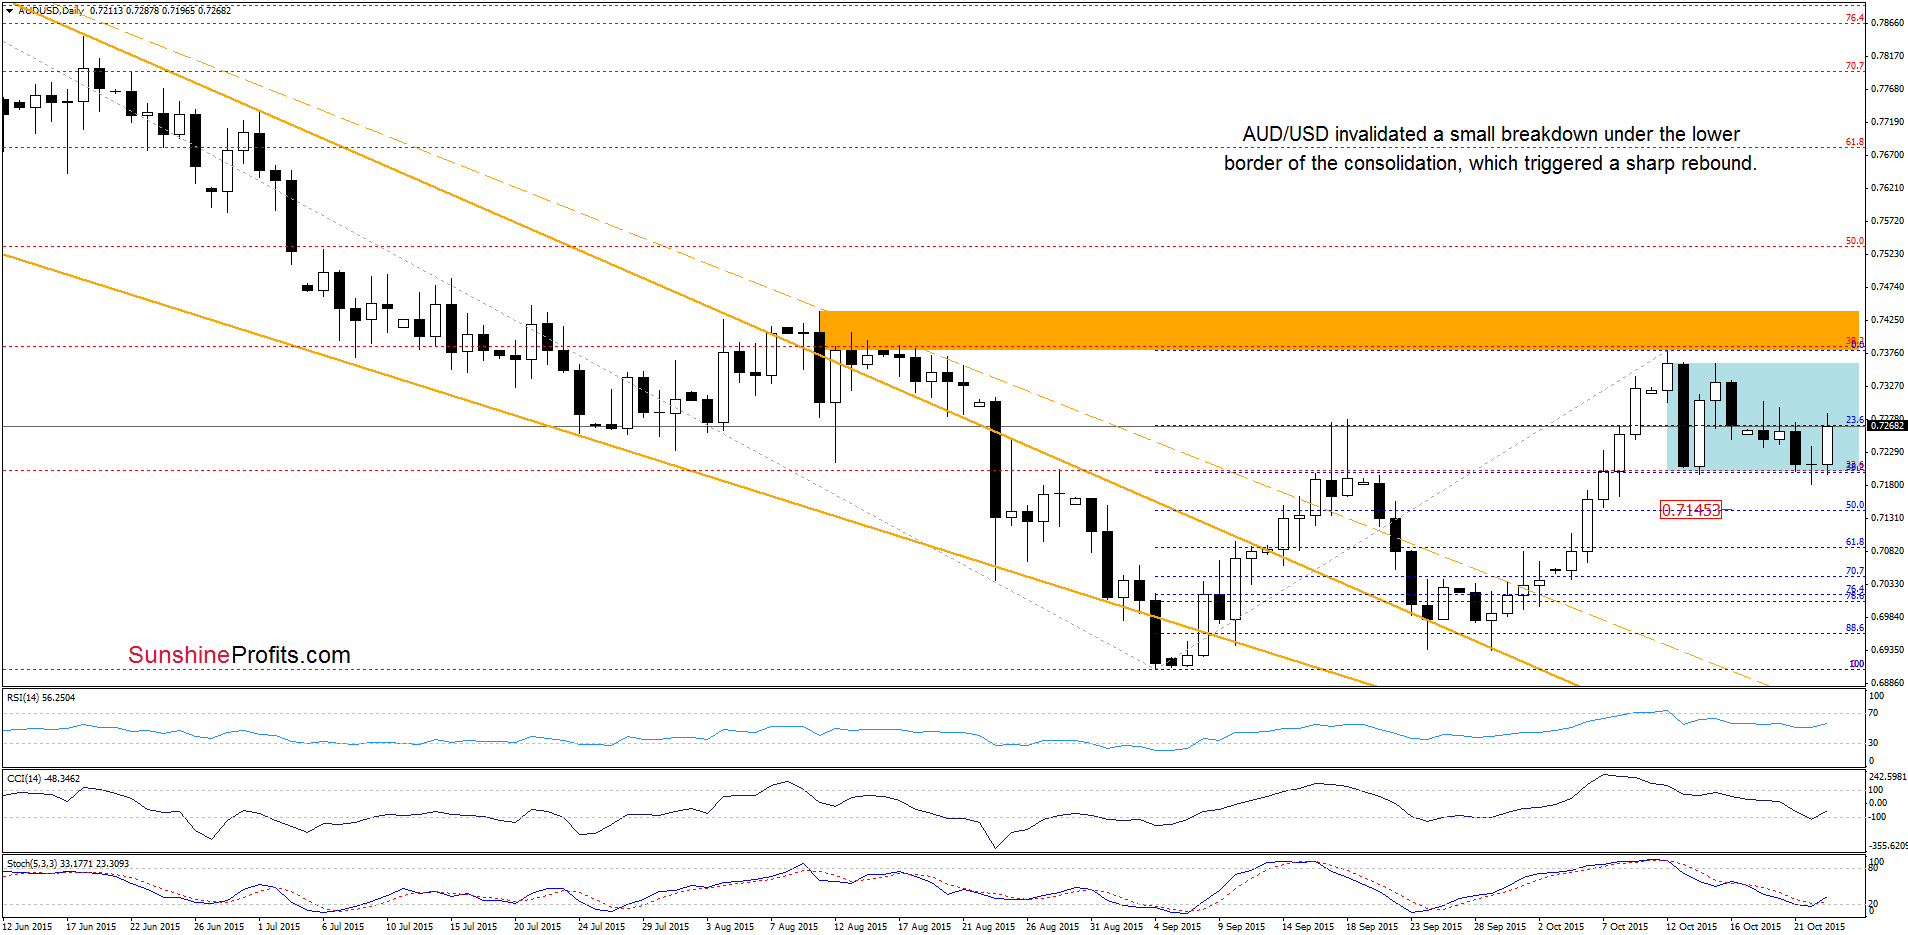
On the daily chart we see that currency bears pushed the pair below the lower border of the consolidation, AUD/USD reversed and increased, invalidating earlier breakdown. As a result, the exchange rate extended gains earlier today, which suggests that we could see a test of the upper border of the consolidation (around 0.7362) and the orange resistance line (marked on the weekly chart) in the coming week – especially if daily indicators generate buy signals.
Very short-term outlook: mixed with bullish bias
Short-term outlook: mixed
MT outlook: mixed
LT outlook: mixed
Trading position (short-term; our opinion): No positions are justified from the risk/reward perspective at the moment. We will keep you informed should anything change, or should we see a confirmation/invalidation of the above.
Thank you.
Nadia Simmons
Forex & Oil Trading Strategist
Przemyslaw Radomski, CFA
Founder, Editor-in-chief
Gold & Silver Trading Alerts
Forex Trading Alerts
Oil Investment Updates
Oil Trading Alerts

